andrew.lundgren@LIGO.ORG - posted 18:15, Tuesday 26 March 2013 - last comment - 11:01, Thursday 28 March 2013(5895)
DQ: Low-frequency glitchiness in the PSL ISS since ER3
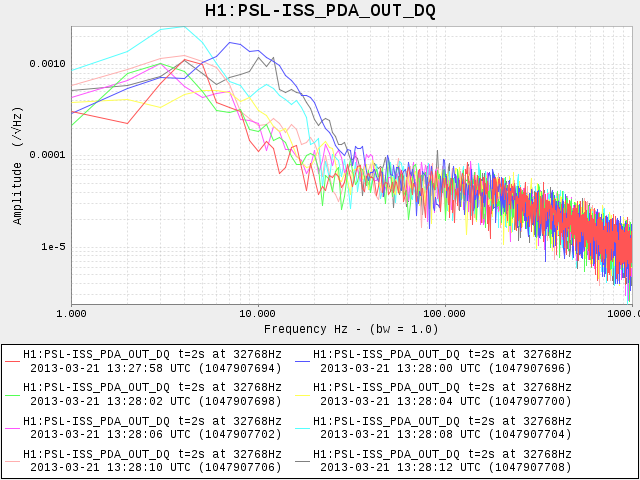
The out-of-loop PD for the PSL intensity stabilization (H1:PSL-ISS_PDA_OUT_DQ) was used to produce the fake strain channel during engineering run 3 in February. It was very clean overall, but there were a lot of low-frequency glitches. The glitches are all short and below about 55 Hz, and there seem to be more in the 10-25 Hz range. The glitches are every few seconds, not regular, but the rate was pretty much constant during the day. These glitches are still there in recent data. Robert Schofield told me that this frequency range isn't environmental but is likely to be electronic. The glitches are also seen in QPD_DX and QPD_DY.

If we can help diagnose this, don't hesitate to contact detchar@ligo.org and andrew.lundgren@ligo.org.

The attached plots are:
1. A typical day of ER3 as seen by Omicron (the replacement for the OmegaOnline web reports).
2. A similar plot for 5 minutes of recent (last weekend) data.
3. As above, but QPD_DX.
4. As above, but QPD_DY.
5. A selection of 2-second spectra, showing the instability.
Images attached to this report
Comments related to this report
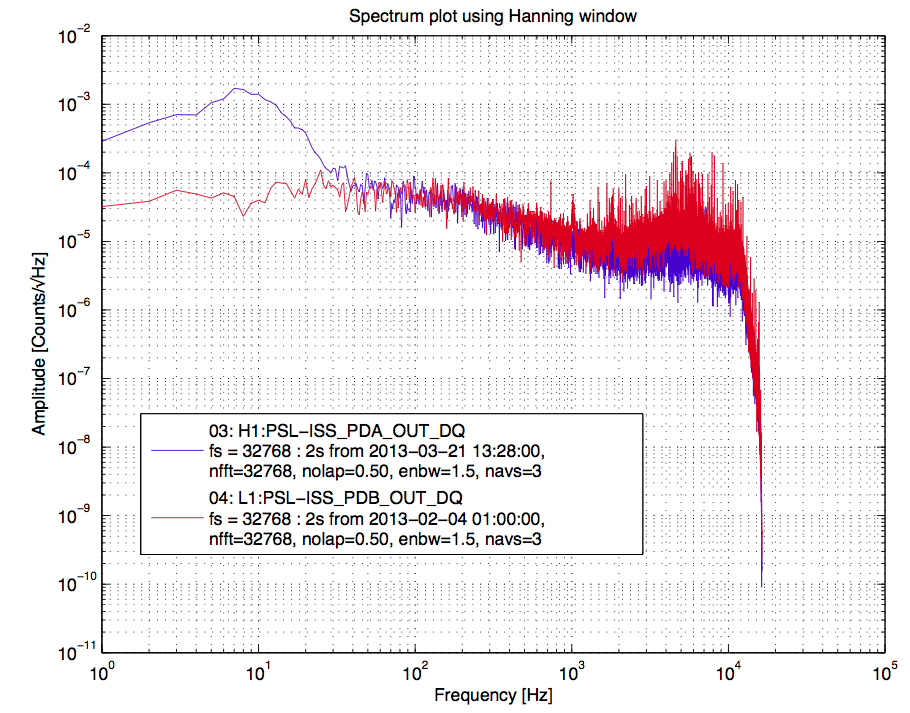
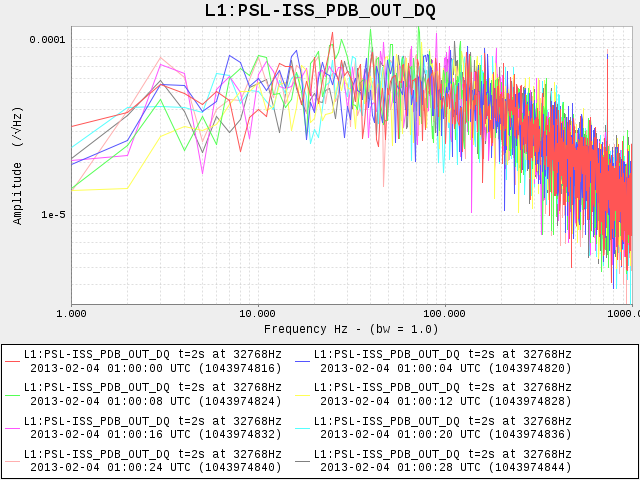
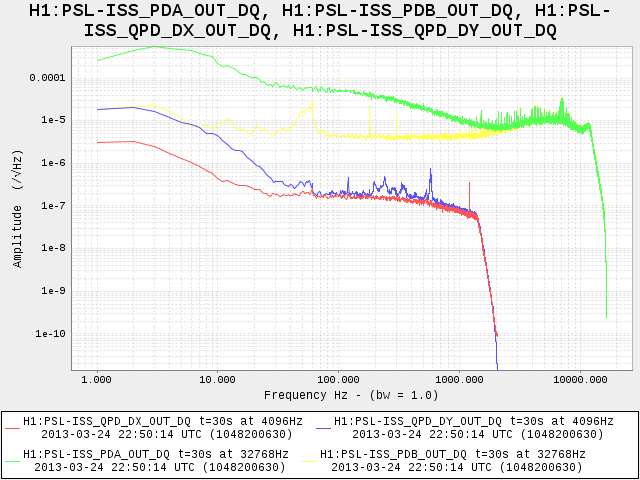
In answer to a few questions:

1. L1, before the work on the photodiodes started, was perfectly clean and did not have similar glitches. The first plot below compares the two spectra. They are nearly identical except at low frequencies. The next two plots show several spectra from L1 and H1, showing that L1 is stable and H1 has a lot of spectrum variability at low frequencies.
2. Jan Poeld suggested that PSL-PWR_PMC_TRANS might be interesting. But unfortunately it's not recorded.
3. The fourth plot shows the spectra of the four PDs. The in-loop PD, PDB, is fairly nasty around 60 Hz, although this doesn't show up as glitchiness, just in the spectrum. QPD_DY also has some lines in it.
4. The attached PDF has SNR versus frequency of the four PDs. The in-loop PDB shows no glitchiness, probably because the glitches are suppressed by the loop. QPD_DY has the loudest glitches of the other three.
Images attached to this comment

Non-image files attached to this comment
