Tue. Jul/06/2021 B path alignment done (Georgia, Keita)
Bpath 2nd lens (B:L2) was moved as far back toward the SFI2 as possible. Good matching. Alignment done.
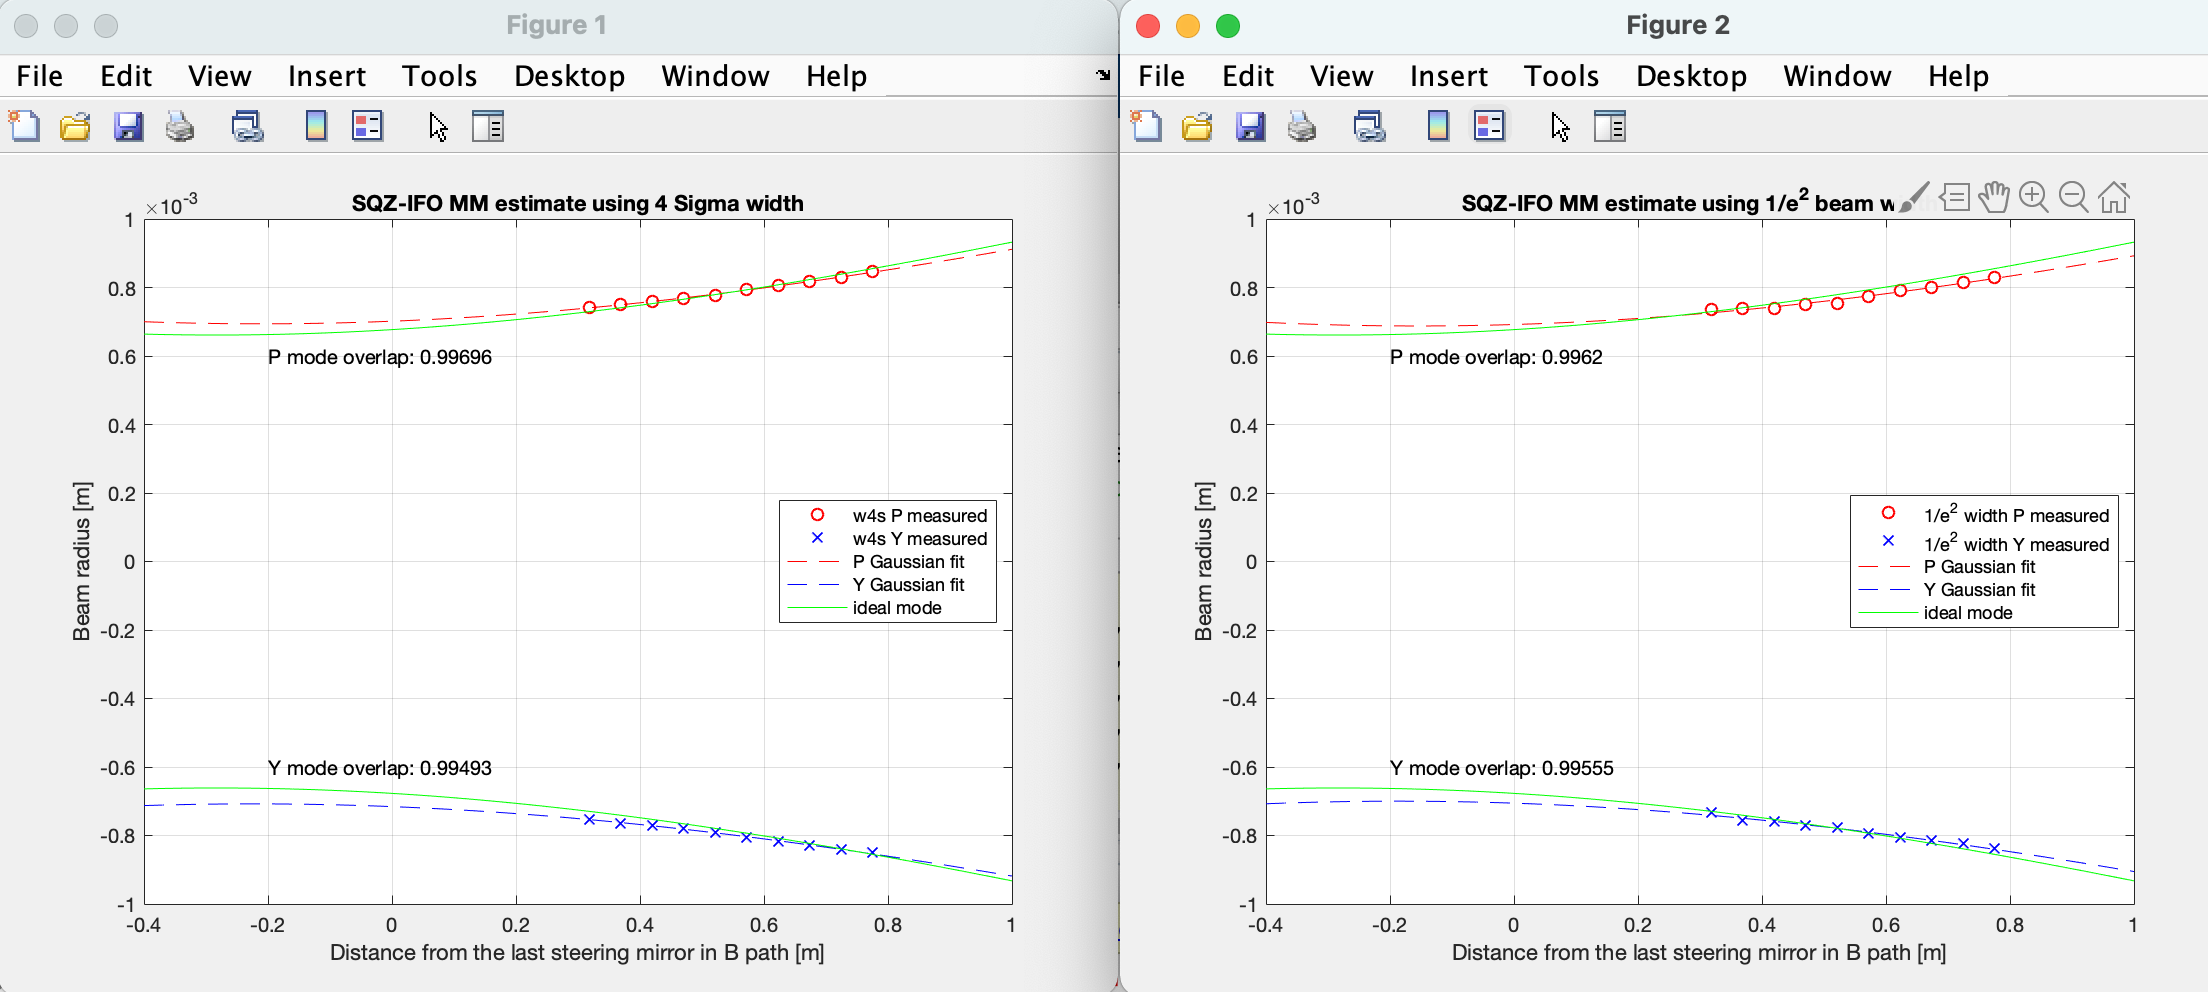
We did the mode shape scan with a new in-vac fiber we installed last week. The mode overlap was good (99% for P and 98.2% for Y when using D4S width, or 98.6 and 97.9% when using 13.5% width), but since it seemed like we could improve it by just moving B:L2. We moved it toward SFI2 by ~2 inches or so (1st attachment), and it did indeed improve things (99.7 and 99.5% respectively with D4S width, or 99.6 99.6% with 13.5% width, 2nd attachment).
We forgot to measure the distance from B:M3 to B:L2.
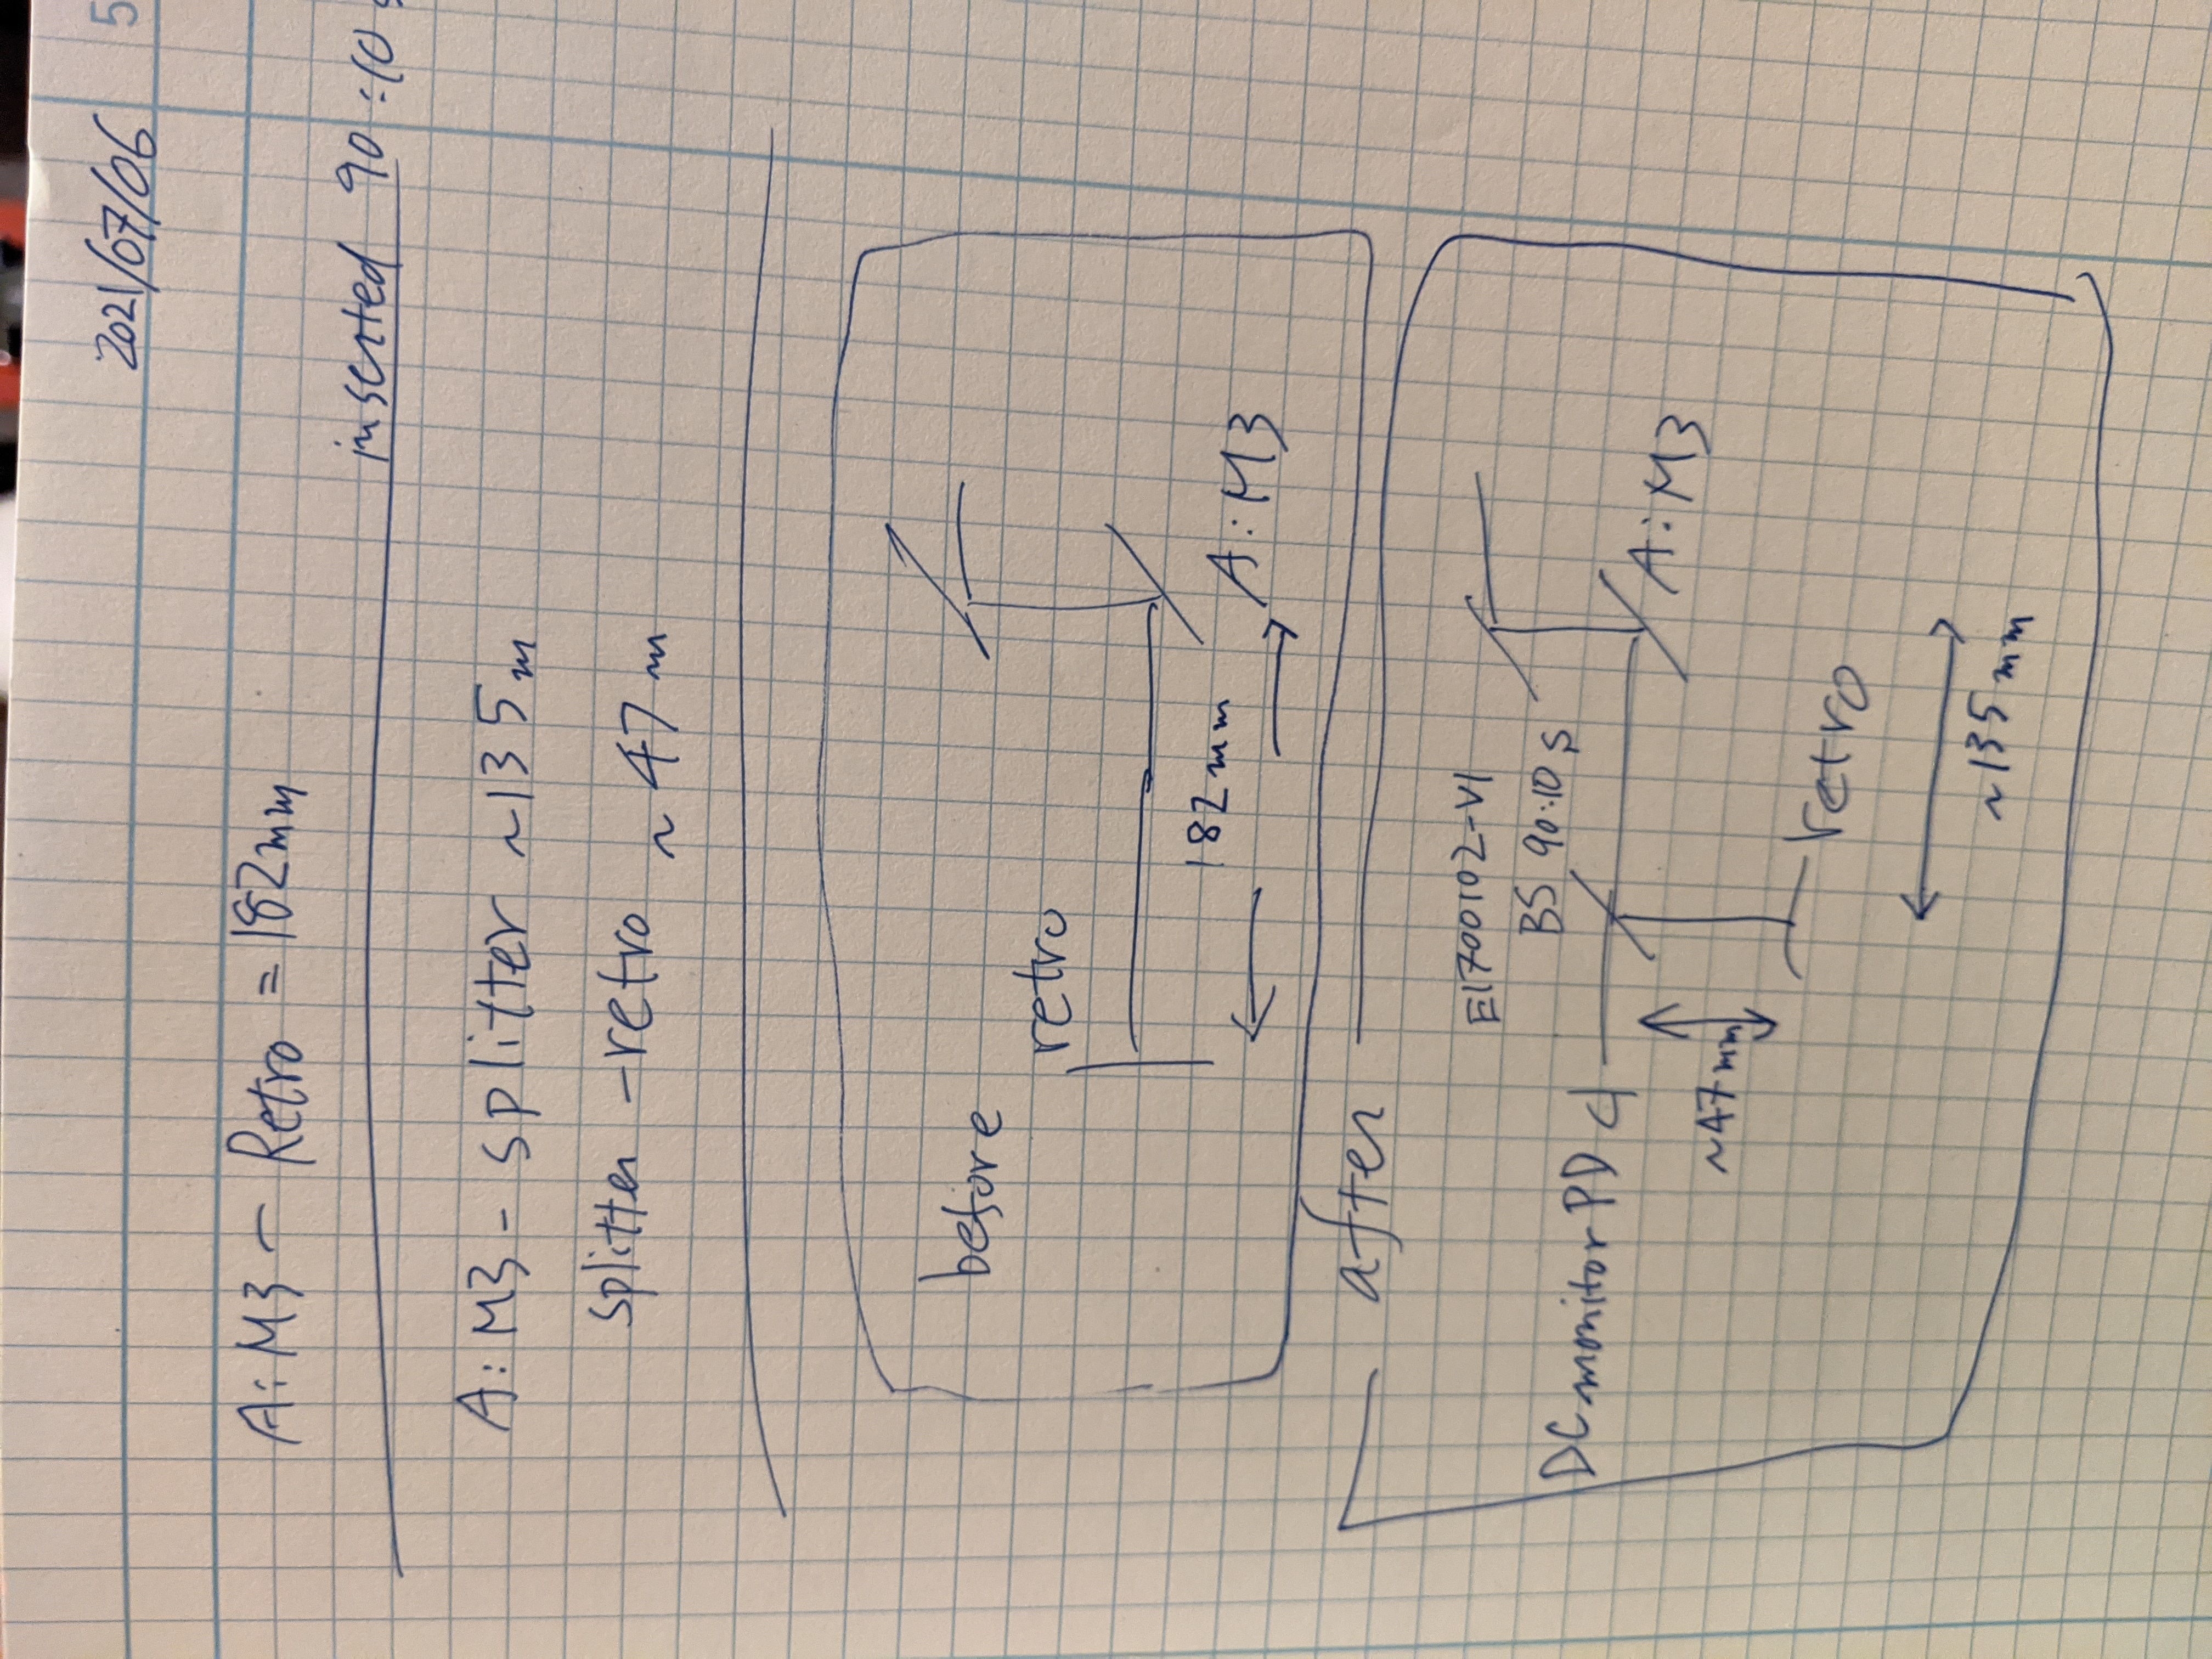
Configuration change for retro reflection in FC path.
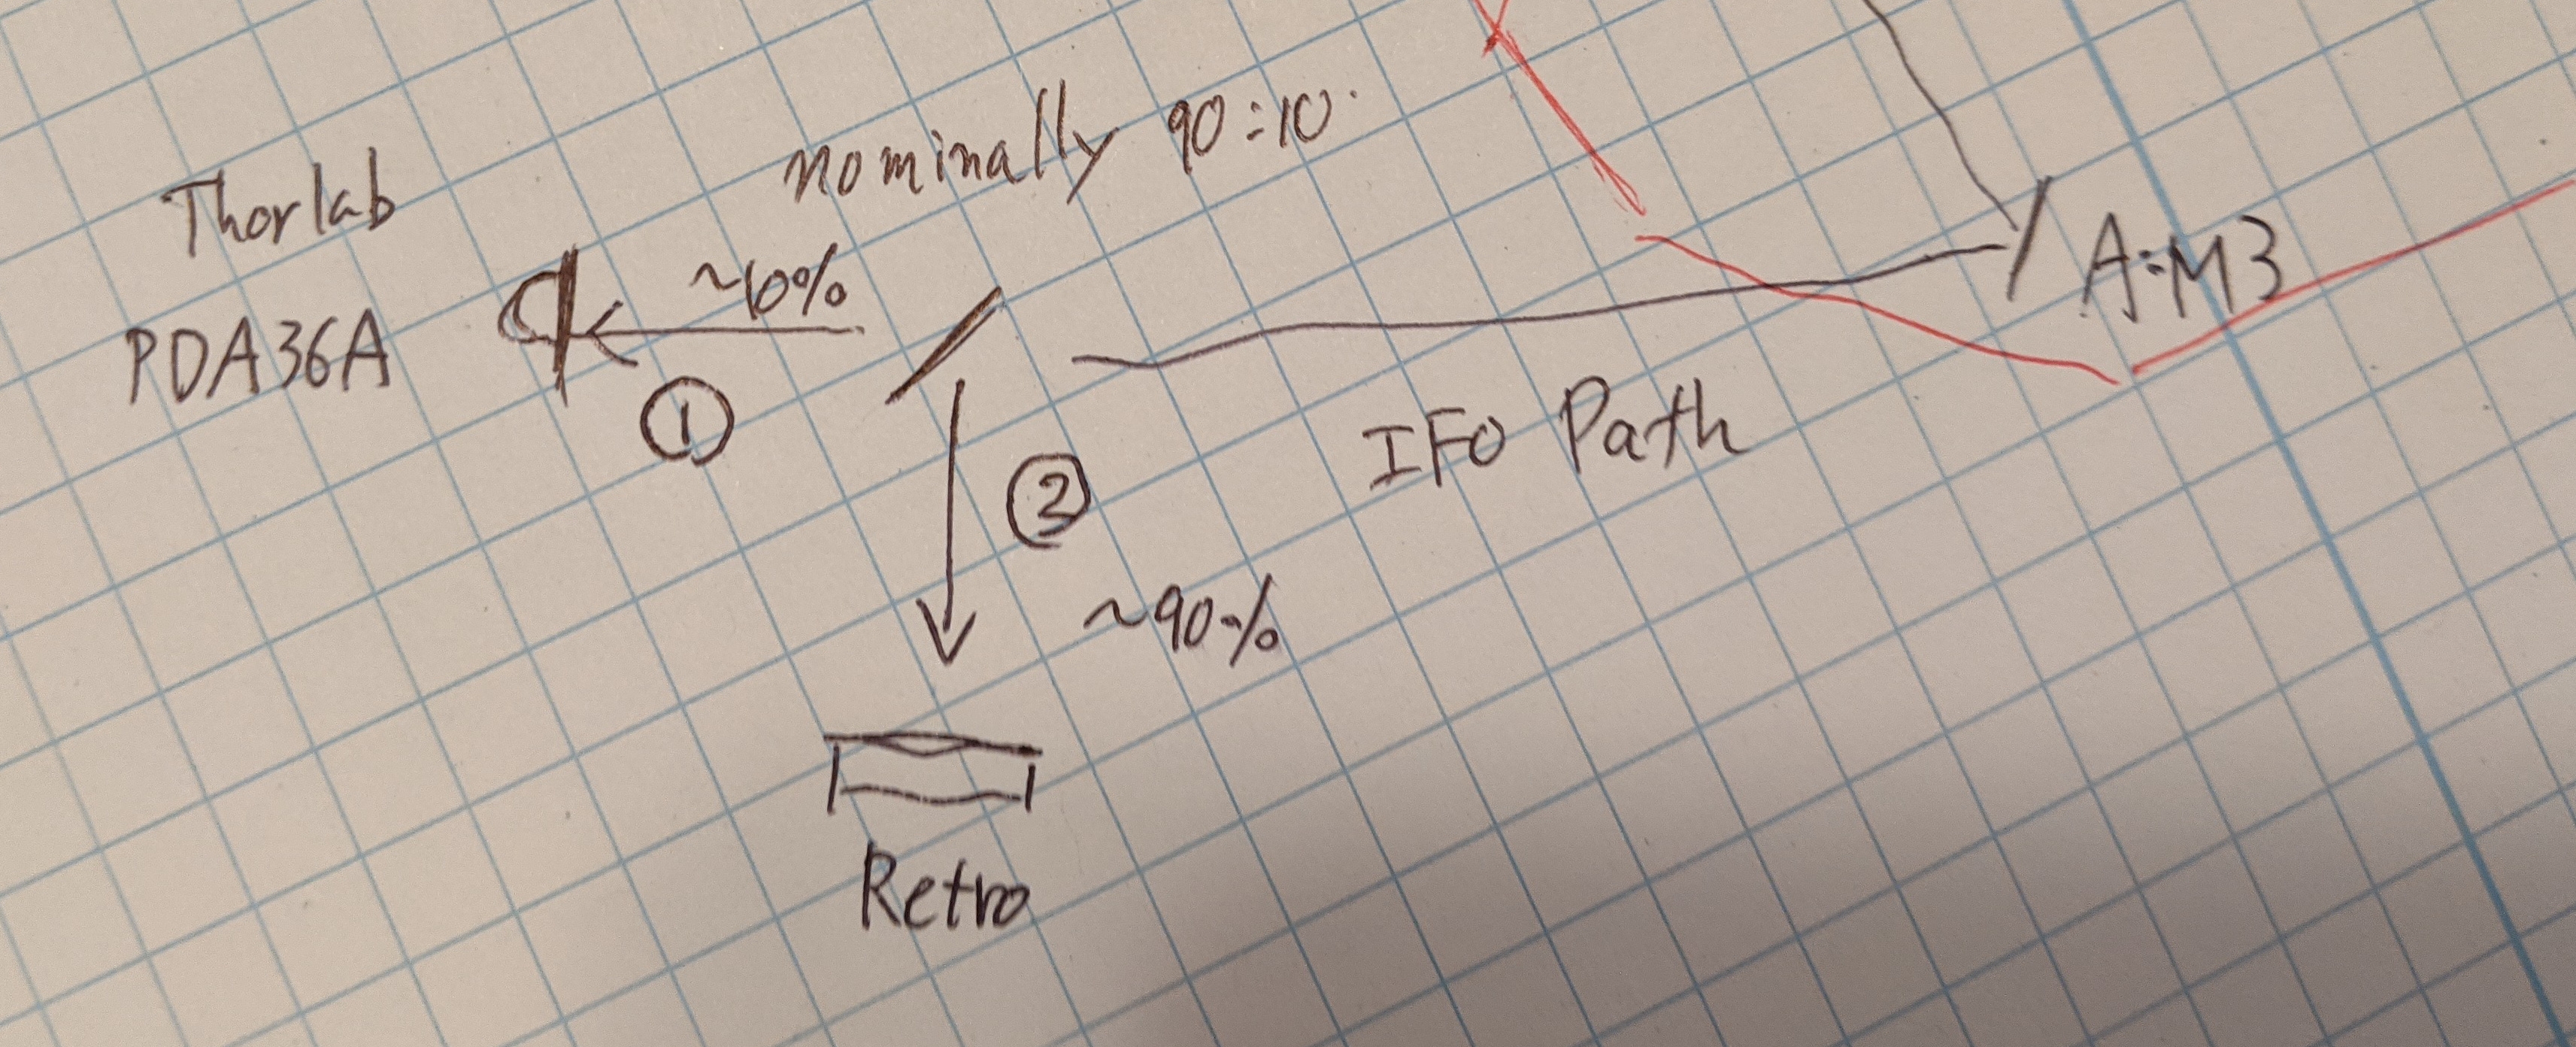
Following Masayuki and Adam's recommendation, we inserted a 90:10 splitter in the retroreflection path so we can monitor the change in the IR power upstream when we measure the power in B path (3rd attachment). We also made a contraption like this one at LLO.
Now we're ready to do some power measurements.
Bad mode shape into the fiber coupler seems to be coming from the laser.
We did some investigations to see where the bad mode shape going into the in-air IR fiber (alog 59325) comes from, but it really seems to be the laser itself. We leave it as is.
FYI, last week the configuration was like this.
laser ----- HWP -- PBS -- More than 90% is dumped in P pol(mostly S) | S pol | \--- EOM --- HWP ---- fiber couplerlaser ----- 90:10 -- HWP -- PBS -- (P pol is dumped)(mostly S) | | (90% is dumped) S pol | \--- EOM --- HWP ---- fiber coupler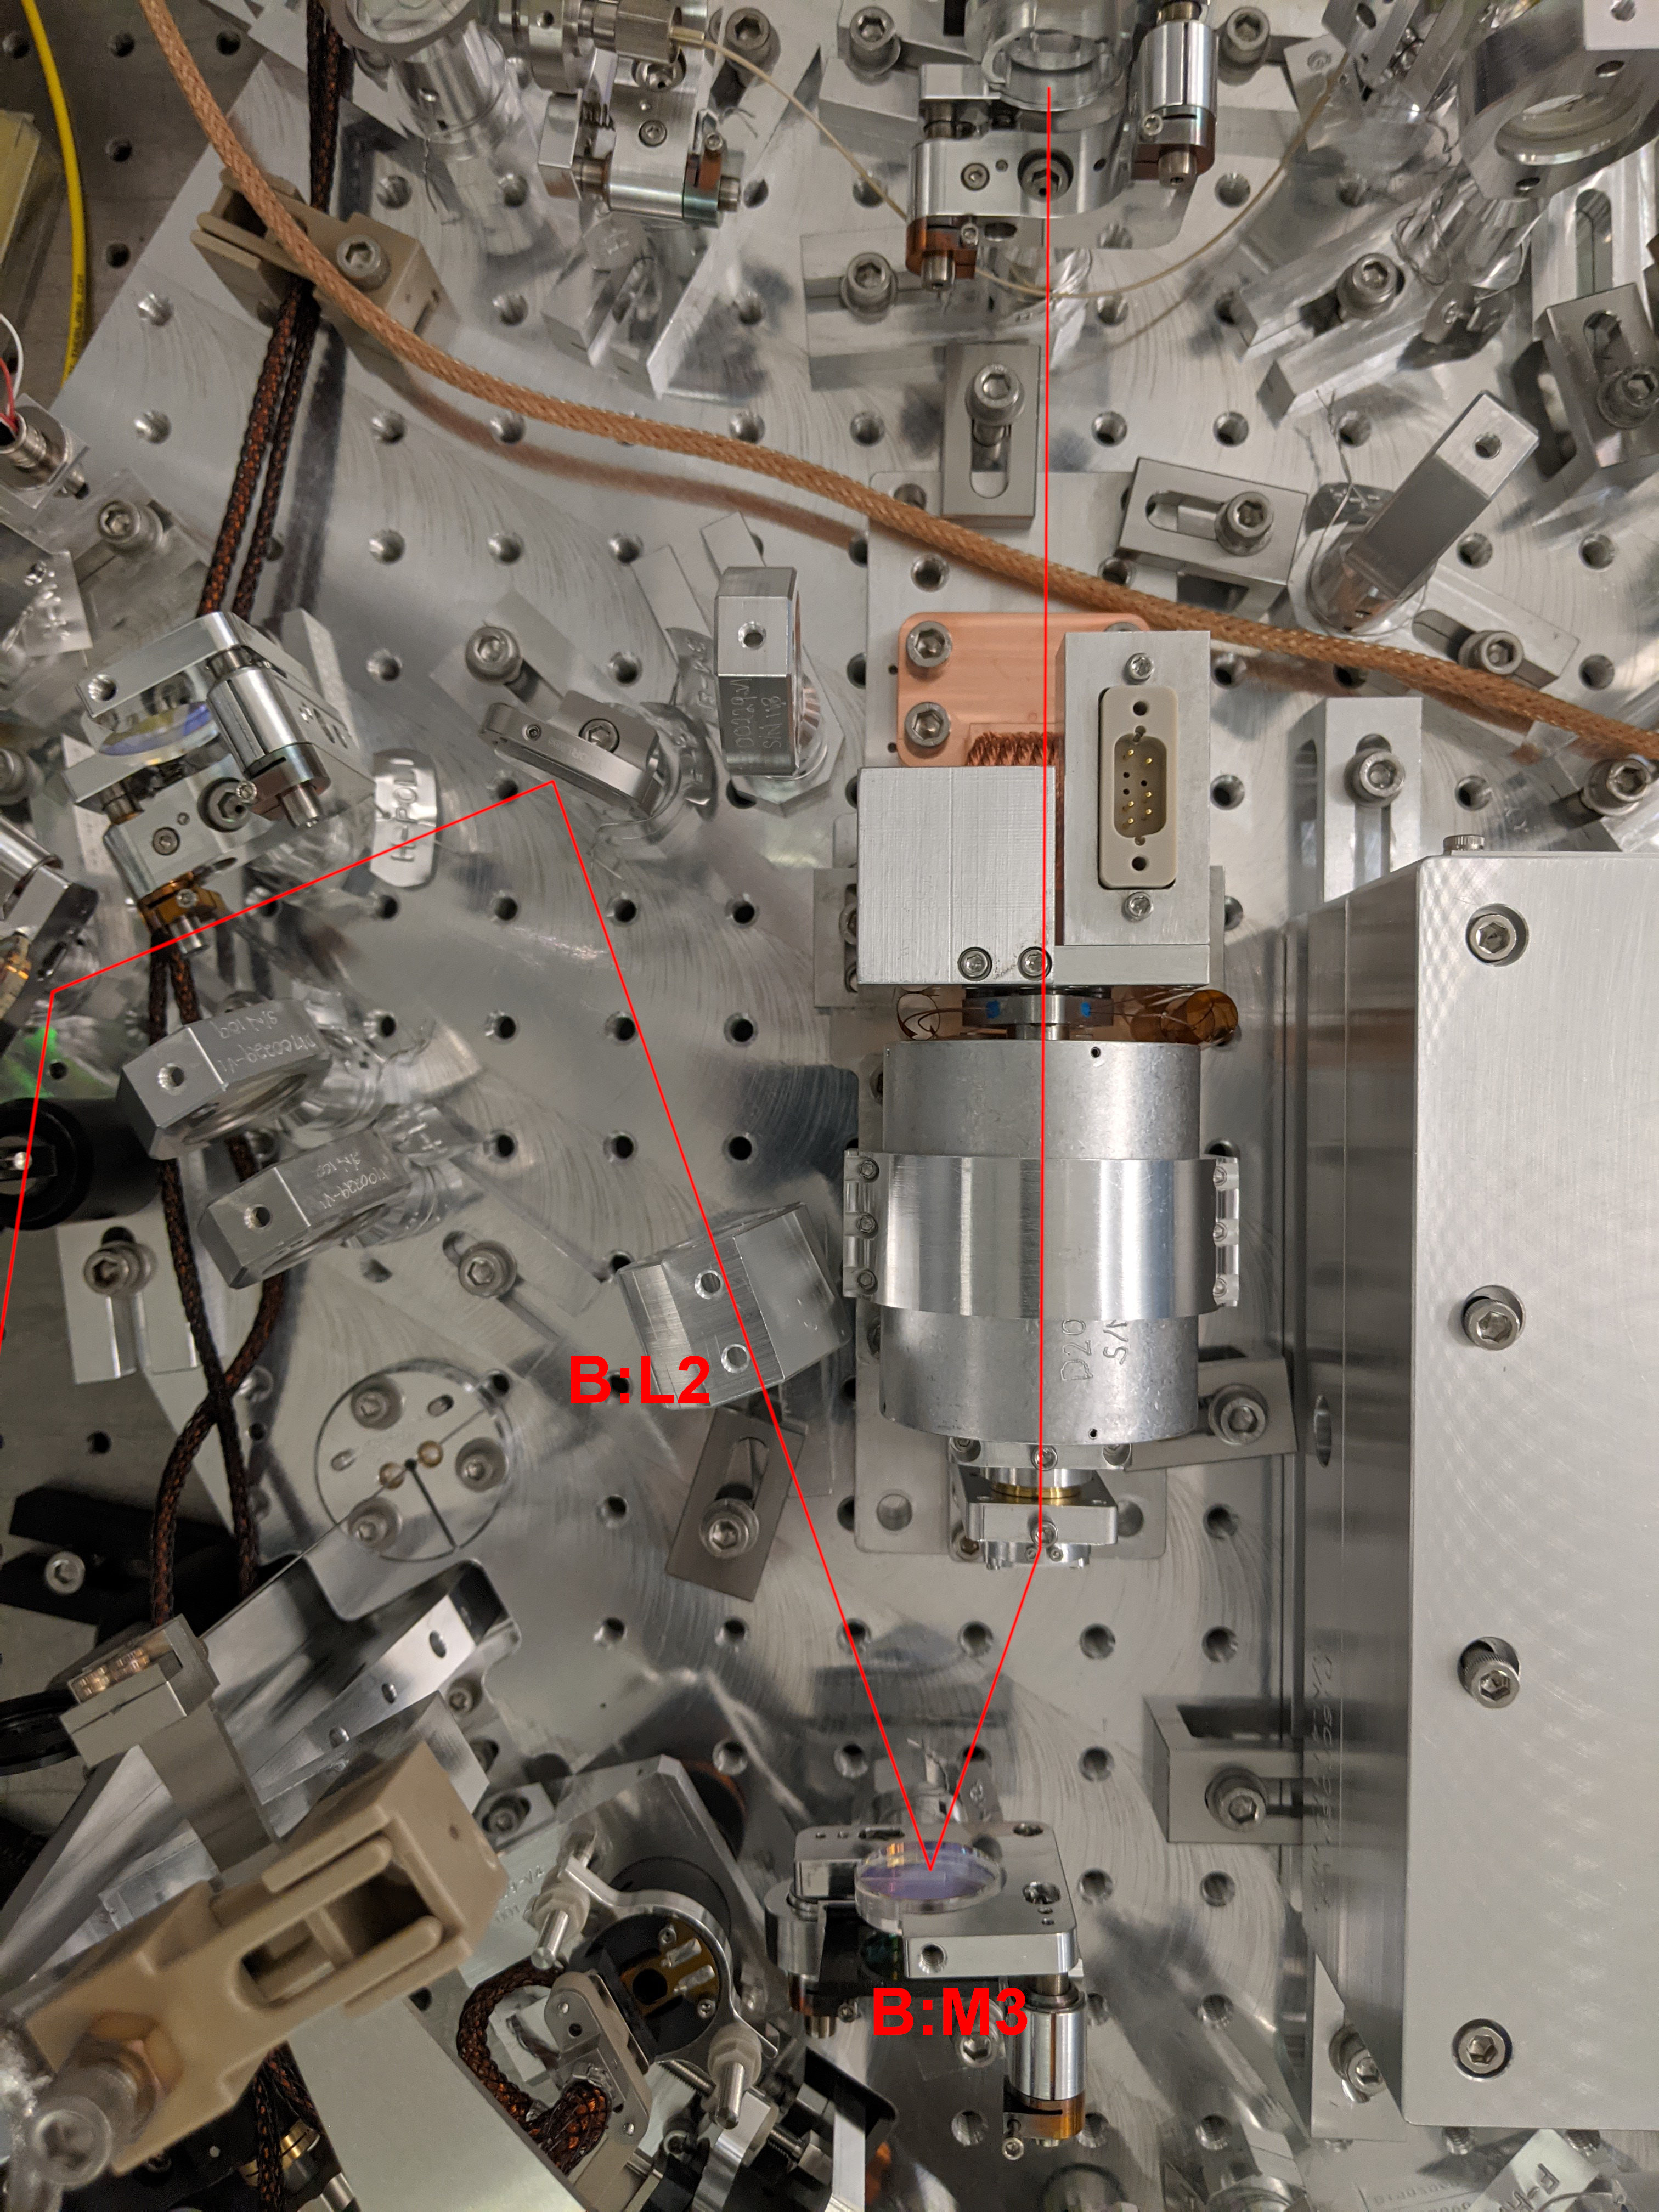
Camilla, Georgia
Today we worked on a power budget for the A and B paths (OPO-FC and FC-IFO), including transmission measurements of SFI1 and SFI2.
Method
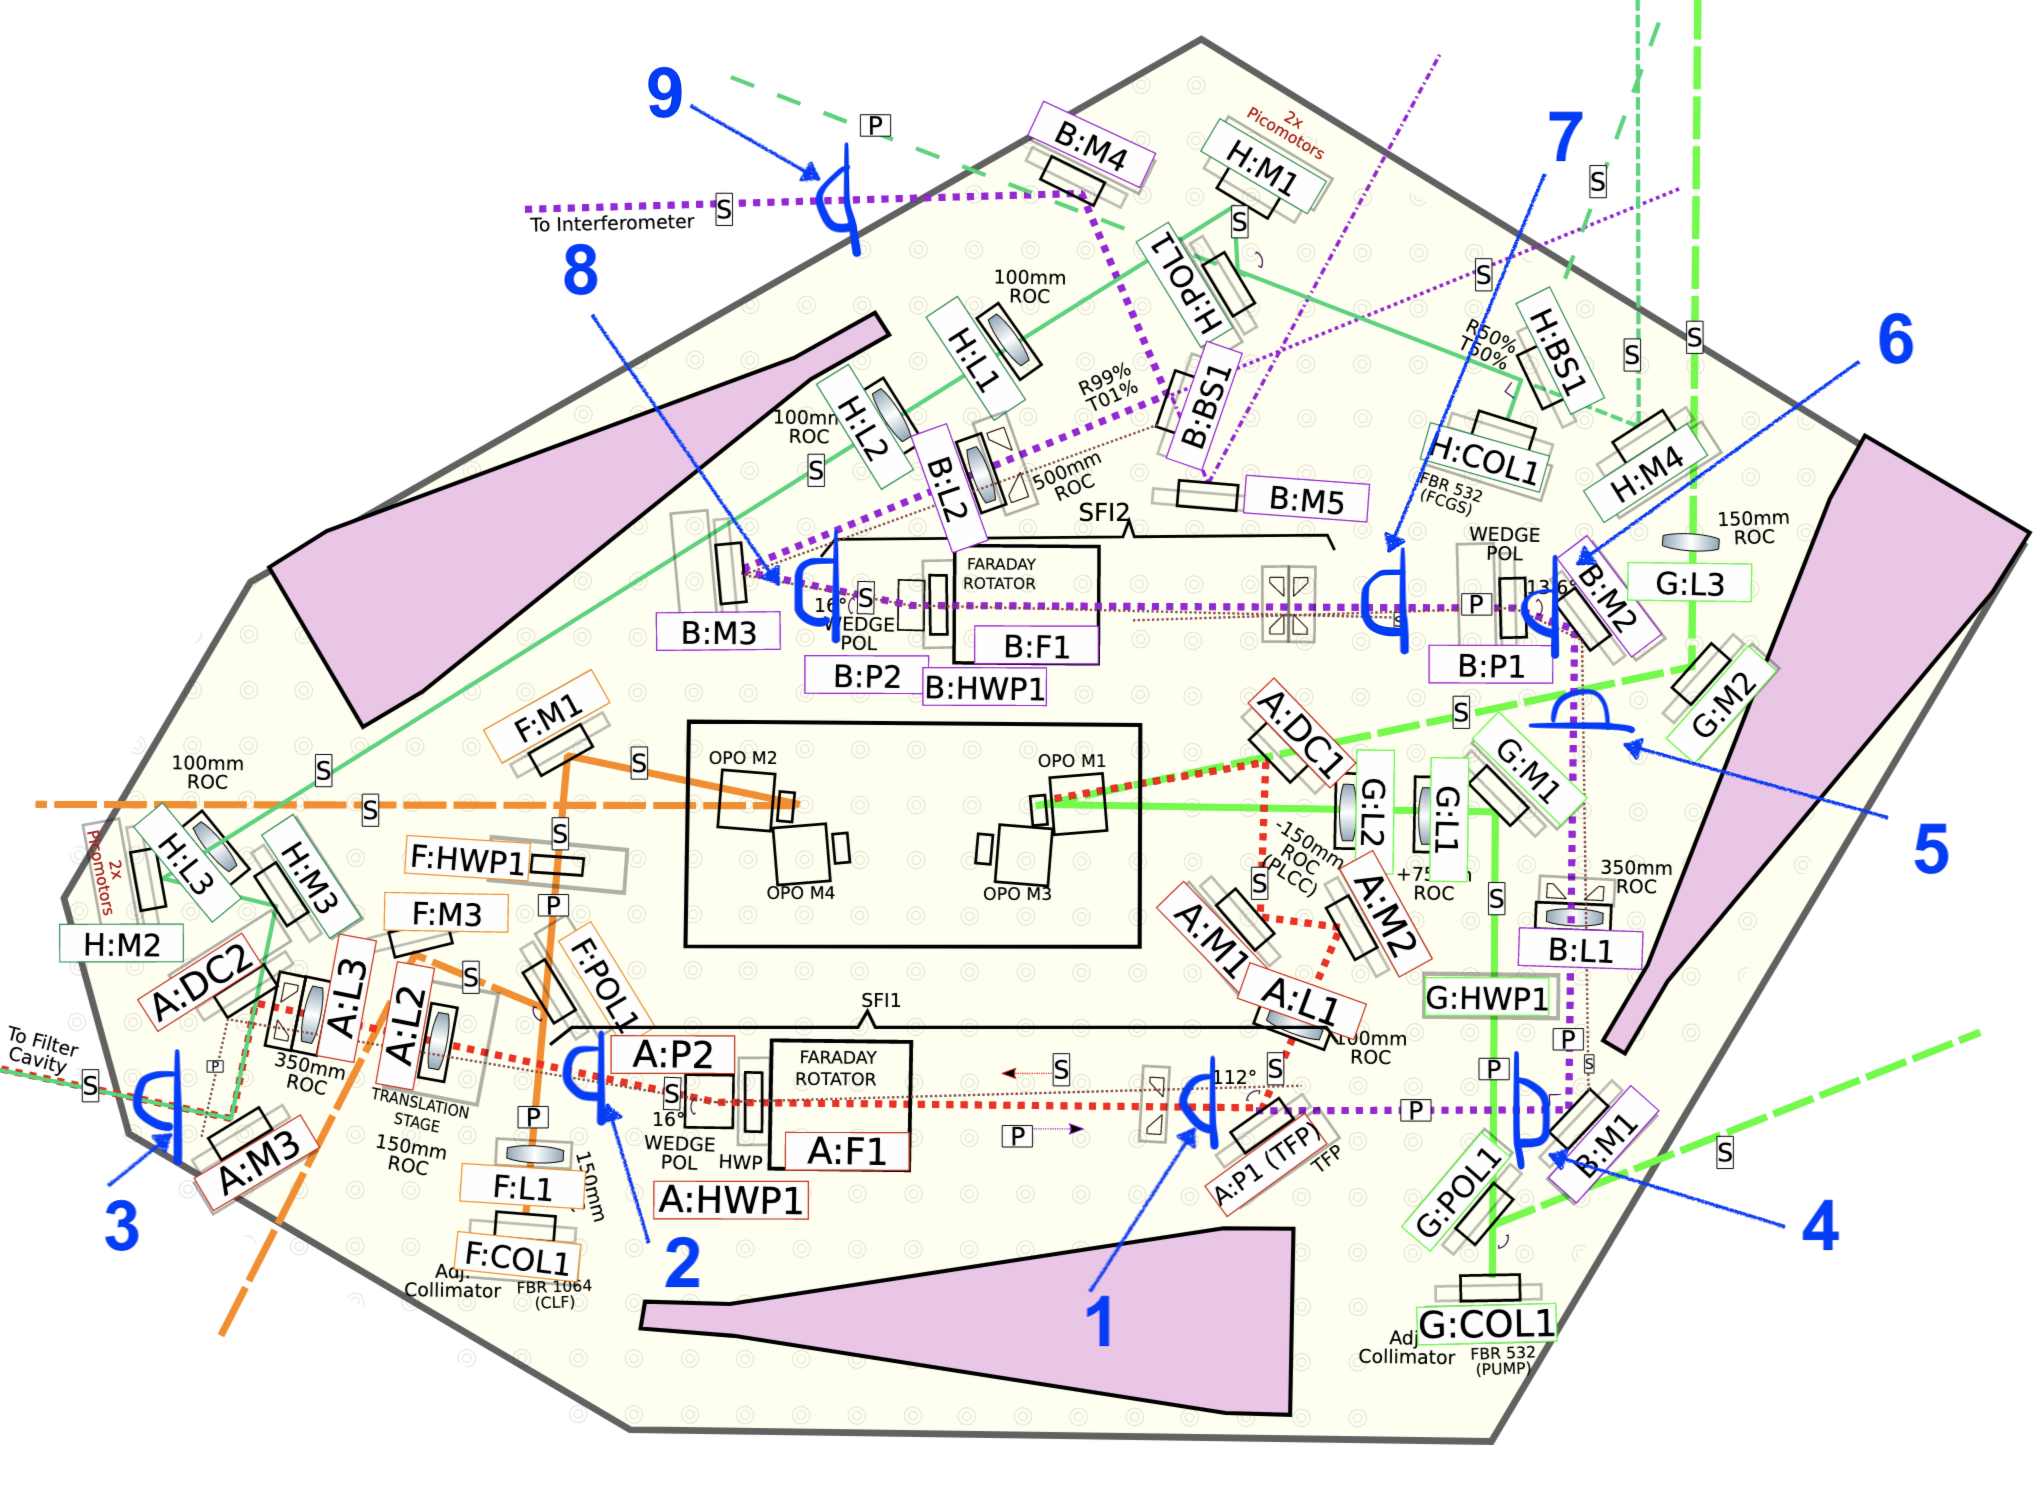
- We locked the OPO on IR and put the power meter at various points along the beam (see attached diagram and table below for positions).
- At each position we measured 3 numbers:
- Power measured by the power meter [uW]
- Analog voltage from the power meter [mV]
- Voltage on the reference DC PD (see layout here) [V]
- For each of these measurements we turned off the room lights
- Before each measurement we blocked the OPO tranmission such that there was no light on the power meter, and zeroed the power meter.
- We scale the power meter (PM) power and voltage by the voltage measured by the reference DCPD to remove laser power fluctuations.
- For the first 6 measurements we were supplied current to SFI1 to get the thermistor to ~10.4kOhms, for meausrements 7+ we swiched to powering the TEC in SFI2.
Results
Power measurements
See the attached layout for power meter positions
SFI1 measurements:
| # | Position | PM [uW] | PM[mV] | ref [V] | Scaled power | Scaled voltage |
| 1 | SFI1 input* | 66.9 | 67.1 | 0.975 | 68.6 | 68.8 |
| 2 | SFI1 output | 64.2 | 65.1 | 0.96 | 66.8 | 67.8 |
| 3 | After A:M3 | 64.9 | 67.5 | 0.955 | 68.0 | 70.7 |
*Actually while writing this log I realised we should have measured upstream of A:P1 to get the true SFI1 input.
Path between SFI1 and SFI2:
| # | Position | PM [uW] | PM[mV] | ref [V] | Scaled power | Scaled voltage |
| 4 | A:P1 to B:M1 | 58.2 | 60 | 1.04 | 56.0 | 57.7 |
| 5 | B:M2 to B:L1 | 58.2 | 61.4 | 1.05 | 55.4 | 58.5 |
| 6 | B:P1 to B:F1 | 58.0 | 59.7 | 1.06 | 54.7 | 56.3 |
SFI2 measurements:
| # | Position | PM [uW] | PM[mV] | ref [V] | Scaled power | Scaled voltage |
| 7 | SFI1 input | 53.8 | 53.9 | 0.961 | 56.0 | 56.1 |
| 8 | B:P1 to B:F1 | 52.8 | 53.7 | 0.948 | 55.7 | 56.6 |
| 9 | SFI2 output | 52.8 | 53.1 | 0.955 | 55.3 | 55.6 |
| 10 | After B:M4 | 52.5 | 53.2 | 0.98 | 53.6 | 54.3 |
Thermistor resistances and required current:
We hooked up a voltmeter to pins 1 and 6 to measure thermistor 1 on the SFIs. We applied a current to the TEC (pin 5 is +, pin 9 is -, see this wiring diagram)
SFI1
11.4kOhm = room temp
110mA to TEC = 10.33 kohm
SFI2
11.2kOhm = room temp
103mA to TEC= 10.27 kOhm
Analysis
- I'm not sure why the power meter power and voltage measurements are different. They're taken a few seconds apart. Perhaps the analog output doesn't take into account the offset we did to remove any background light
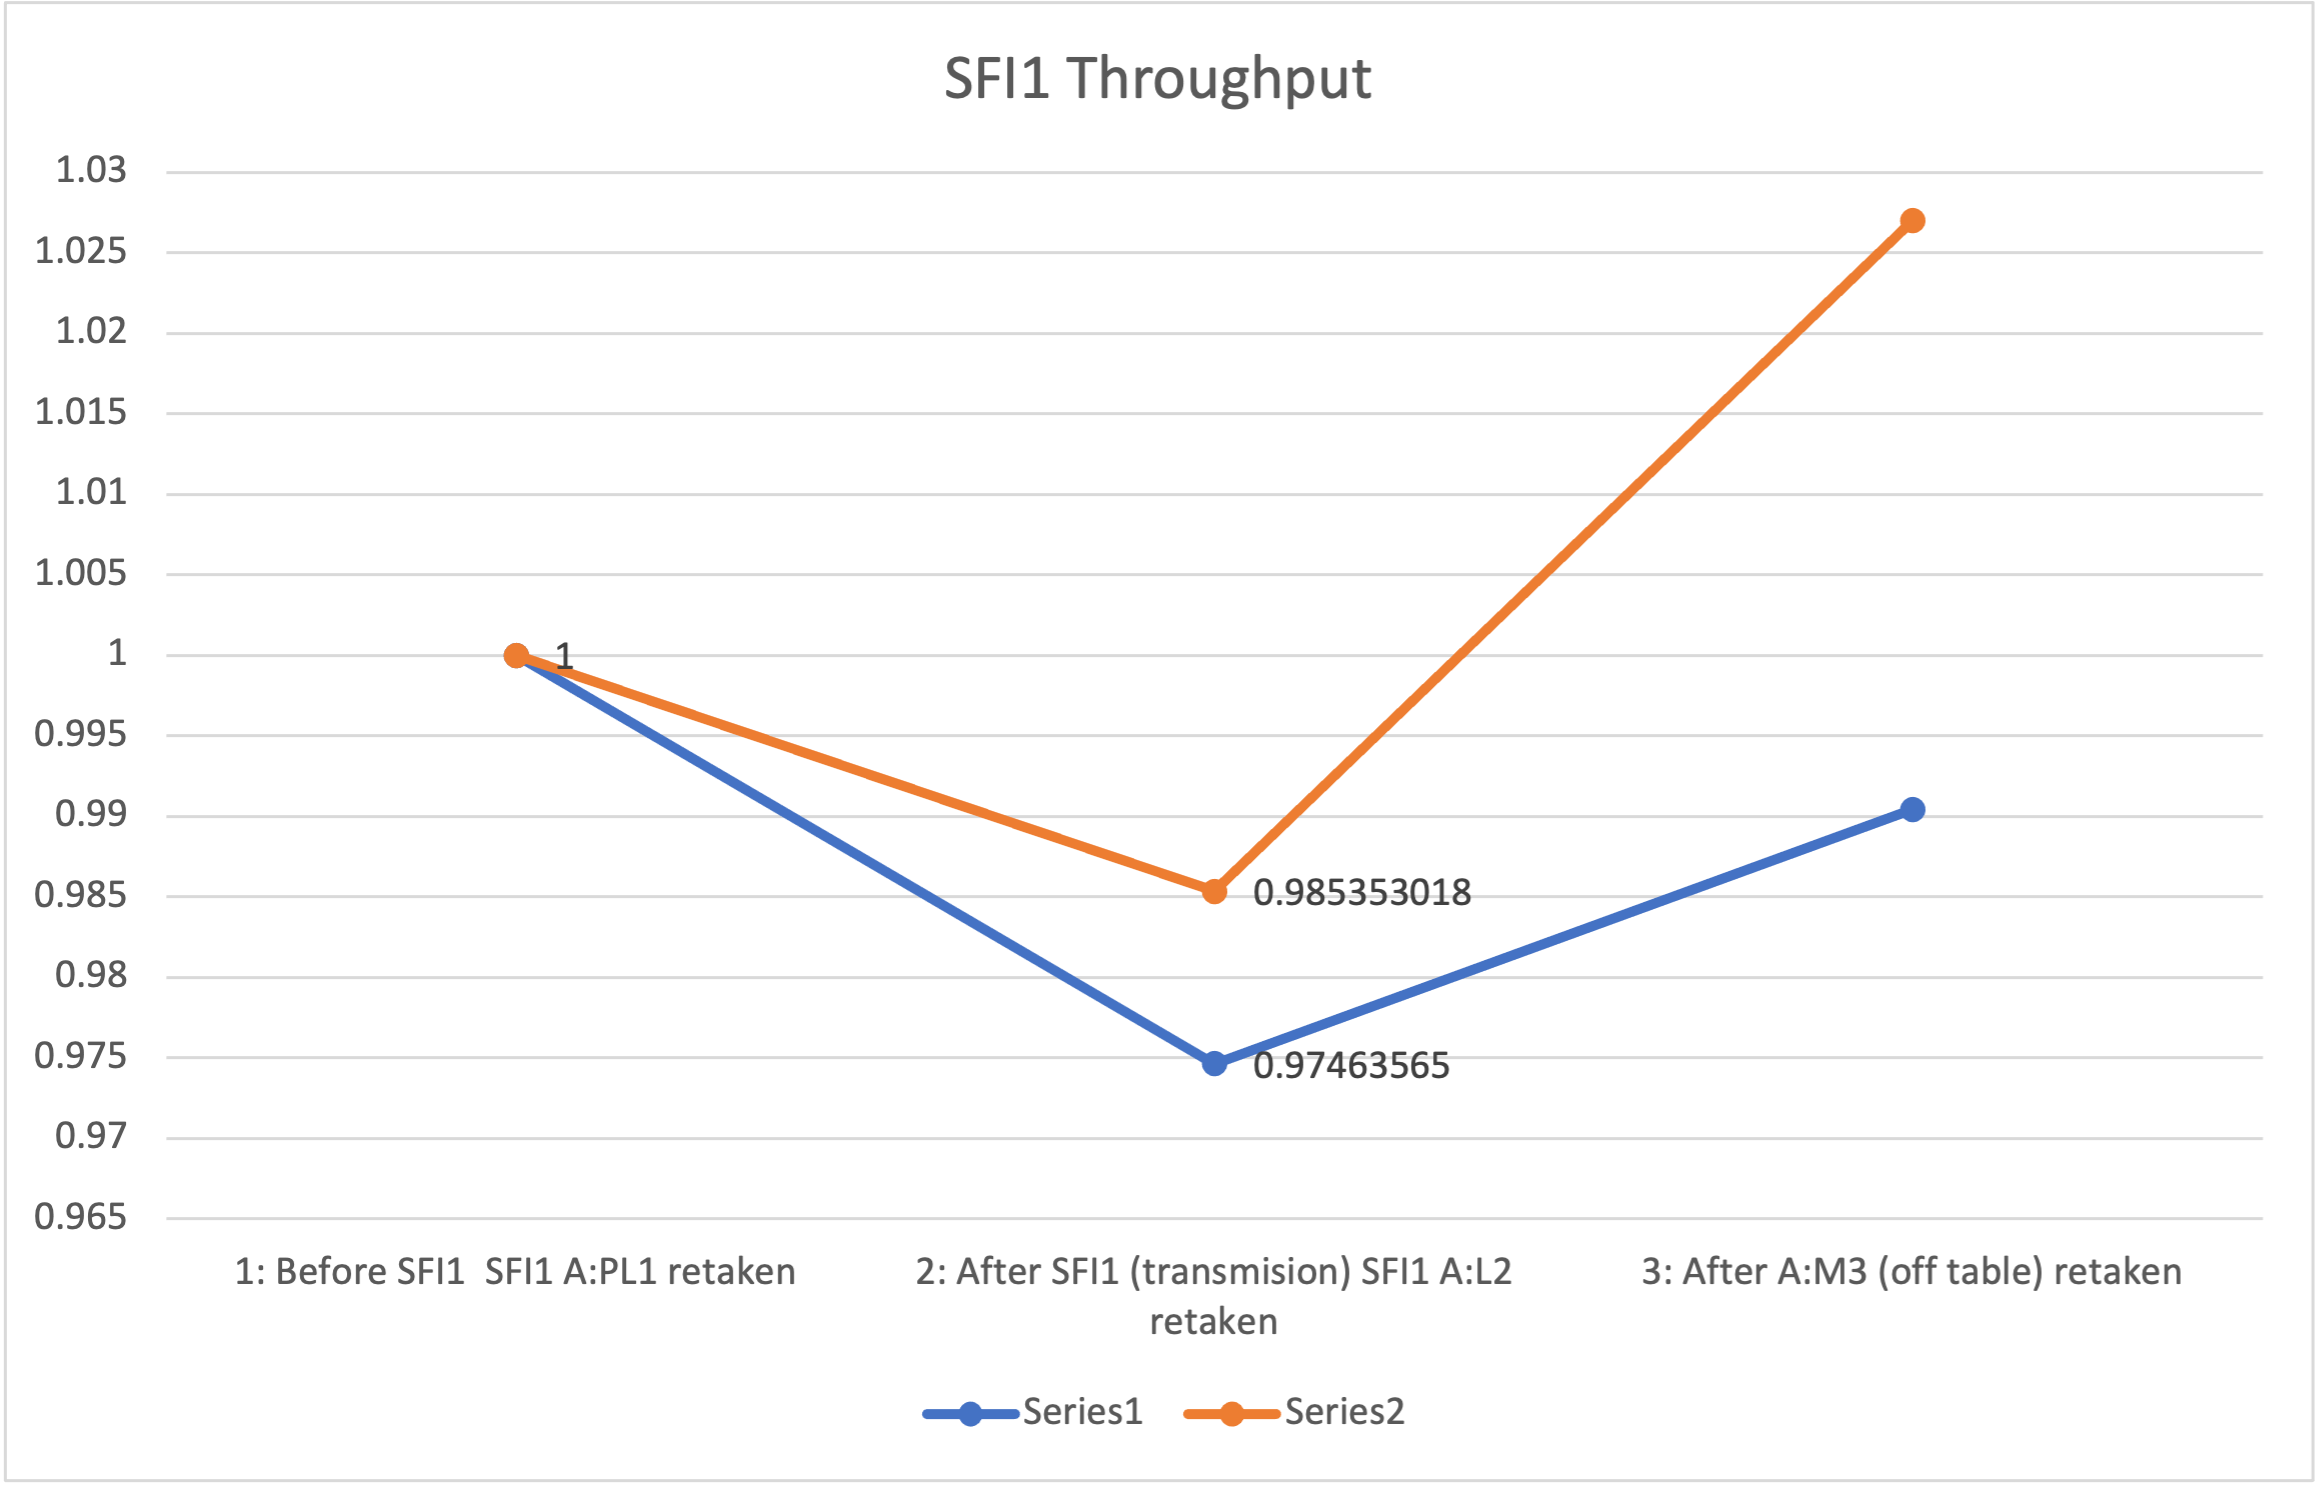
- At first glance we measure ~98% transmission through SFI1 (this was after an earlier measurement where we had ~94% transmisison, but we were less careful about beam centering on the power meter head). We miraculously measure more power downstream of SFI1 (#3), which makes me suspicious that there's something going on with the beam size or something else affecting the measurement.
- We have 97.5% transmisison between SFI1 and SFI2, which seems reasonable, maybe a bit too lossy?
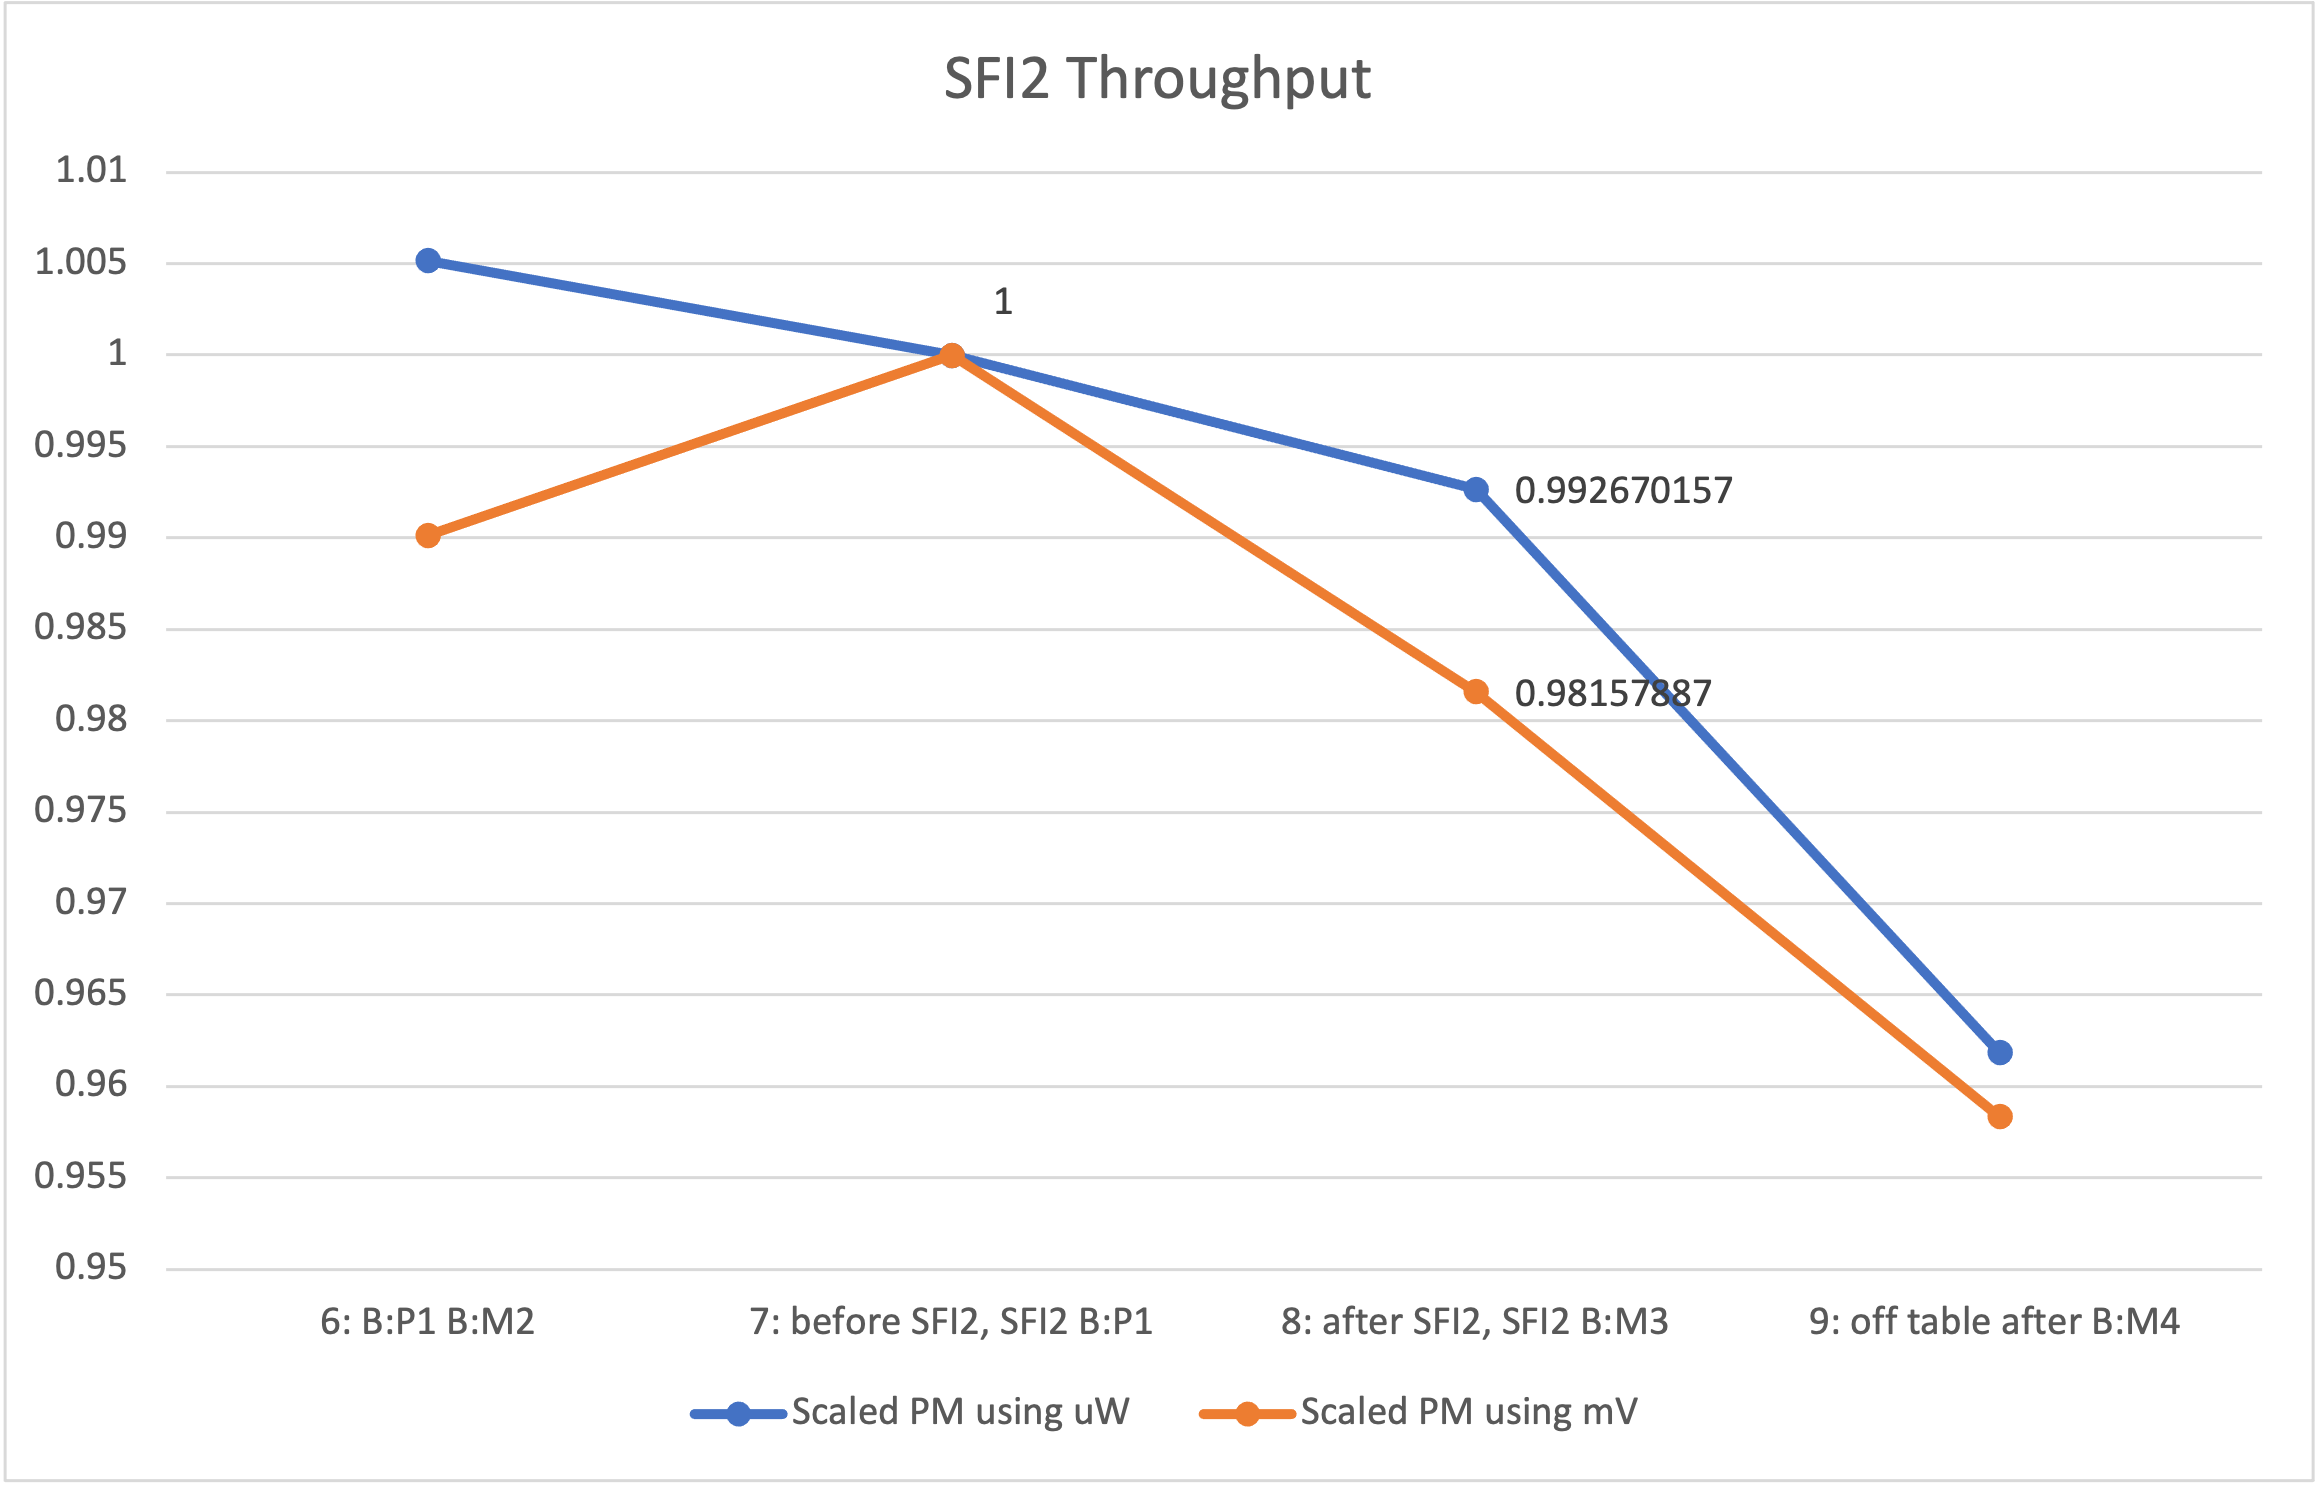
- We measure ~99% transmisison through the full SFI2 (including B:P1), and ~97% tranmission through the path after SFI2. There's a 99/1 beamsplitter on that path so it's not surprising there's a bit of loss.
Attached graphs showing our measurements. As Georgia noted, our SFI1 #3 measurement doesn't make sense and we have a discrepancy between measurements taken with the power meter's displayed power output and the voltage output read via oscilloscope mean value.
Thu. Jul/8/2021 (Camilla, Keita)
Increased the power into the in-air fiber collimator.
15mW into in-air fiber coupler, 8.6mW out of in-vac fiber collimator. Don't worry about low throughput, this is because the coupling from the laser to the in-air fiber is low due to ugly beam shape coming out of the laser. When we lock OPO we get O(200uW) from OPO.
Splitting ratio measurement and monitor PD calibration relative to Ophir power meter
As was reported on Tuesday, we have a BS that is nominally 90:10 before the retroreflector in the FC path, and the transmission is monitored by Thorlabs PDA 36A. We measured the splitting ratio of this BS and also calibrate Thorlabs relative to the power meter we've been using (analog output of Ophir Vega meter with PD sensor w/o automatic background subtraction).
In the 1st attachment, we first inserted the power meter ("PM") sensor in position 2 (between BS and retro mirror) and recorded the analog voltage of the PM output as well as Thorlabs PD ("PD") with OPO locked, then the beam blocked. The settings for the sensors were: 50dB gain for PD, 300uW range for PM.
Then we swapped the position of PM and PD and repeated the measurement. The setting for the sensors were 30dB for PD (a factor of 10 smaller), 30uW range for PM (a factor of 10 larger).
Assuming that "a factor of 10" could be trusted, we can derive the splitting ratio of BS as well as the ratio of PM and PD sensitivity. Raw numbers are in the attached script.
We couldn't see the AR reflection at all and assumed that we're measuring both the main beam and the first AR reflection, i.e. effective reflectivity R0=R1+R2*T1^2 and effective transmissivity T0=T1T2(1+R1R2) where Ri and Ti are the reflectivity and the transmissivity of the i-th surface of BS.
We obtained T0/R0=0.1101.
Assuming no true loss on BS (i.e. T0+R0=1) we obtain R0=0.9008 and T0=0.0992.
We don't have a measurement of R2 (AR reflectivity) but we know T1^2~T0^2~1E-2, therefore R1=R0-R2*T1^2~R0-0.01*R2. Assuming that R2 (AR reflectivity) is smaller than 1%, it's safe to use R0 as a good approximation of R1 with up to 0.01% error.
PM/PD sensitivity ratio (with 50dB gain for PD and 300uW range for PM) is 0.0236. This means that PM analog output is 2.36% of the PD output if both receive the same optical power.
Note that this doesn't mean that these numbers are accurate, though they are precise. The biggest source of systematic here is the position and angle dependence of the PM sensor.
Throughput of the SFI1 for the retro reflected beam (preliminary and somewhat suspect)
We measured the power of the retroreflected beam between TFP and B:M1 using PM (680mW bright, -154uV dark, both in 300uW range). BS transmission monitor PD measured 3.77V bright, 50.1mV dark, both with 50dB gain.
Combined with the splitting ratio of BS and sensitivity ratio of PM/PD, these numbers give the SFI1 throughput of the retro-reflected beam to be 94.8%. We'll check things.

A note about Ophir PD300-3W power meter head w/o filter
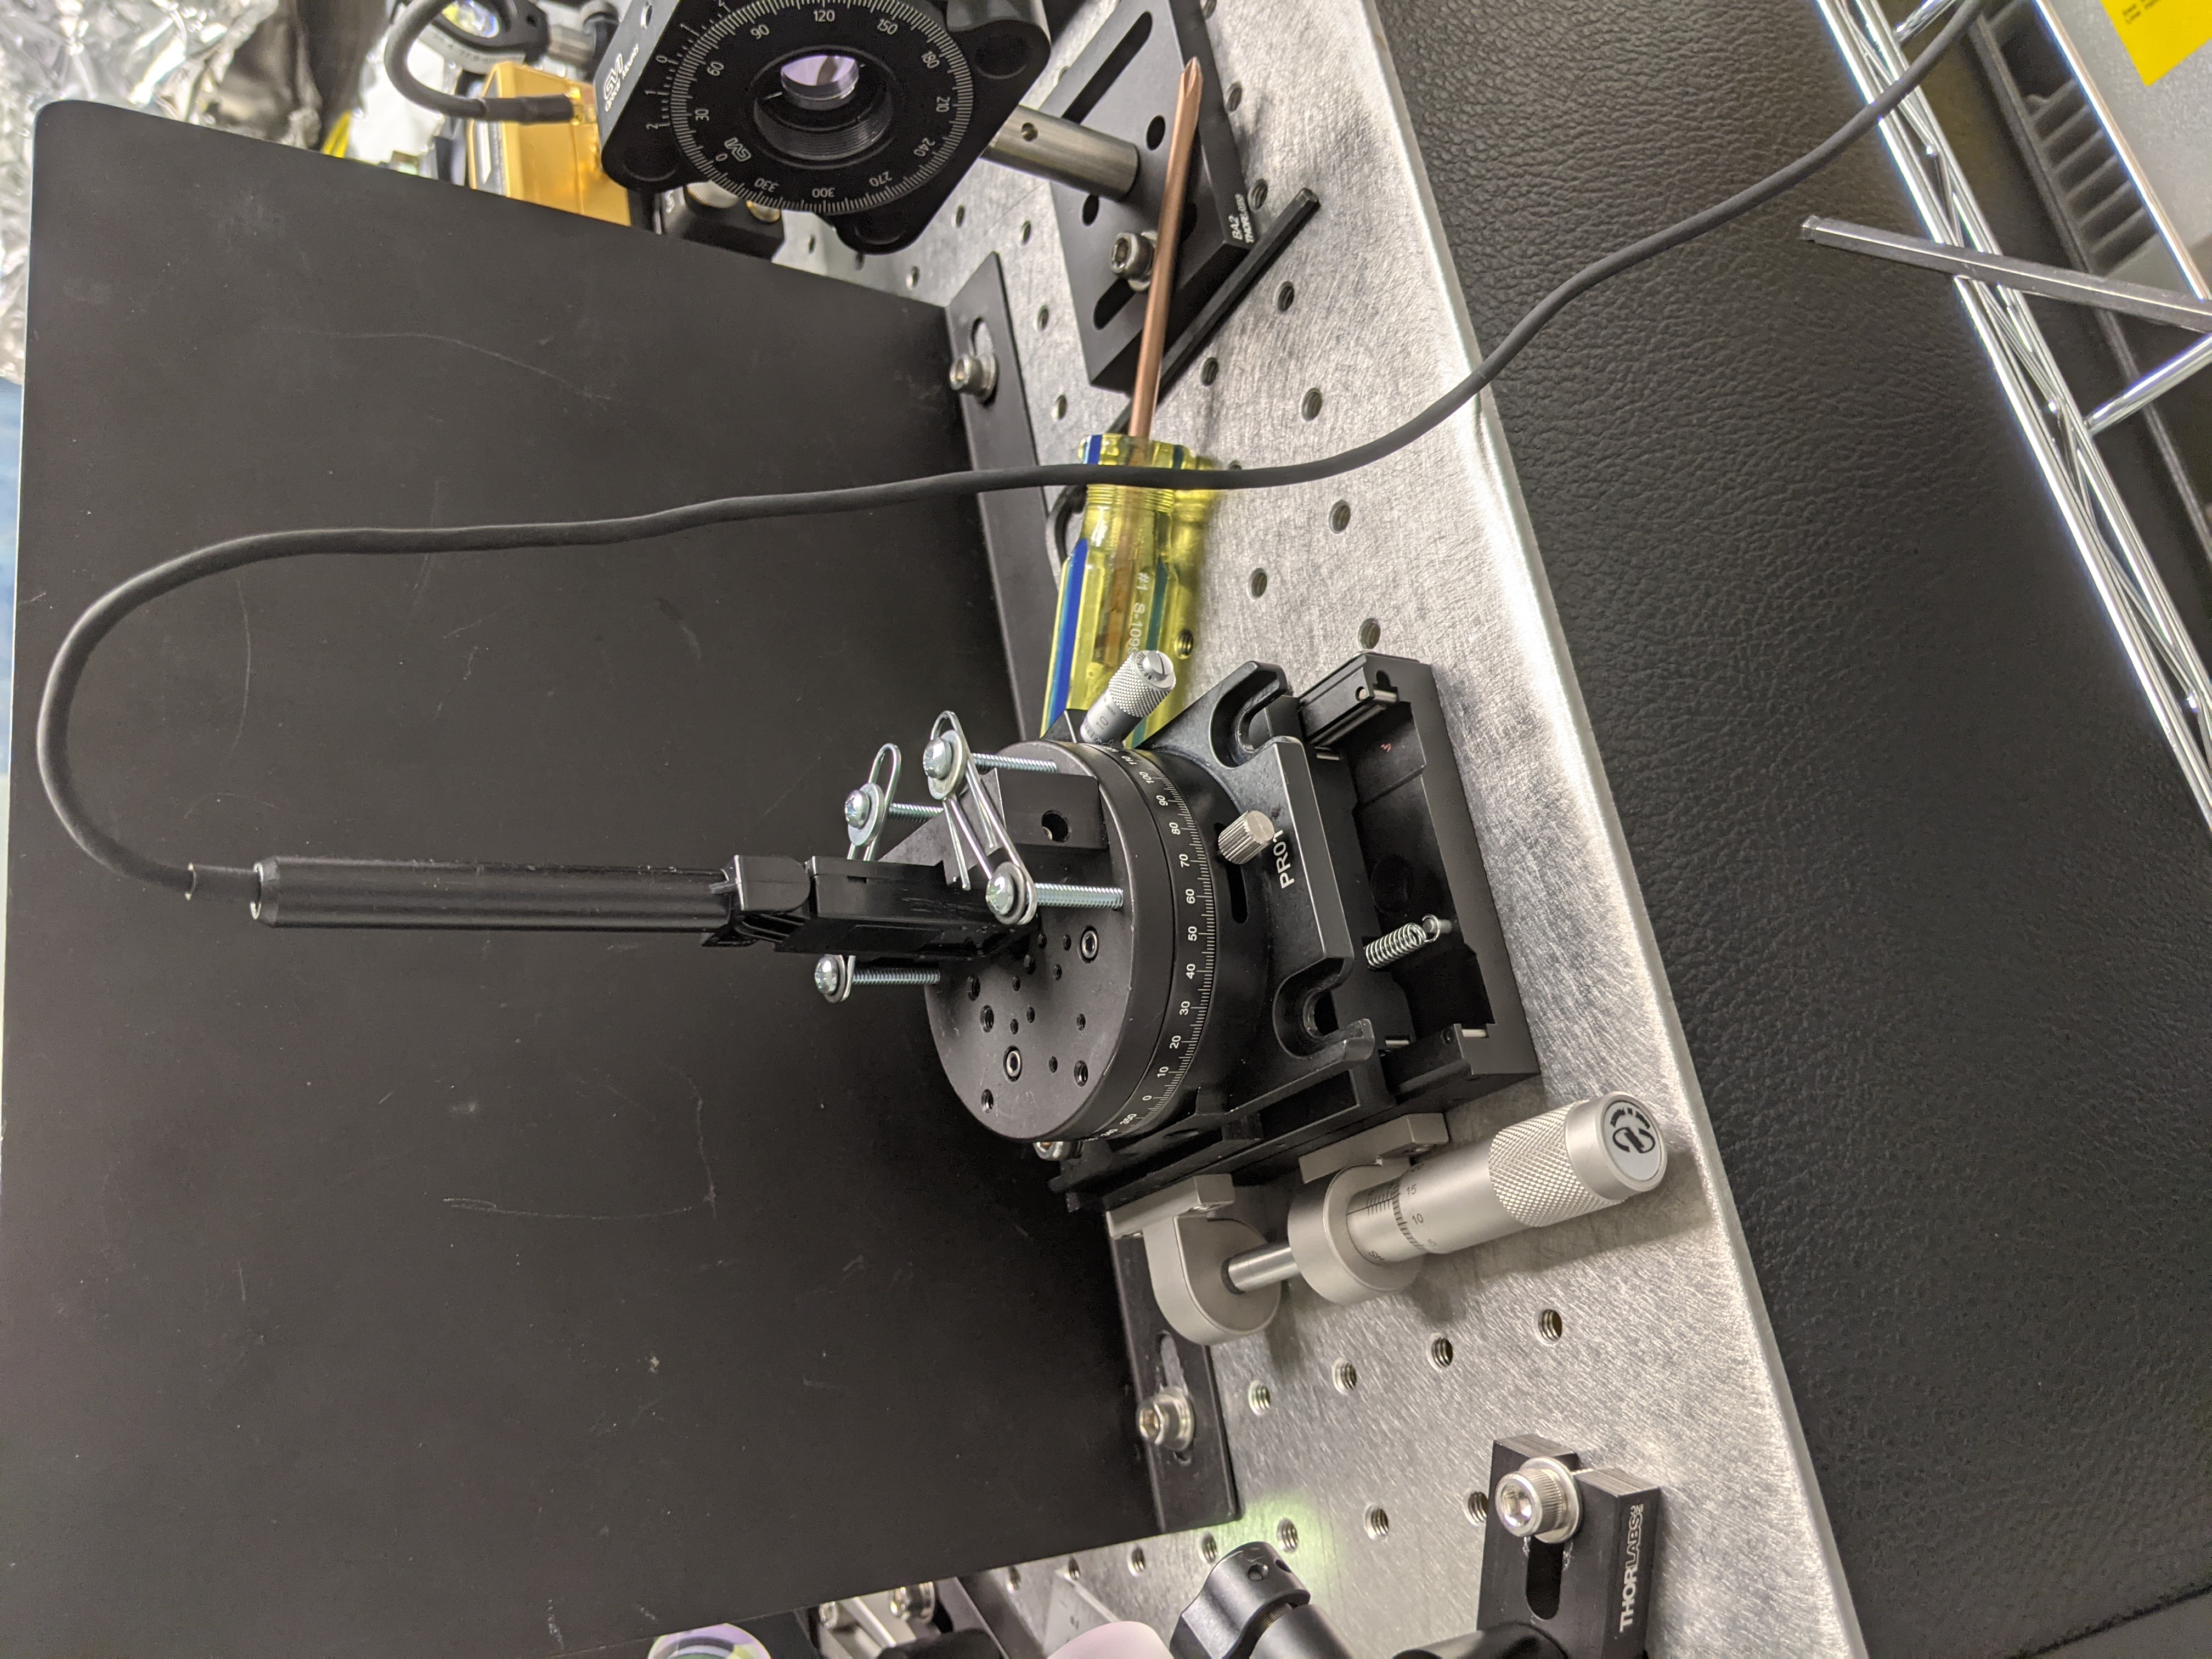
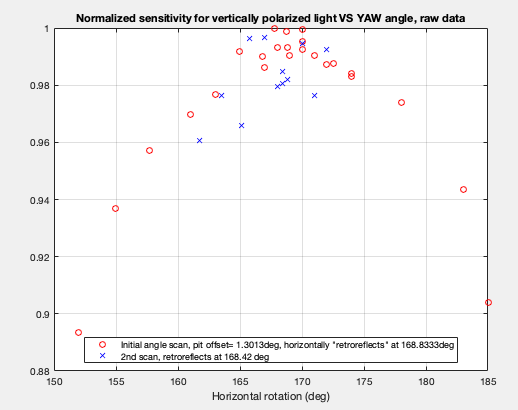
Since I didn't have any knowledge of the angle dependence of Ophir PD300-3W sensor, I made yet another contraption (attachment 1) to scan the angle of the sensor while keeping the spot position at the center as good as I could. I read the power off of Ophir Vega meter, and each time I made myself lower than the table plane at the same location to minimize the effect of scattering of ambient light off of my white lab frock. I didn't use a reference sensor to monitor laser power, but I made sure that at least one data point close to the start of the scan is measured again close to the end to give me some quantitative idea about the laser power drift. Input power was adjusted to be about 2.4mW, the meter range was 3mW. Dark offset when the beam was blocked was about ~2uW throughout the measurements so I didn't bother to take it into account.
The polarization of the light was vertical.
I made two scans, and the first scan was accidentally with a PIT offset of ~1.3deg in the sensor angle (~5mm offset in the reflected beam spot over 110mm distance).
Before the second scan I manually set the PIT angle of the sensor so that the beam retroreflects (using a sensor card with a punched hole), and was surprised to see that the power reading dropped by almost 2%. This seems to be real.
The normalized data (raw data divided by max(scan1, scan2)) for both of the scans are shown in the first attachment. Conservative systematic error due to laser power drift during these was within +-0.4% (see three data points at X=170, two at X=168.833, and two at X=174).
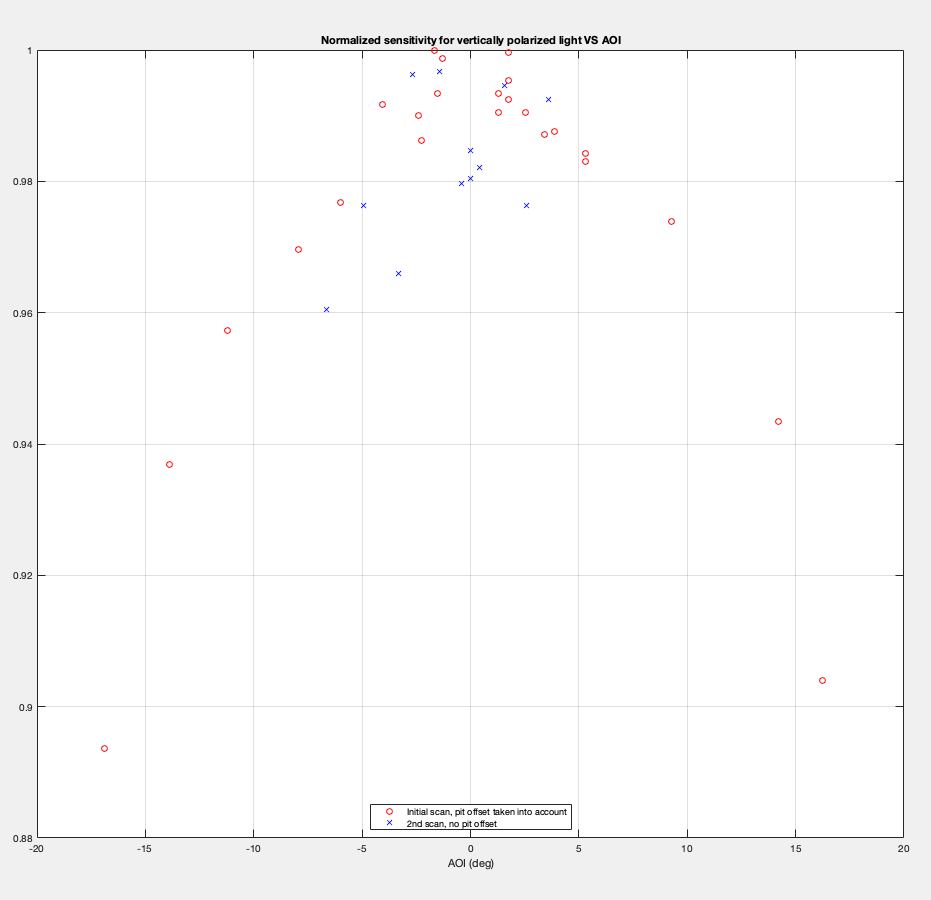
Since the actual AOI for the first scan is always larger than or equal to the pit offset (1.3 deg), I roughly calculated AOI by sqrt(1.3^2+(X-168.833)^2) and replotted the data together with the 2nd scan (3rd attachment).
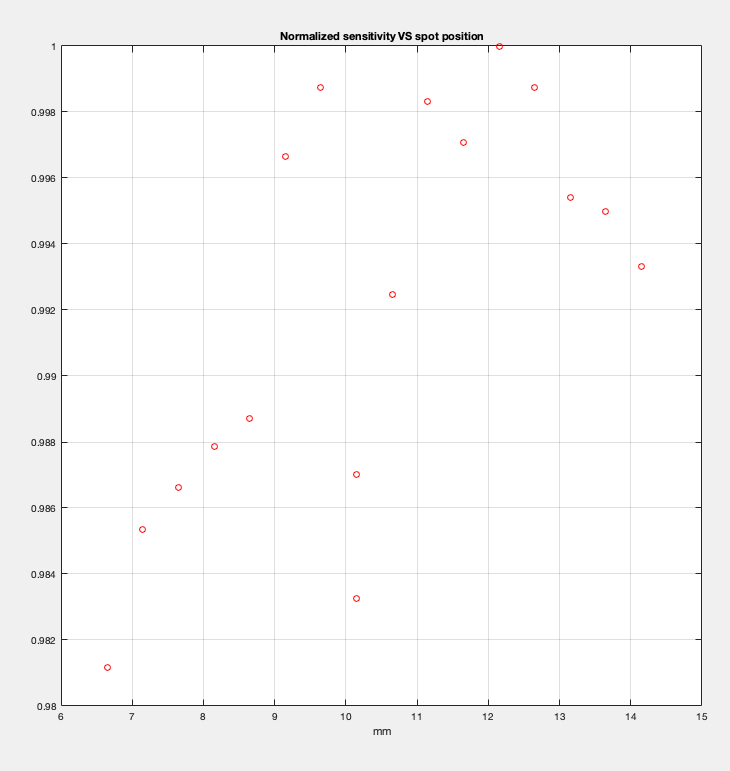
The 4th attachment is a similar measurement with beam position. I simply scanned the sensor horizontally while the angle of the head was kept so that it retro-reflects. This shows that the manufacturer's spec of 2% for the beam position dependence is correct, though I don't like how rapidly the sensitivity changes.
Anyway, based on these, I recommend that you center the beam spot as good as you can, then adjust the angle to maximize the output. Systematic due to beam position and angle would be <~+-1% that way.
Note that I'm not talking about absolute power calibration.
Also note that this could be different for horizontal polarization.
For posterity, attached script contains the data used for the IFO path mode matching measurement. Numbers in the table below are based on D4S diameter measurements though 13.5% diameters are available in the script too.
| Horizontal | Vertical | Target | |
| Waist Radius [um] | 708 | 694 | 661 |
| WaistRad (meas-target)/target | 0.070 | 0.050 | |
|
Waist Position [mm from B:M4] (negative means closer to OPO) |
-223 | -211 | -284 |
| WaistPos measured-target [mm] | 60.6 | 72.4 | |
| Rayleigh range [mm] | 1479 | 1422 | 1291 |
| WaistPos(measured-target)/2/Rayleigh(target) | 0.024 | 0.028 | |
| Matching [%] | 99.5 | 99.7 |