hugo.paris@LIGO.ORG - posted 17:52, Friday 12 April 2013 (6068)
HAM3-ISI - TF Running
Transfer Functions are running over the weekend on HAM3-ISI.
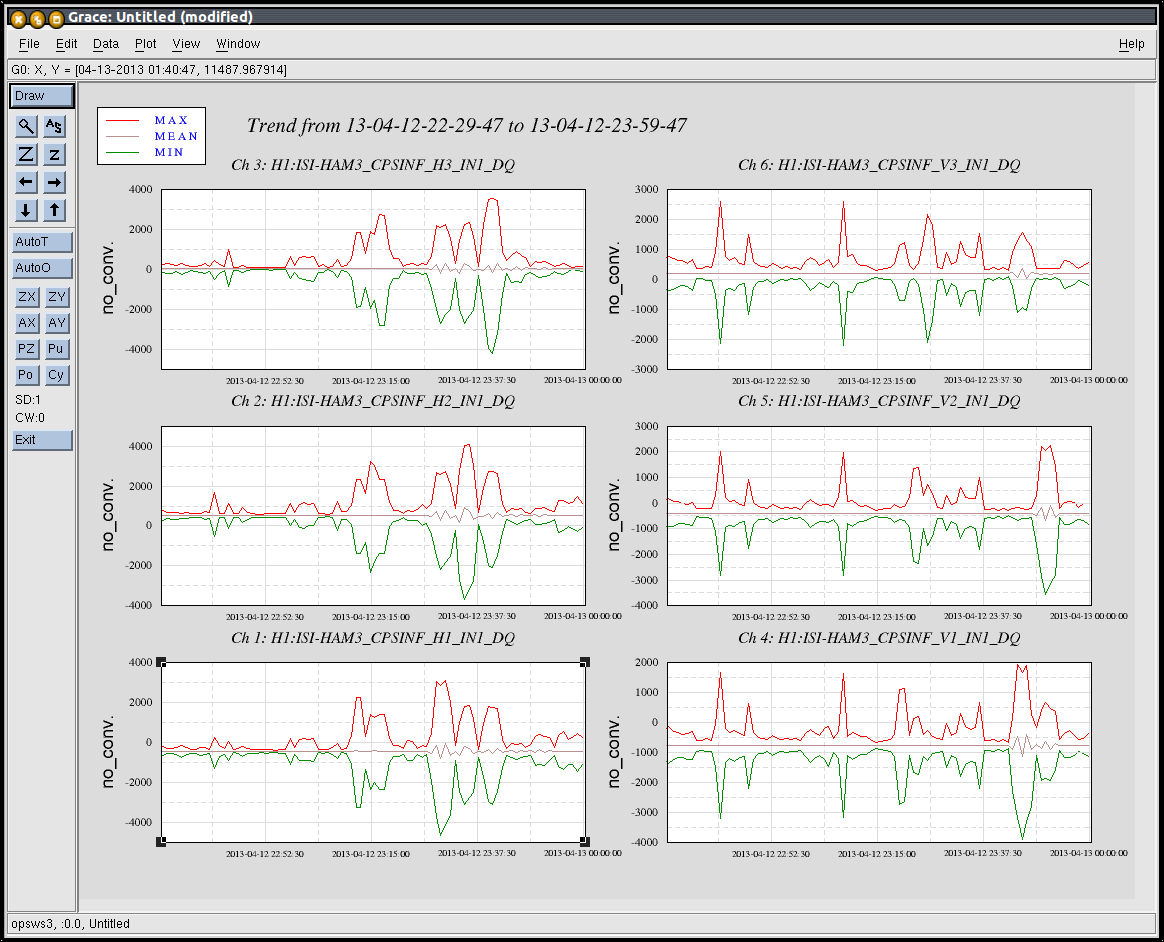
The HAM-ISI master models were recently updated. We took a quick set of transfer functions (1 average) to make sure everything was OK. Time series for the CPS signals are attached.
Images attached to this report