thomas.shaffer@LIGO.ORG - posted 16:30, Tuesday 23 November 2021 - last comment - 13:51, Wednesday 24 November 2021(60746)
SR2 Health Checks
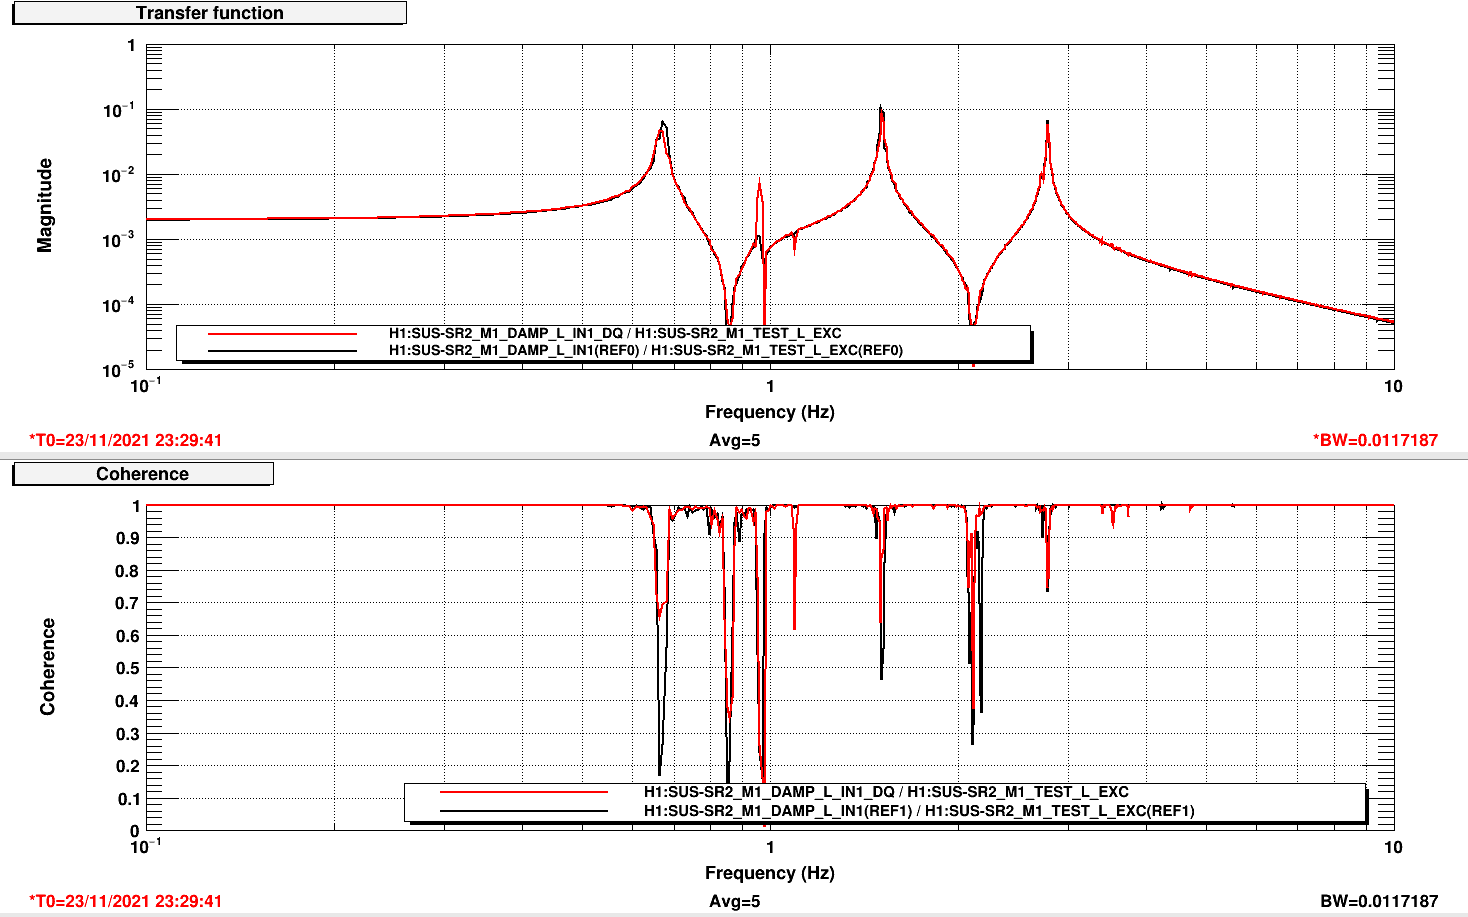
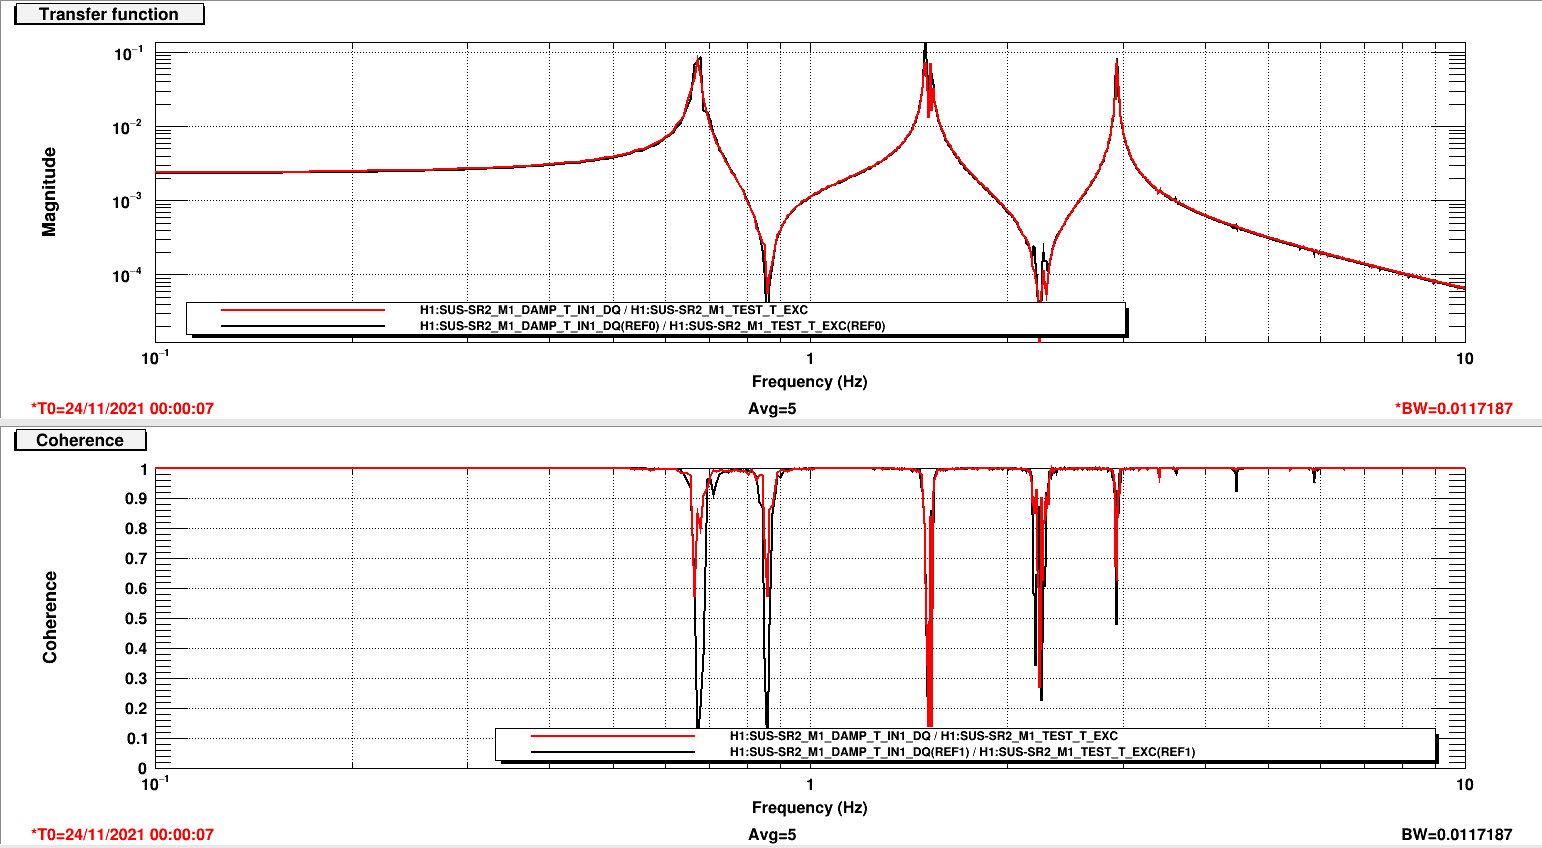
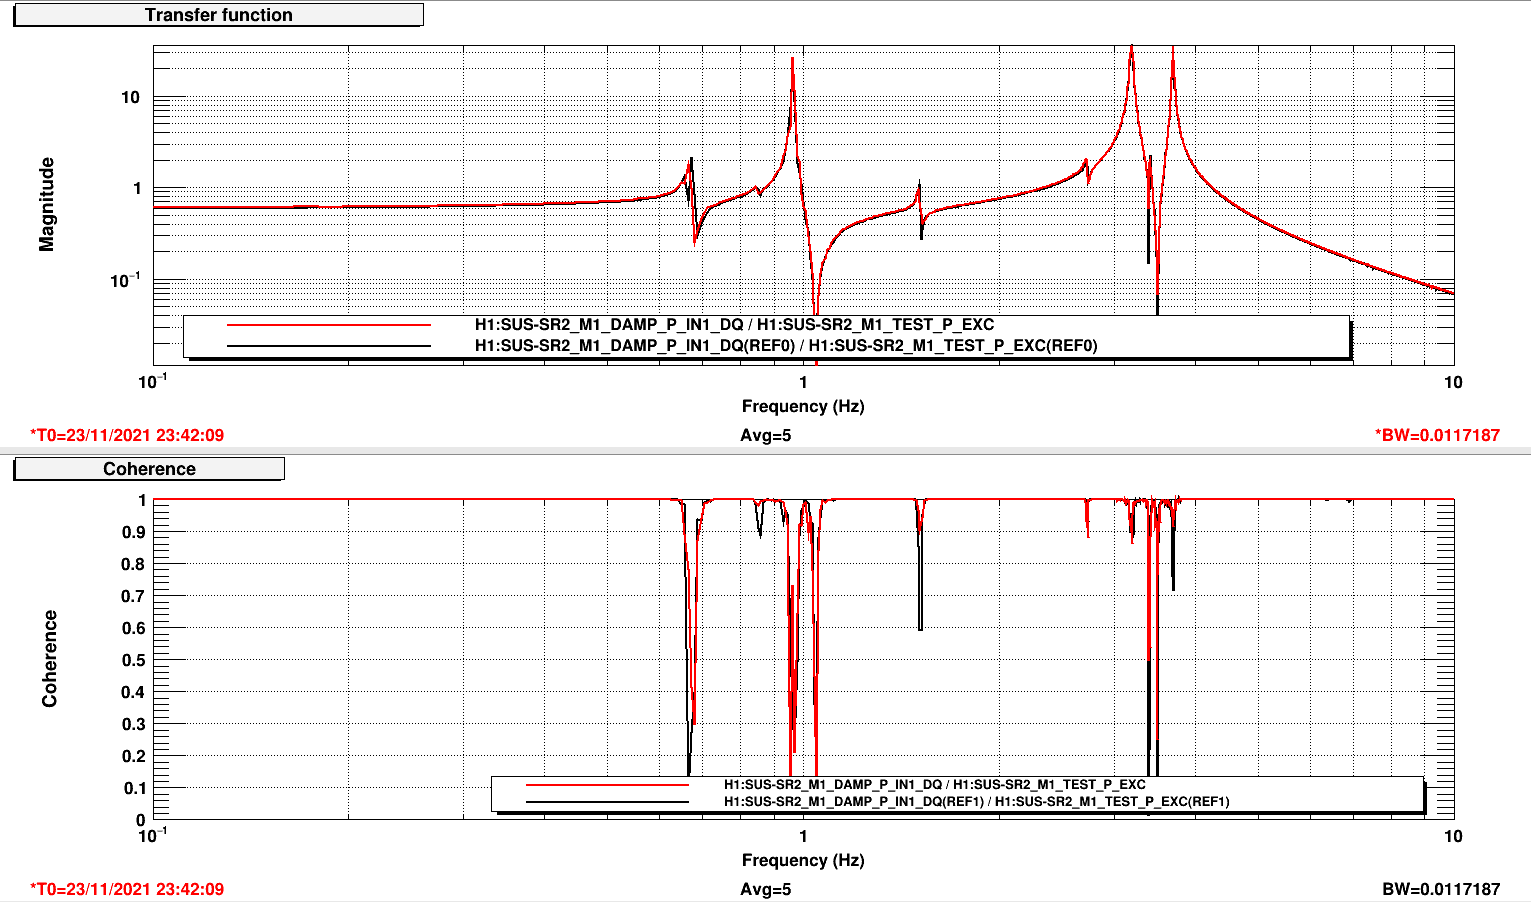
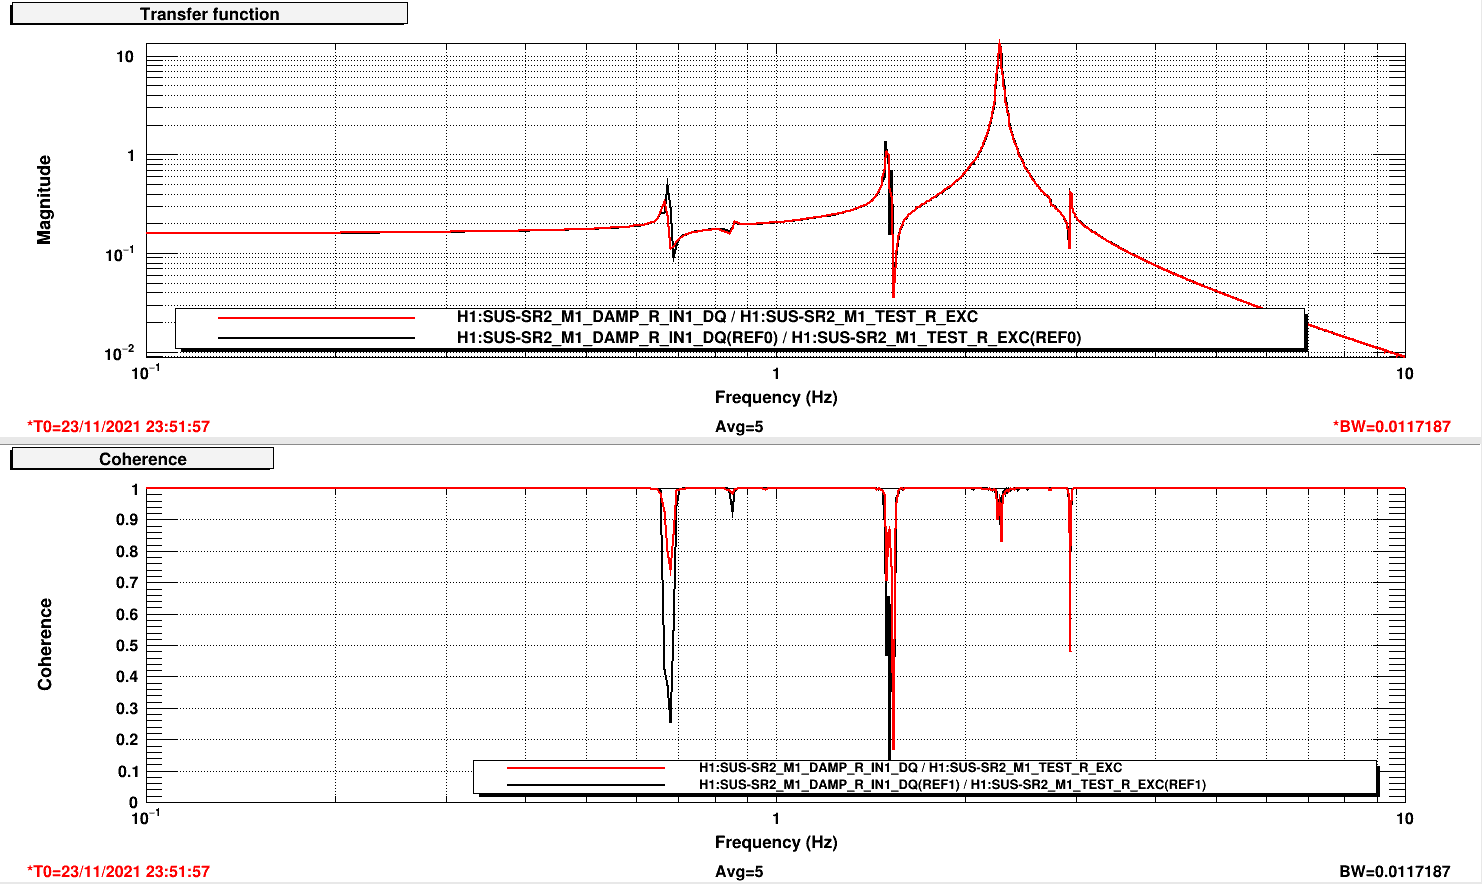
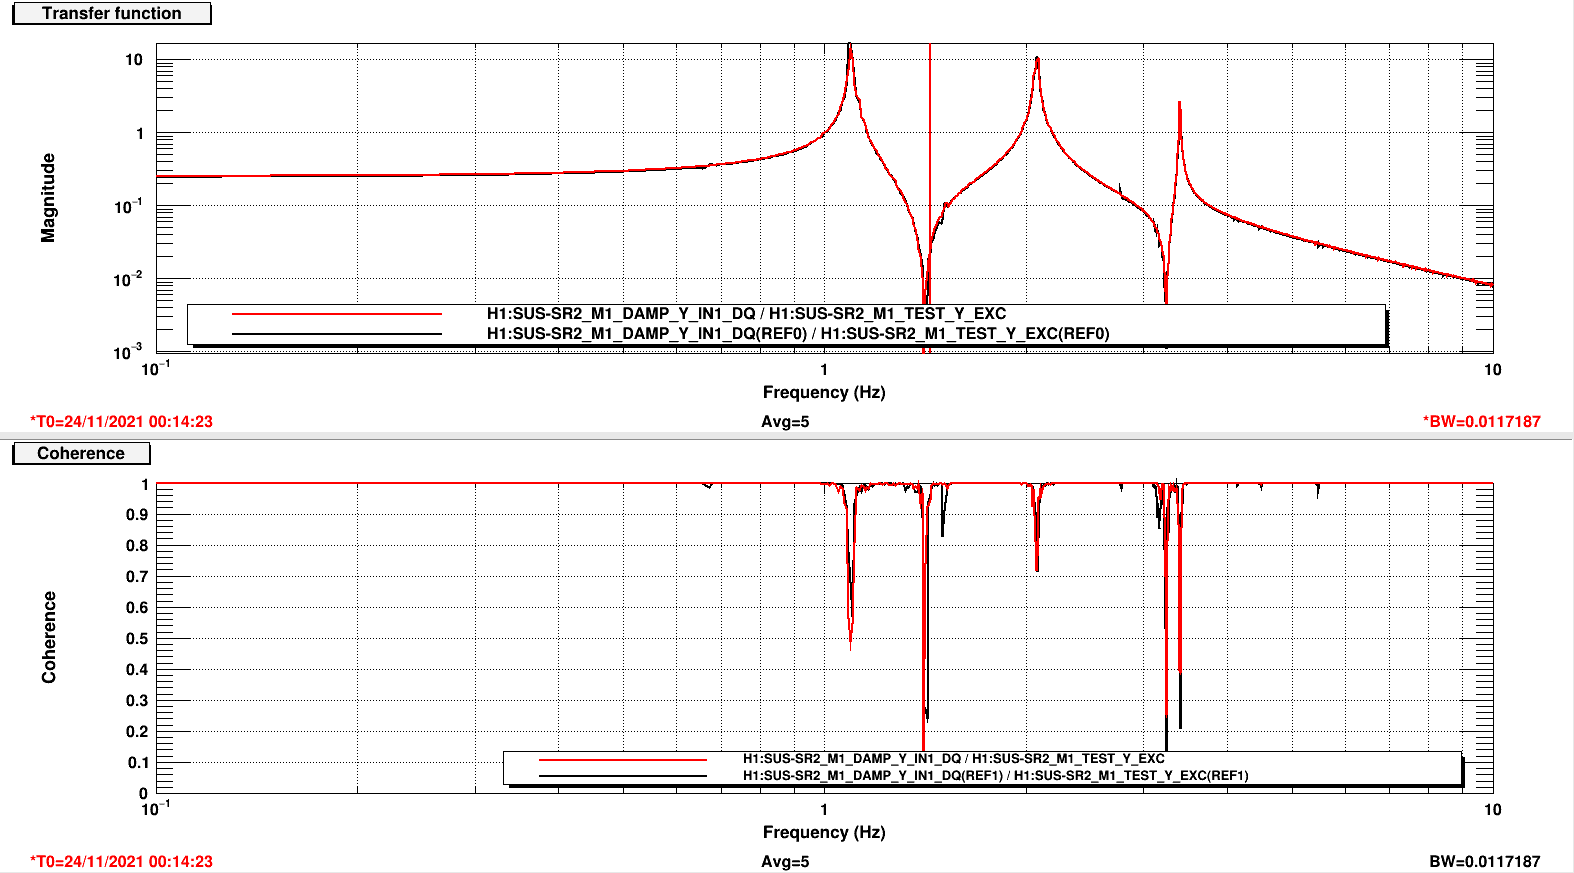
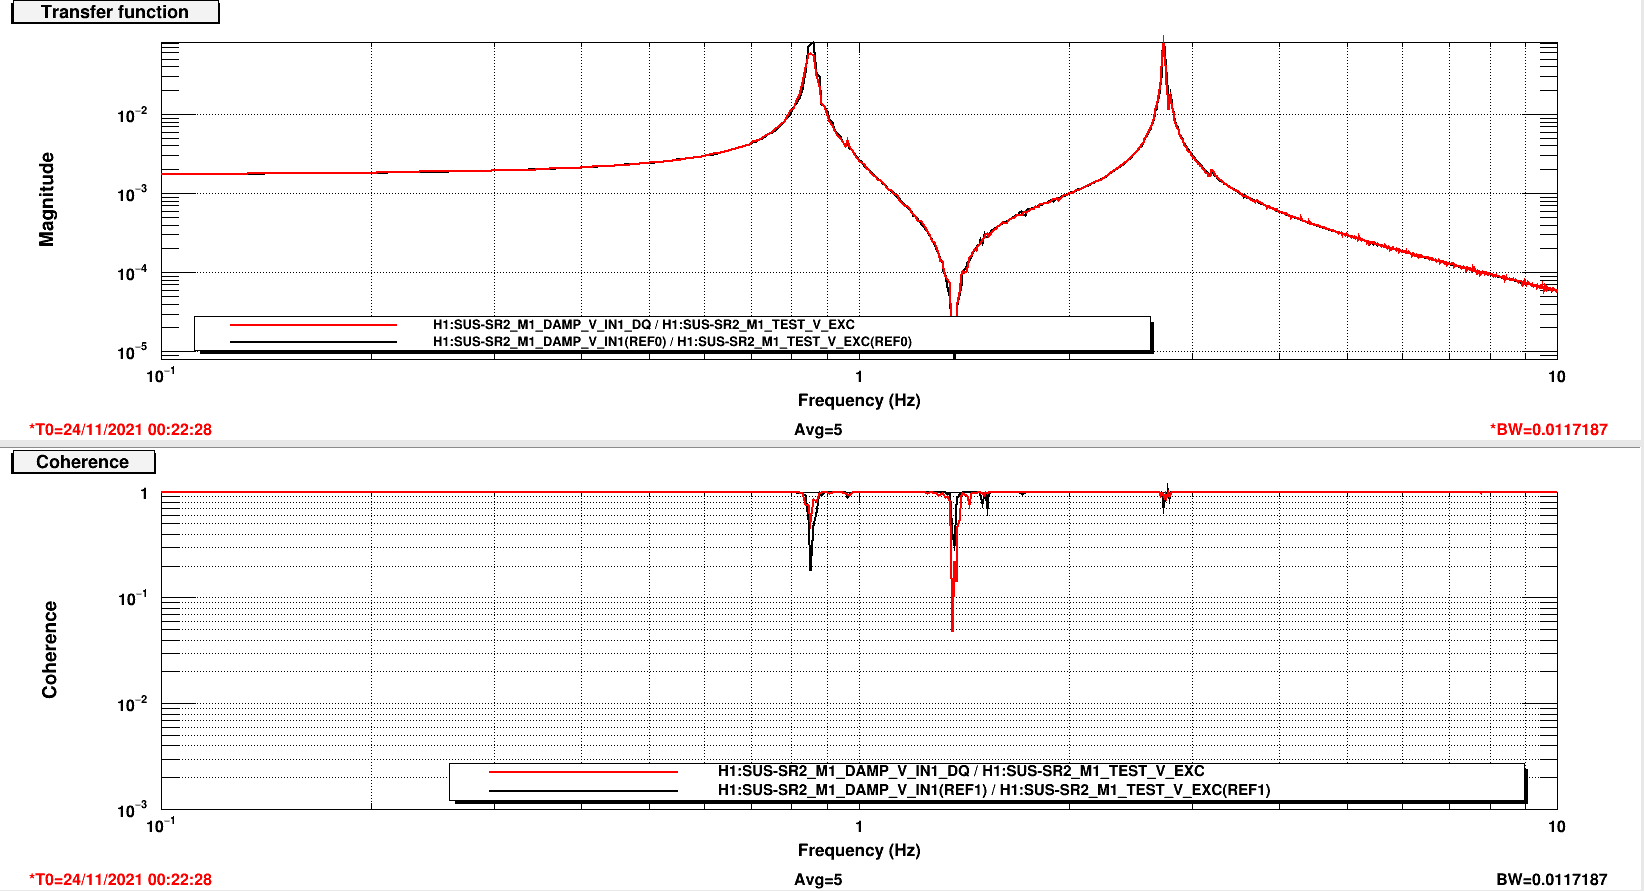
Austin, Camilla, and myself ran through the 6 degrees of freedom with a finer bin width (0.03 -> 0.01) than Betsy and Austin did on the 18th. I didn't have the time to export the data and put them through our matlab scripts, but I'll get to that next week. It might be possible to drive a bit harder than with the amplitudes that were already in the templates, but it gave good results so I didn't mess with them.
The L dof had one peak at 0.96Hz that I didn't see in past measurements. Other than that, they all looked good to me. I'll need an expert to take a look at the odd peak in length at some point, as I'm not sure what might cause it or what checks to do next.
Images attached to this report
Comments related to this report
J. Kissel, for the Above Team

Comparing these results against previous, and other suspensions of the like, the "extra" peak in the L to L transfer functions at 0.96 Hz is merely the expected pitch mode. Since this measurement is in air, it's likely that the SUS was "just" moving more than usual, which manifests as that pitch mode having a higher Q than the 2017 measurement that TJ's comparing against. This cross-coupling is not unexpected; see the model also has a resonance at "this" frequency, and all SUS of this type have the first pitch resonance measured to be at ~0.96 Hz rather than the modeled 1.005 Hz). Indeed, this resonance will be happily damped by the pitch damping loop and the cross-coupling will disappear, and it'll all be wonderful.

I say SR2 looks all good.

I've exported the results from these templates to
    ^/trunk/HSTS/H1/SR2/SAGM1/Data/
        2021-11-23_1530_H1SUSSR2_M1_WhiteNoise_L_0p01to50Hz_tf.txt
        2021-11-23_1530_H1SUSSR2_M1_WhiteNoise_P_0p01to50Hz_tf.txt
        2021-11-23_1530_H1SUSSR2_M1_WhiteNoise_R_0p01to50Hz_tf.txt
        2021-11-23_1530_H1SUSSR2_M1_WhiteNoise_T_0p01to50Hz_tf.txt
        2021-11-23_1530_H1SUSSR2_M1_WhiteNoise_V_0p01to50Hz_tf.txt
        2021-11-23_1530_H1SUSSR2_M1_WhiteNoise_Y_0p01to50Hz_tf.txt

then processed these transfer functions with,
    ^/trunk/HSTS/Common/MatlabTools/plotHSTS_dtttfs_M1.m

which produced the first attached plot set
    ^/trunk/HSTS/H1/SR2/SAGM1/Results/2021-11-23_1530_H1SUSSR2_M1_ALL_TFs.pdf

and data formatted for comparison with others,
    ^/trunk/HSTS/H1/SR2/SAGM1/Results/2021-11-23_1530_H1SUSSR2_M1.mat

and added them to the list of measurements in our comparison script,
    ^/trunk/HSTS/Common/MatlabTools/plotallhsts_tfs_M1.m

to produce the second and third set of attached plots which live in
    ^/trunk/HSTS/Common/Data/
        allhstss_2021-11-23_1530_H1SUSSR2_Phase3a_UnDamped_M1_ALL_TFs.pdf
        allhstss_2021-11-23_1530_H1SUSSR2_Phase3a_UnDamped_M1_ALL_ZOOMED_TFs.pdf
All of the above have been committed to the SusSVN repository at the above location, where "^/trunk/[etc...]" = "/ligo/svncommon/SusSVN/sus/trunk/[etc...]"
Non-image files attached to this comment
