Maybe this isn't the best place to share this, but life can be frustrating as a deuteranope. Matplotlib has an easy to use colorblind friendly style built in. It can be invoked by adding the line plt.style.use('tableau-colorblind10') before starting to setup your plot (if you've used the usual import matplotlib.pyplot as plt). Maybe this is common knowledge, but I just found it while working on a script.
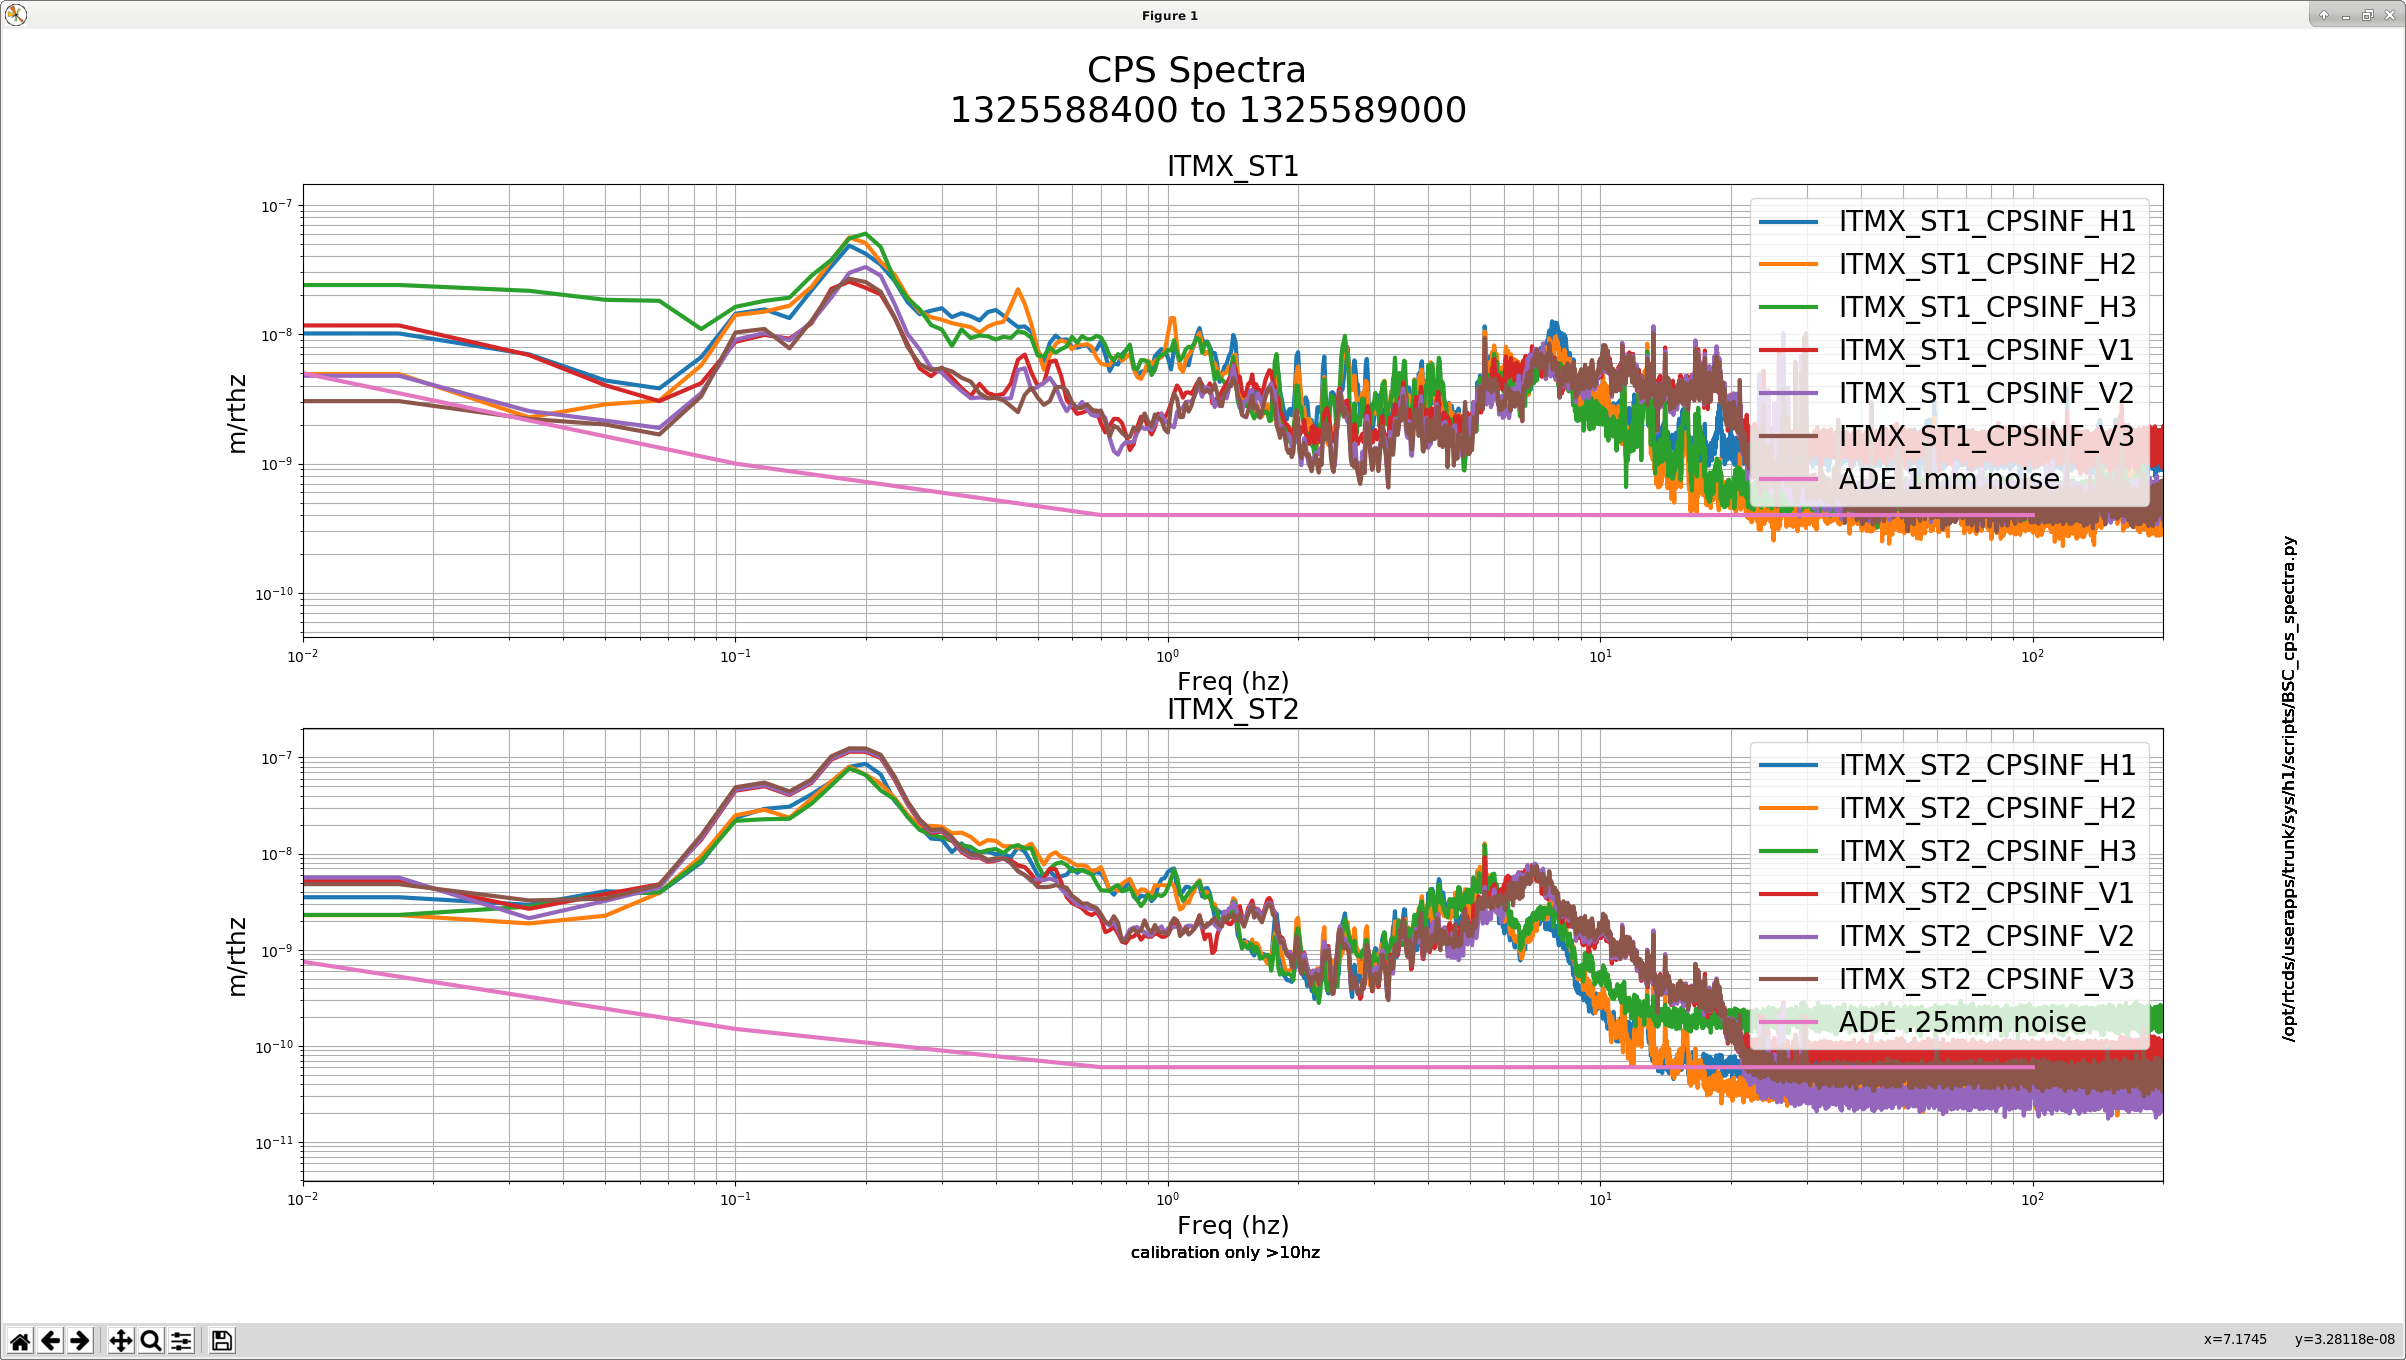
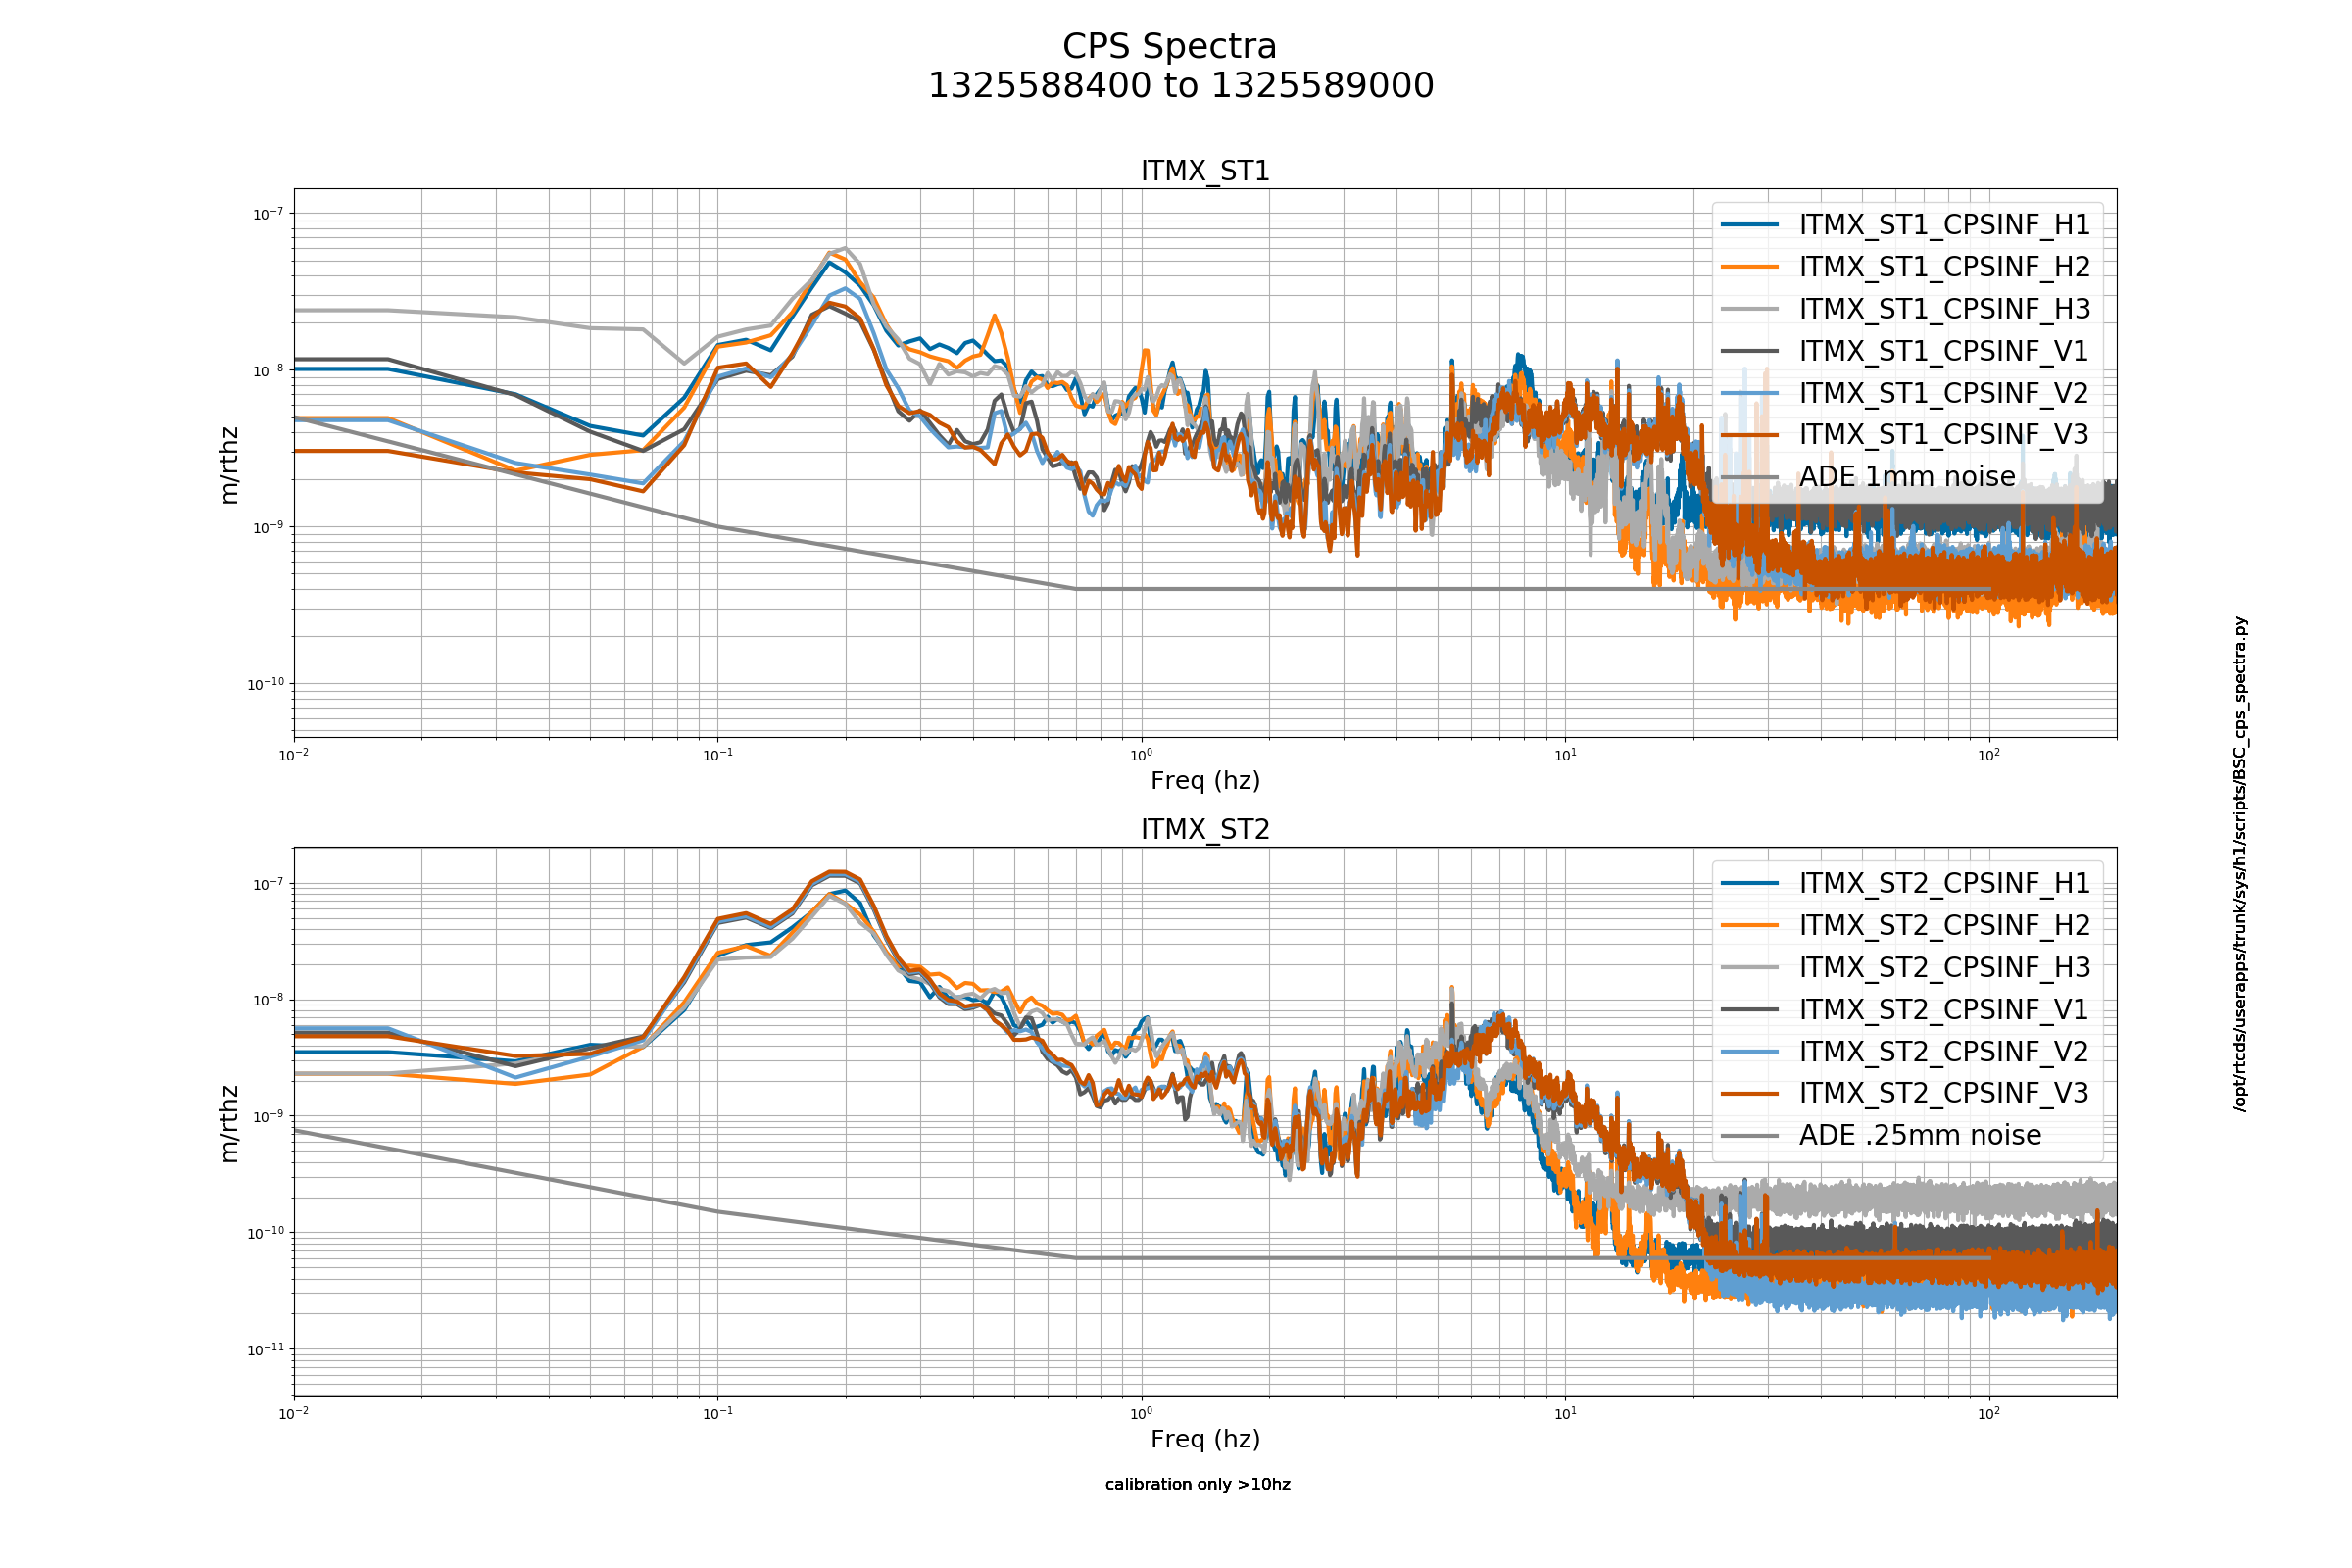
The first plot is one of the plots produced for the weekly CPS noise monitoring famis for ITMX. The second plt is the same one, but I added the colorblind style to the script. For me, on the first image the H3 and V1 sensors on both subplots are almost the same color. It's especially difficult to go between the legend and the traces on the first plot. Reading these plots on a backlit monitor make this even harder. More than a 4-6 traces, I have a really hard time telling which line is which.
On the second figure, it's much easier. Add in some different linestyles and thicknesses, and everybody's pretty plots can be appreciated by more people.
Nice one! Tagging all the groups, so some folks get emails about this dueteranope-approved color palate.

Now we just need the equivalent for matlab!