Following previous aLOGs related to the sensor correction:
- Coherence ground to ISI https://alog.ligo-wa.caltech.edu/aLOG/index.php?callRep=6274
- Master model modifications + Modification routines + Installation filters + Sensor correction from ground (first results) https://alog.ligo-wa.caltech.edu/aLOG/index.php?callRep=6319
- Installation of aggressive controllers https://alog.ligo-wa.caltech.edu/aLOG/index.php?callRep=6351
- Coherence Stage 1 to stage 2 https://alog.ligo-wa.caltech.edu/aLOG/index.php?callRep=6360
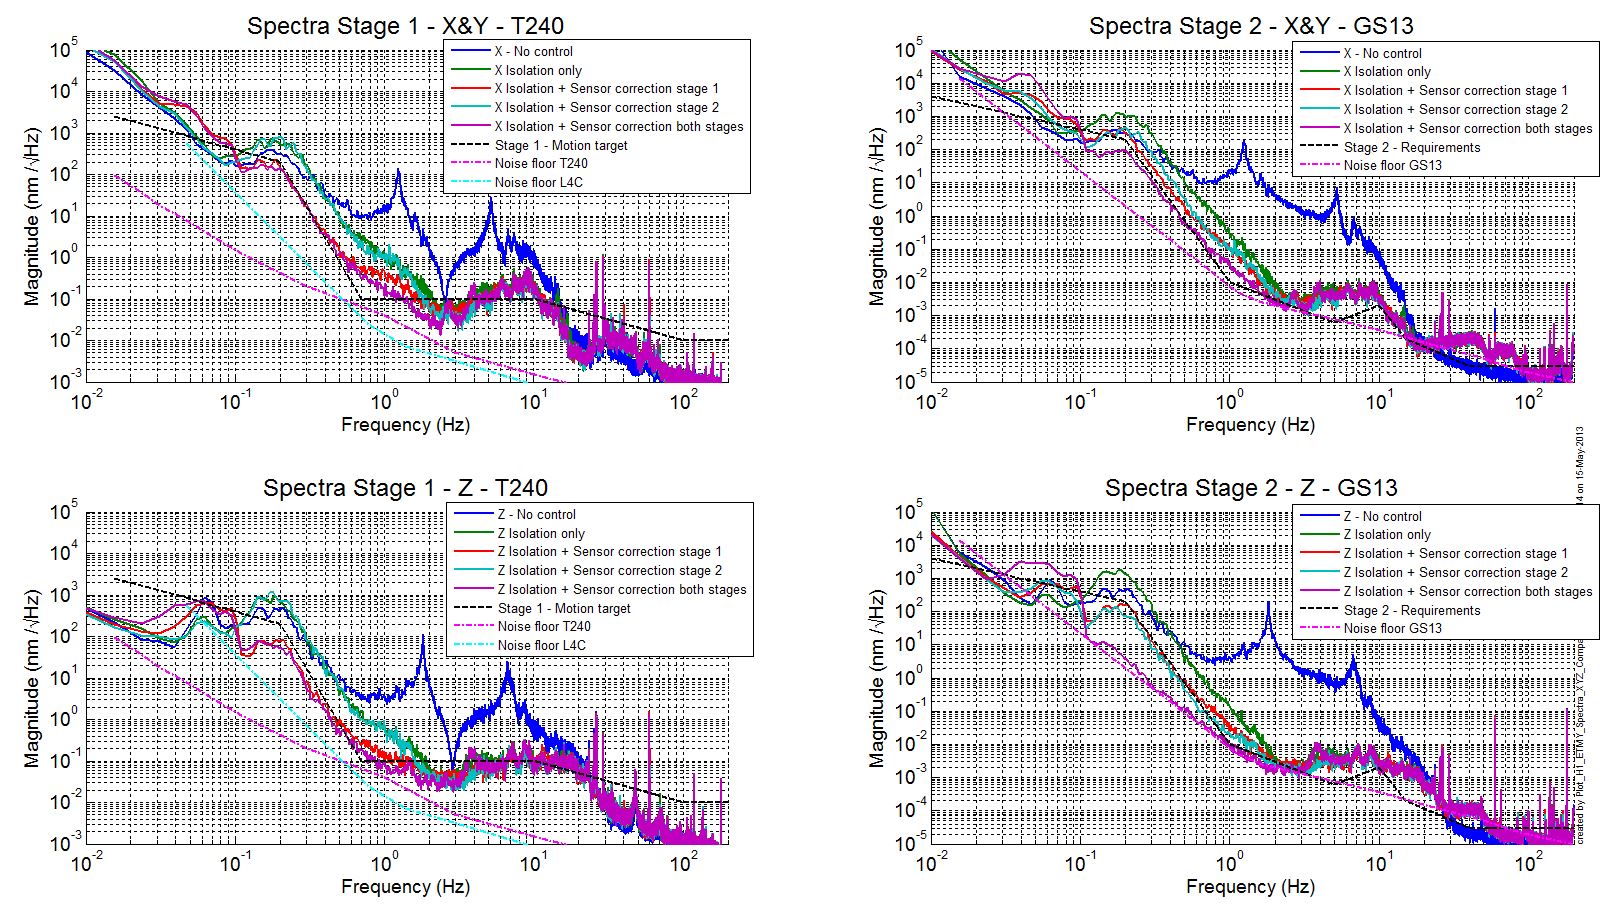
I tried to evaluate the contribution of each sensor correction on the suppression. For this test, I used the level 3 controllers (the aggressive ones) on both stages, blend at 250mHz in all DOFs. I measured spectra in the following configurations:
- No sensor corrections
- Isolation filters only (blend 250mHz – T240s - Level 3 isolation filters)
- Only the sensor correction from stage 0 to stage 1 using the STS-2
- Only the sensor correction from stage 1 to stage 2 using the T240s
- The sensor correction on both stages.
Spectra of translations and rotations of both stages are presented in attachment.
On the translation DOFs:
Isolation provided by the sensor correction from the ground to stage 1 and from stage 1 to stage 2 are quite similar (red vs cyan). In both cases, the sensor correction improves the isolation from 100mHz to 3Hz. The motion around the blend frequency is also reduced (the CPS low pass filters considerably increase the motion below 250mHz – Blue vs green). When the sensor correction is engaged on both stages (red), the individual suppressions are multiplied.
We can notice some amplification between 40mHz and 100mHz due to the aggressive high pass used for the sensor correction.
On the rotation DOFs:
We can notice on stage 1 in the RZ direction:
- around 250mHz, a huge amplification of the inertial motion when engaging the isolation loops (green vs blue).
- between 40mHz and 100mHz, a huge amplification (x100) due to the sensor correction (red, cyan, purple)
The important amplification is particularly visible in the RZ direction since the sensor correction is realized in the X and Y directions (only 1 sensor correction with vertical sensor). The low frequency amplifications are less visible on stage 2 since the GS13s are in their noise floor at low frequency.
Isolation performances on stage 2 seem limited by the noise floor of the super sensor.
I have started measurements to look at the cross coupling at low frequency.
Original file (spectra) can be found at:
https://svn.ligo.caltech.edu/svn/seismic/BSC-ISI/H1/ETMY/Data/Spectra/Isolated/
H1_ISI_ETMY_20130514_152000.xml
H1_ISI_ETMY_Spectra_RX_RY_RZ_Comparison_Sensor_Correction_20130514_152000.txt H1_ISI_ETMY_Spectra_XYZ_Comparison_Sensor_Correction_20130514_152000.txt
With :
Ref 0-14: No control
Ref 15-29: Isolation filters only
Ref 30-44: Isolation filters + Sensor correction using STS-2
Ref 45-59: Isolation filters + Sensor correction using T240
Ref 60-74: Isolation filters + Sensor correction using STS-2 and T240s