Spectra
I generated three days worth of daily averages of H1:OAF-CLEAN_DELTAL_EXTERNAL_DQ restricted to H1:DMT-GRD_ISC_LOCK_NOMINAL times. Standard spectral plots can be found here. (This uses Fscan infrastructure, but not part of Fscan production jobs.)
Overview
- Many of the troublesome combs from O3 are not present in this data. This is especially true of the many near 1-Hz and near 2-Hz combs we noted in O3 (but don't get too excited about the near 2-Hz situation, see below.)
- Some O3 combs are still present with slightly shifted frequencies. This includes the near ~5 Hz and ~11 Hz combs.
- New combs have appeared. Once again, I'm seeing a lot of multiples of near 2-Hz frequencies. But they don't appear to be the precise 2.0 Hz combs with strange offsets that were common on the O3 lines list.
Quick link: O3 H1 lines list.
Tools and timeline
Several weeks ago I took a very brief look at early September low-noise data by simply overlaying the full O3 lines list onto a few hours of spectral data. I noted that few of the pervasive O3 combs seemed to be present, and was pleased by that initial result. However, I held off on posting an alog until we could get Fscans and some dependent scripts updated to facilitate a closer look. This turned out to be a good call. Visually inspecting a single spectrum is often not sufficient to pick out combs, and the additional tools helped me see additional artifacts.
The Fscan code (git repository link) was used generate daily averaged data. I then used some in-development code for generating improved interactive plots, automated line and comb identification, and visualization (you can find the draft code here).
Combs from O3 that are still in the September data
- The 1.0 Hz comb (zero offset) is still showing up, although it is not very strong.
- The 5.23548 Hz comb (zero offset) appears strongly in the 9/1 data but not 9/2 or 9/3, and it is very slightly shifted in frequency.
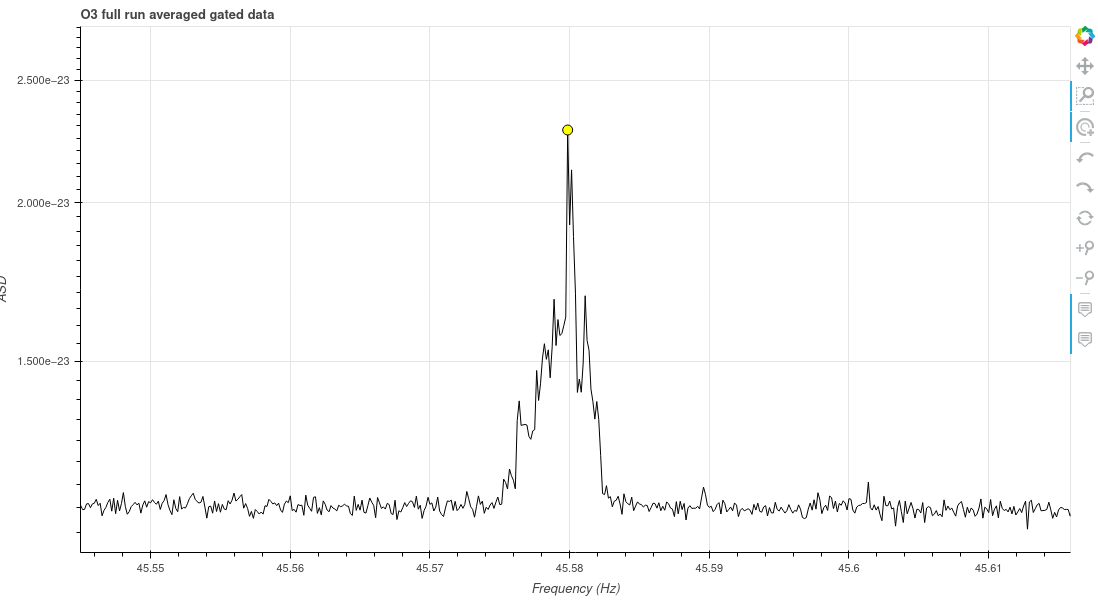
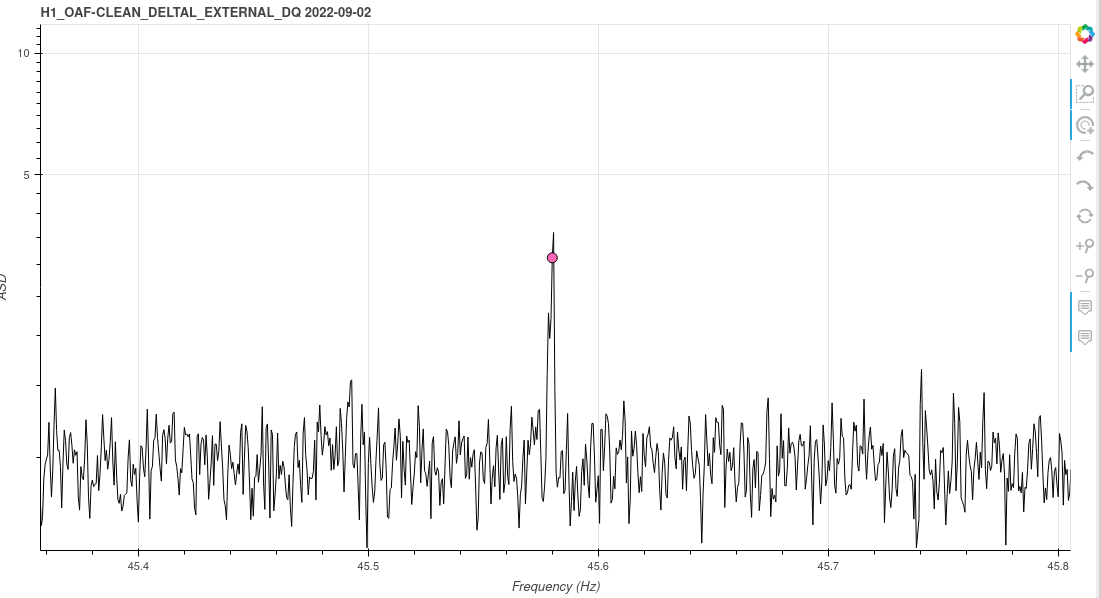
- The 11.39495 Hz comb (zero offset) also appears on 9/2 and 9/3 (but not 9/1) again with slight frequency shifts. Note that this comb was present as a multi-peak structure in the O3 averaged data, possibly indicating that it was also shifting over time in O3. Relatedly, odd harmonics of a 11.92111 Hz comb (listed as 23.84222 Hz with 11.92111 Hz offset) are also present.
- The near 16 Hz comb (listed as 16.0 Hz with 15.99973 Hz offset) is also present, again with slight frequency shifts.
- The 29.9695465 Hz comb is present all three days.
Combs from O3 that were not seen in this data
Except for the entries noted above, I did not see evidence of O3 combs in the data. That means most of the problematic near-1 Hz and near 2-Hz combs from the O3 lines list are not visible.
New combs in the September data
Automatic identification of lines and combs remains experimental, but we have made good progress on this since O3. I ran the current version of the comb finding code on all three daily spectra and plotted the results. Here are the new entries:
- 3.98735 Hz comb (zero offset). Not visible in O3 spectrum; apparently new. Present all three days.
- ~2.46154 Hz comb (recovered by the combfinder as 2.46154 with 2.46107 offset). Not visible in O3 spectrum; apparently new. Present all three days.
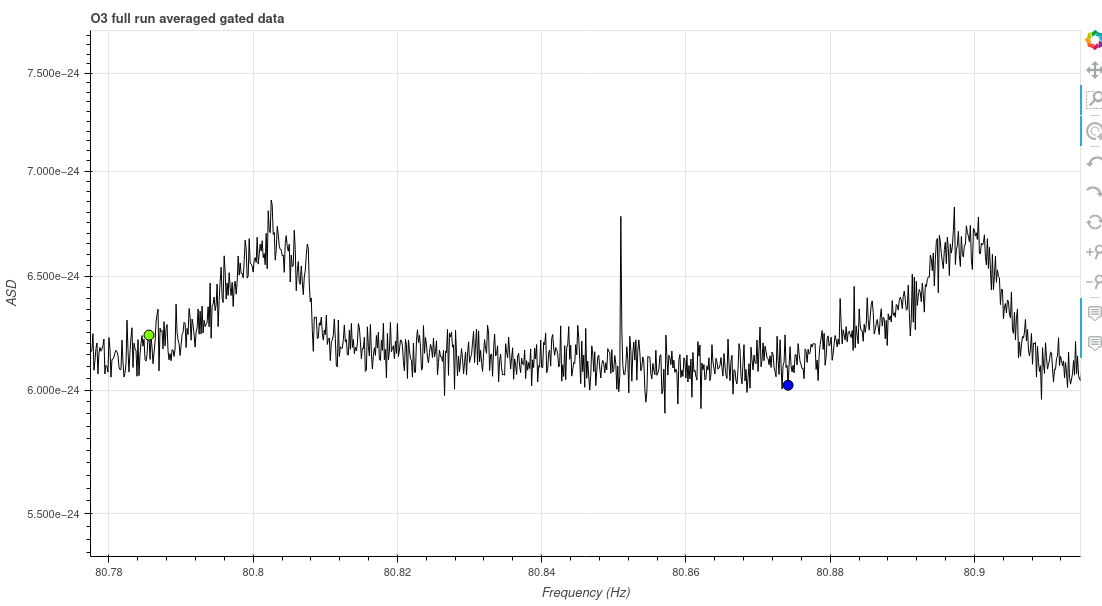
- 12.13103 Hz with 8.08796 and and 12.11778 with 8.07889 offset. Although these are not present in the O3 lines list, when overlaid with the O3 spectrum it is clear that they lie just to the left of the two peaks of a repeating "unidentified broad line" in the O3 spectrum (not previously labeled as a comb). Present all three days.
- 4.1666 Hz comb with 0.00012 Hz offset. Not visible in O3 spectrum; apparently new. Present all three days.
- 4.92206 with 1.19728 Hz offset. Present 9/2 and 9/3.
- 16.26206 Hz with 13.26767 Hz offset. Not visible in O3 spectrum; apparently new. Fairly weak; mostly present on 9/3.
Plots
Key interactive plots are linked below. These plots may take a moment to load in your browser, but it's hopefully worth it for the zoom ability. Labels for the points are contained as hover text. Screenshots included as attachments; I also intend to keep these plots around.
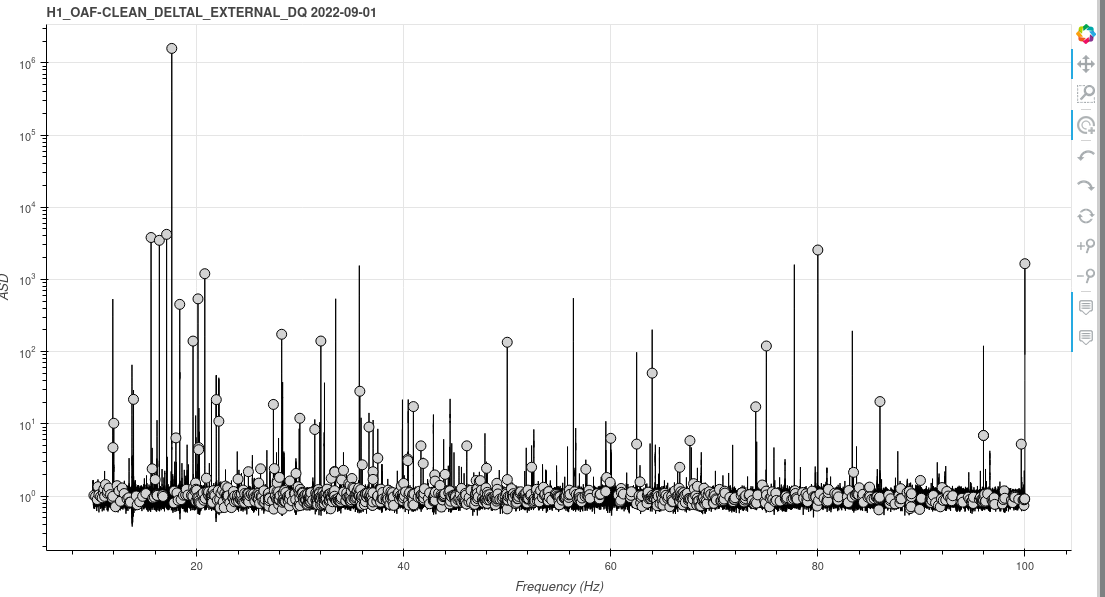
- Overlay of the full O3 lines list onto data from 9/1 (hard to read; included mainly for completeness). Attachment 1.
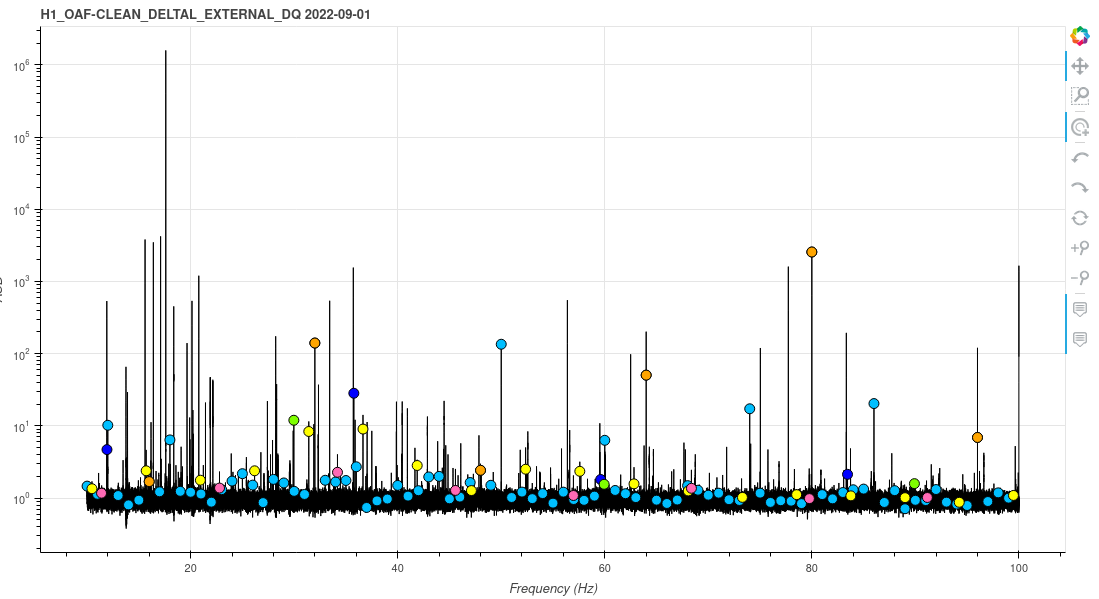
- Overlay of previously-known (O3) combs listed above onto 9/1 data. Plots for other days are in the same folder, using the same naming convention. Attachment 2, legend: Light blue: 1 Hz. Yellow: ~5 Hz. Orange: ~16 Hz. Pink: ~11 Hz. Green: ~30 Hz. Dark blue: ~23 Hz.
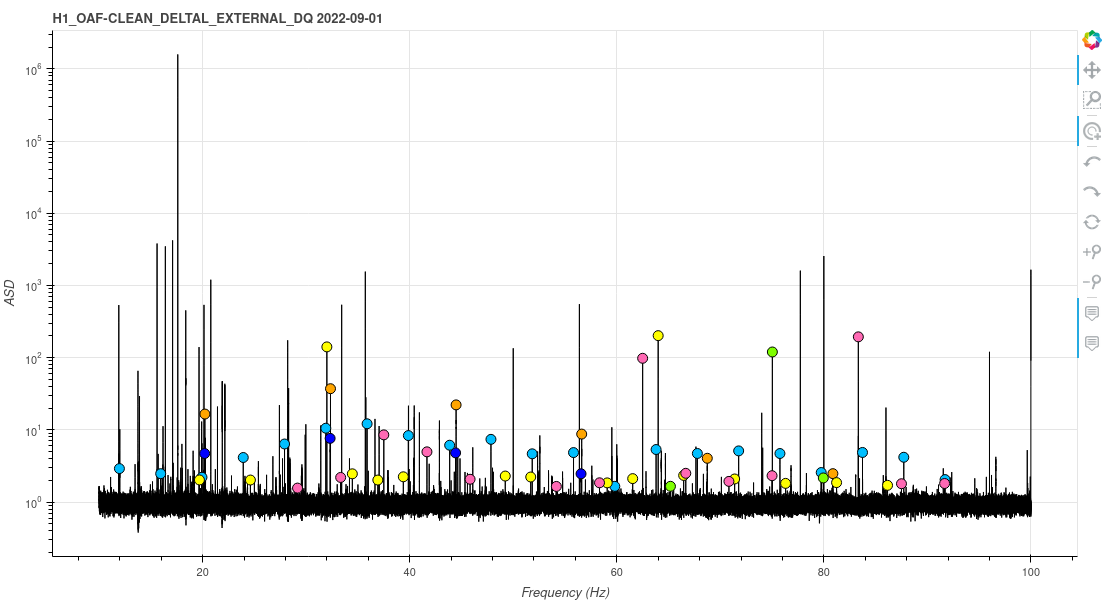
- Overlay of apparently new combs from all three days onto the 9/1 data. Plots for other days are in the same folder. Plots for other days are in the same folder, using the same naming convention. Attachment 3, legend: Light blue ~3.99 Hz. Yellow: ~2.46 Hz. Orange: ~12.13 Hz. Dark blue: ~12.12 Hz . Pink: ~4.17 Hz. Green: ~4.92 Hz. 16 Hz not shown for this day.
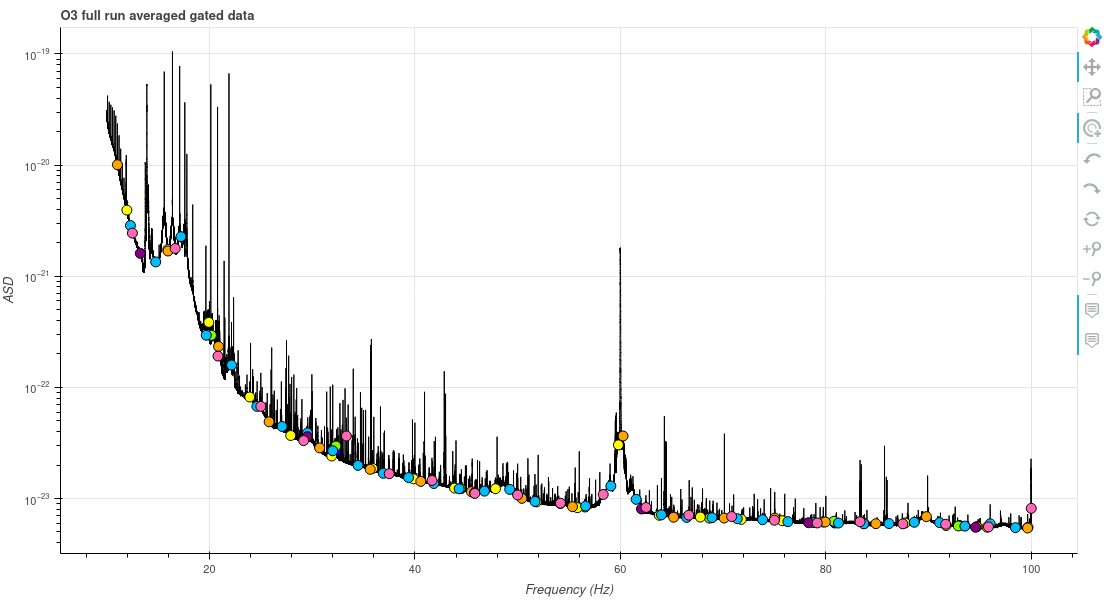
- Overlay of the apparently new combs onto O3 run-averaged spectra. Attachment 4.
Despite the lack of legends on the interactive plots, I have taken screen captures and attached them below. I have also zoomed in on a couple of noted features. Attachment 5: detail of the near 11 Hz comb in O3 data. Attachment 6: detail of the near 11 Hz comb in recent data. Attachment 7: detail of repeating "unidentified broad peak" O3 structure with overlaid with recently noted ~12 Hz combs. (Same pattern seen elsewhere in the spectrum.)