I wrote a little function that shows the coherence between the different channels. It creates a video to ease the viewing of the results (each frame is a frequency step).
I looked at the cross coupling on ISI-BSC6 using the following configuration:
- HEPI not controlled (It might be interresting to redo the measurement with the HEPI controlled)
- ISI controlled level 3, Blend 250mHz on both stages, T240s in stage 1 super sensor
- Sensor correction on both stages in X, Y and Z directions (no HEPI-L4C & STS-2 blend)
The video of the results can be downloaded at: https://svn.ligo.caltech.edu/svn/seismic/BSC-ISI/H1/ETMY/Scripts/Misc/ H1_ISI_ETMY_Cross_Coupling_20130515.avi
The list of channels is presented in: https://svn.ligo.caltech.edu/svn/seismic/BSC-ISI/H1/ETMY/Scripts/Misc/ Channels_List.txt
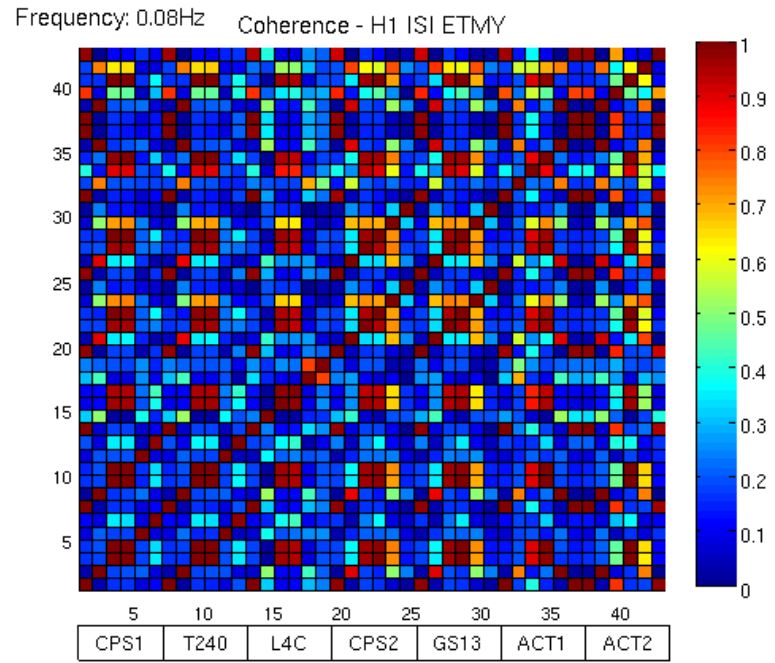
At 80mHz (where the motion amplification created by the control is maximal), the coherence matrix is presented in attachment (H1_ISI_ETMY_Coherence_Matrix_80mHz_20130515.jpg). Each patch is the coherence value.
Lots of information are displayed in the plot. For instance some of the important cross couplings are:
- Sensors Z to Rz on both stages
- Sensors X to Ry (on stage 2)
- Sensors Y to Rx (on stage 2)
- Actuators drive X->Ry,Rz (on both stages)
- Actuators drive Y->Rx,Rz (on both stages)
- Actuators drive Z->Rz (on both stages)
Previous experiences showed that large amplifications at low frequency are created by the control (reasons not totally defined). These amplifications are difficult to evaluate with the seismometers since the measured motions are in (or close from) the noise floor of the inertial instruments. Even if it is tricky to look at the position sensors, they can give us a good idea of the inertial motion amplification (HEPI is not controlled or controlled in position at 80mHz).Below the blend frequency, the error signal should ideally be dominated by the position sensors signals. Consequently, the relative motion between stage 0 - stage 1 and stage 1-stage 2 should be zeroed out.
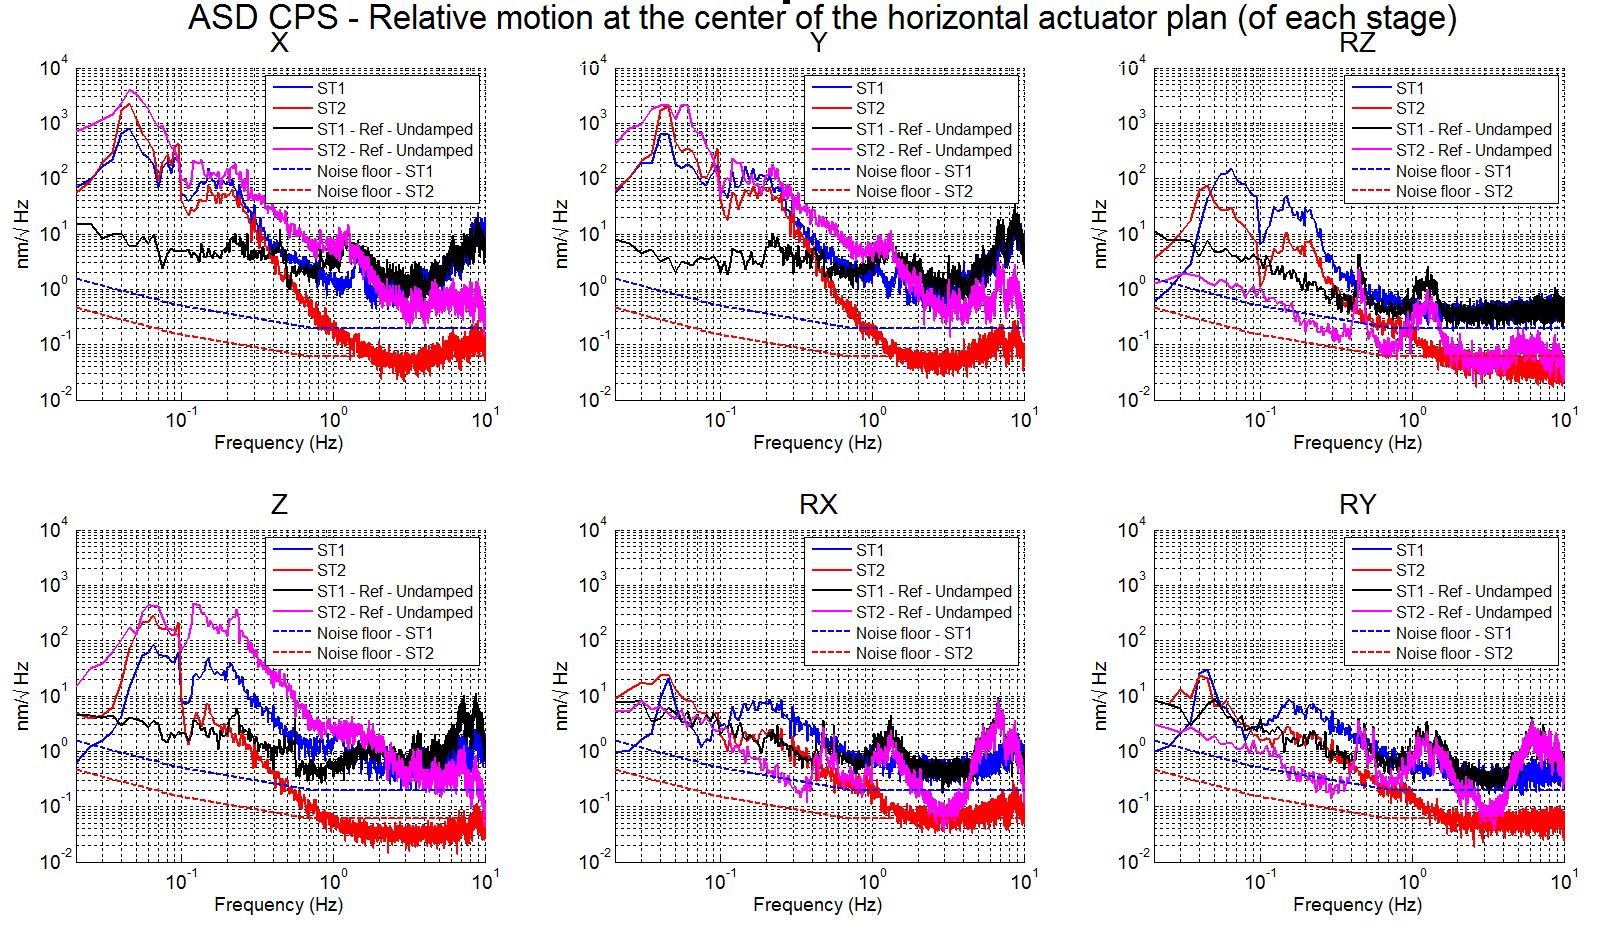
The attached plot (H1_ISI_ETMY_ASD_CPS_Different_Sensor_Correction_20130515.jpg) shows the relative motion of the two stages (at the center of the horizontal actuators plan) when the ISI is controlled with the configuration described above.
Stage 1 - Comparison No control (black) vs Control (blue):
- In the X,Y directions, the motion of stage 1 relative to stage 0 is amplified by 1000 in the 50mHz-80mHz frequency band.
- In the Z, Rz directions, the motion of stage 1 relative to stage 0 is amplified by 50-100 in the 50mHz-80mHz frequency band
- In the Rx, Ry directions, the amplification of the stage 1 motion is limited in the 50mHz-80mHz frequency band
Stage 2 - Comparison No control (magenta) vs Control (red):
The relative motion between stage 1 and stage 2 is only amplified in the Z and RZ directions (amplification factor 50-100).
Regarding these results, it seems that most of the low frequency amplification comes from stage 1.