A new tool called WD_Plots was created by SEI at Stanford (Charles, Brian and I). It allows plotting the timeseries for a given set of sensors/actuators at the time of the latest WD trip, by simply using a button on an ISI's Watchdog MEDM screen.
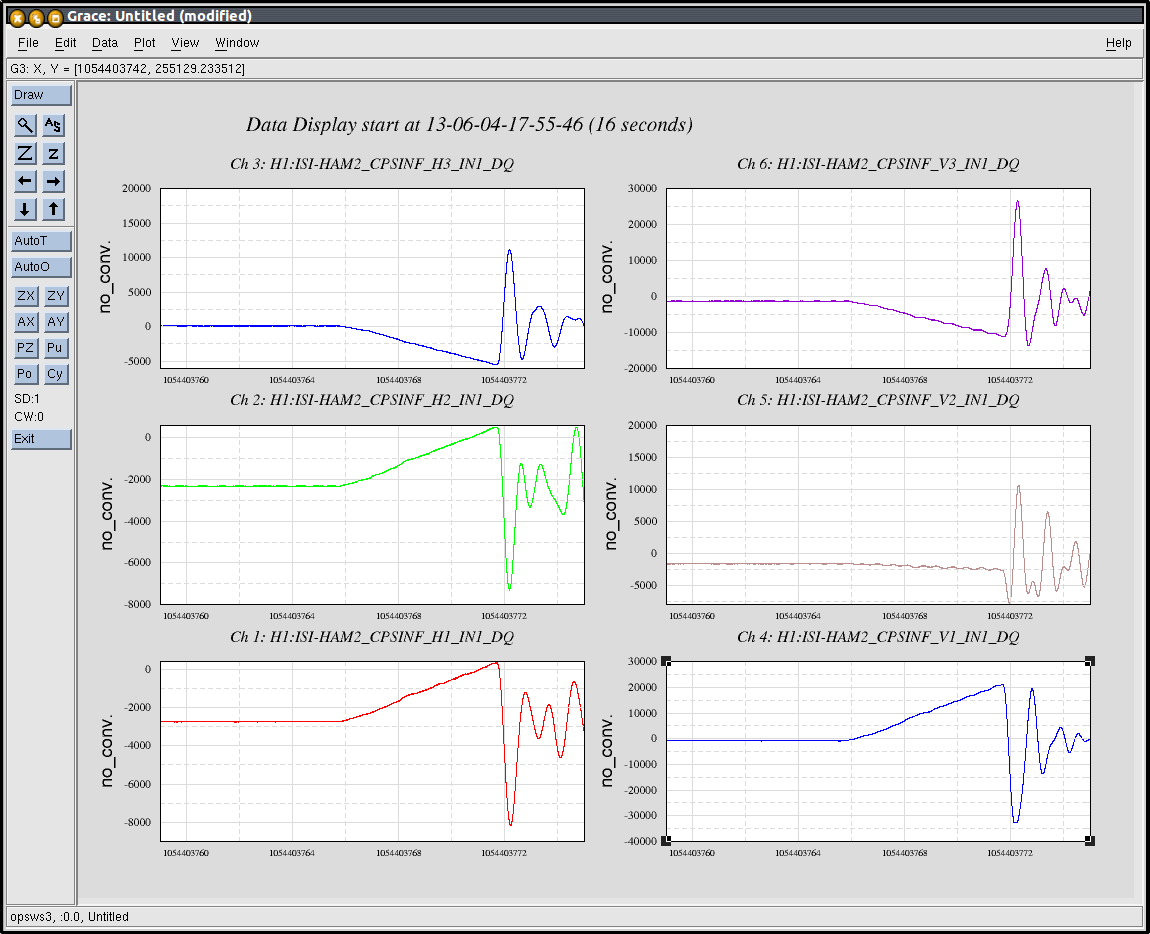
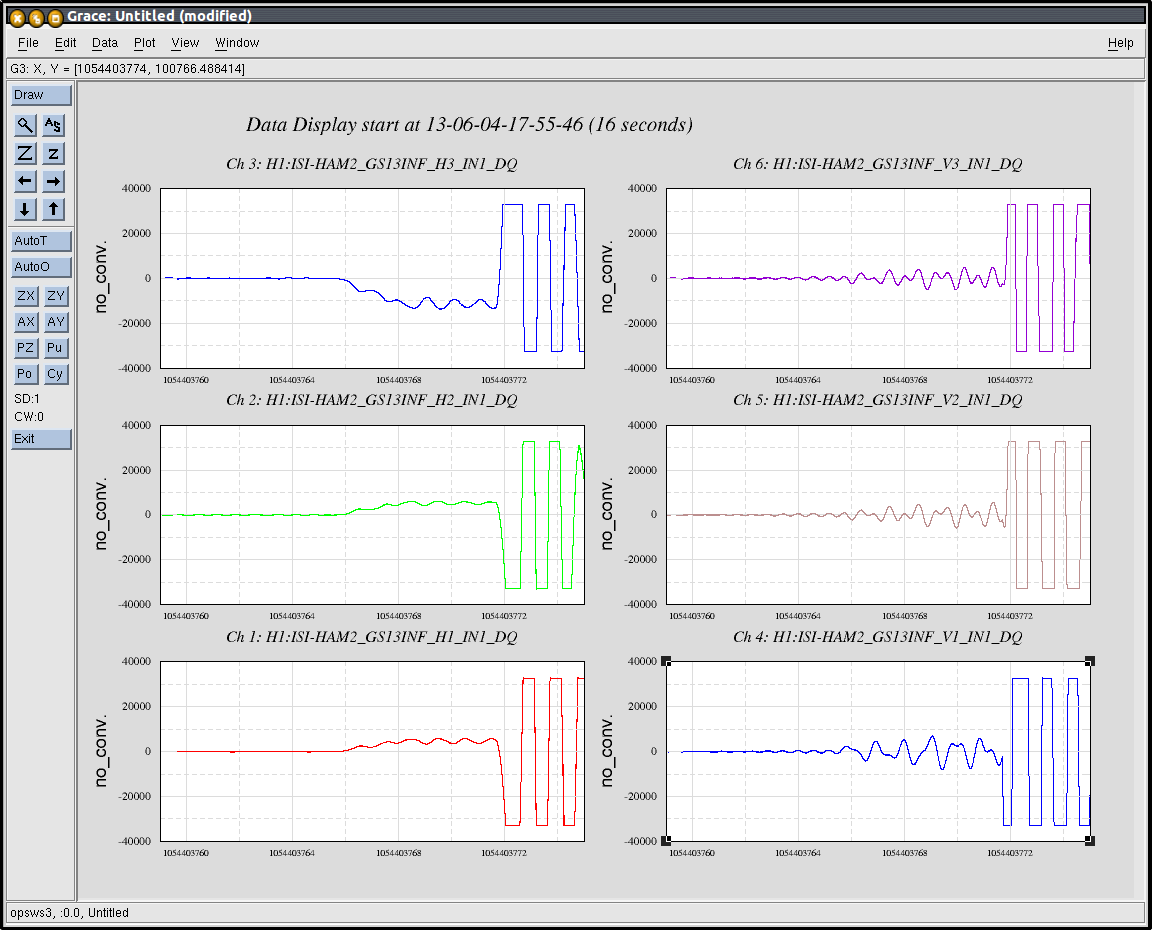
This tool was installed at LHO. Minor tweeks had to be made to stddir.py, which Jim Batch took care of. I tested it this morning (GPS time:1054403768) on HAM2-ISI.
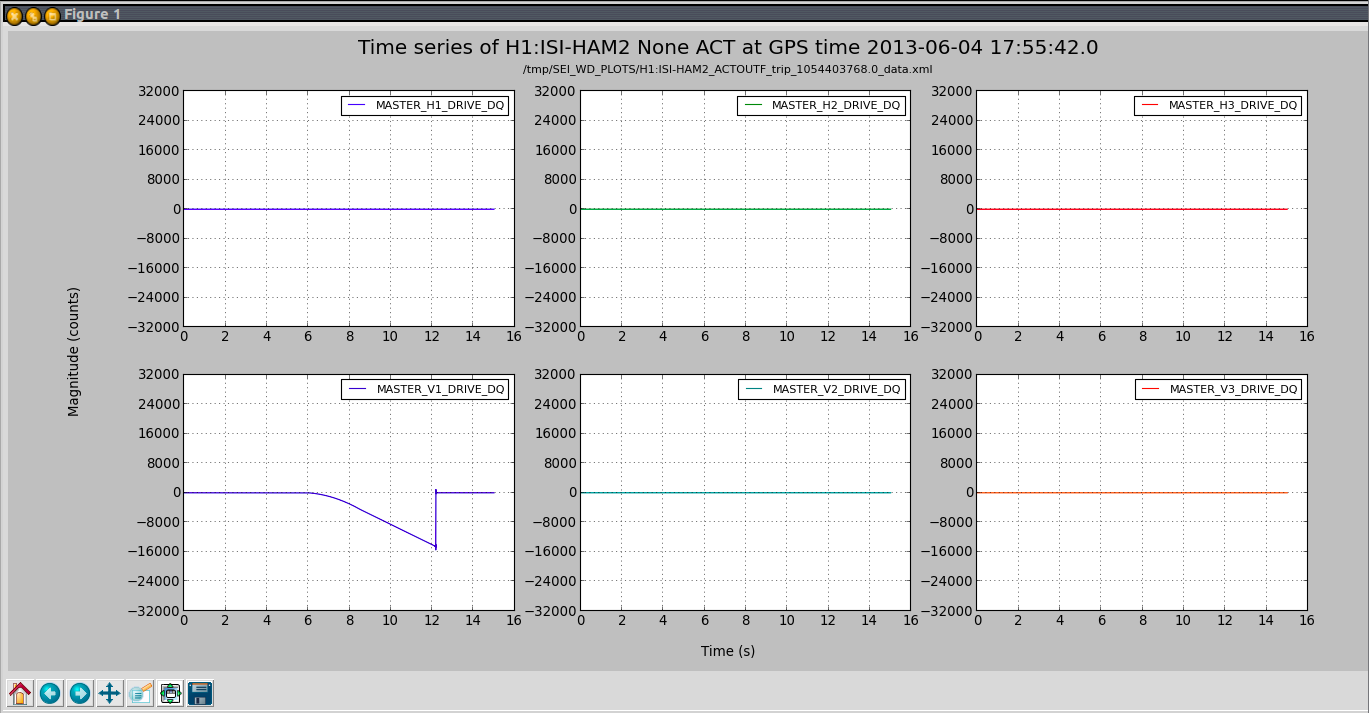
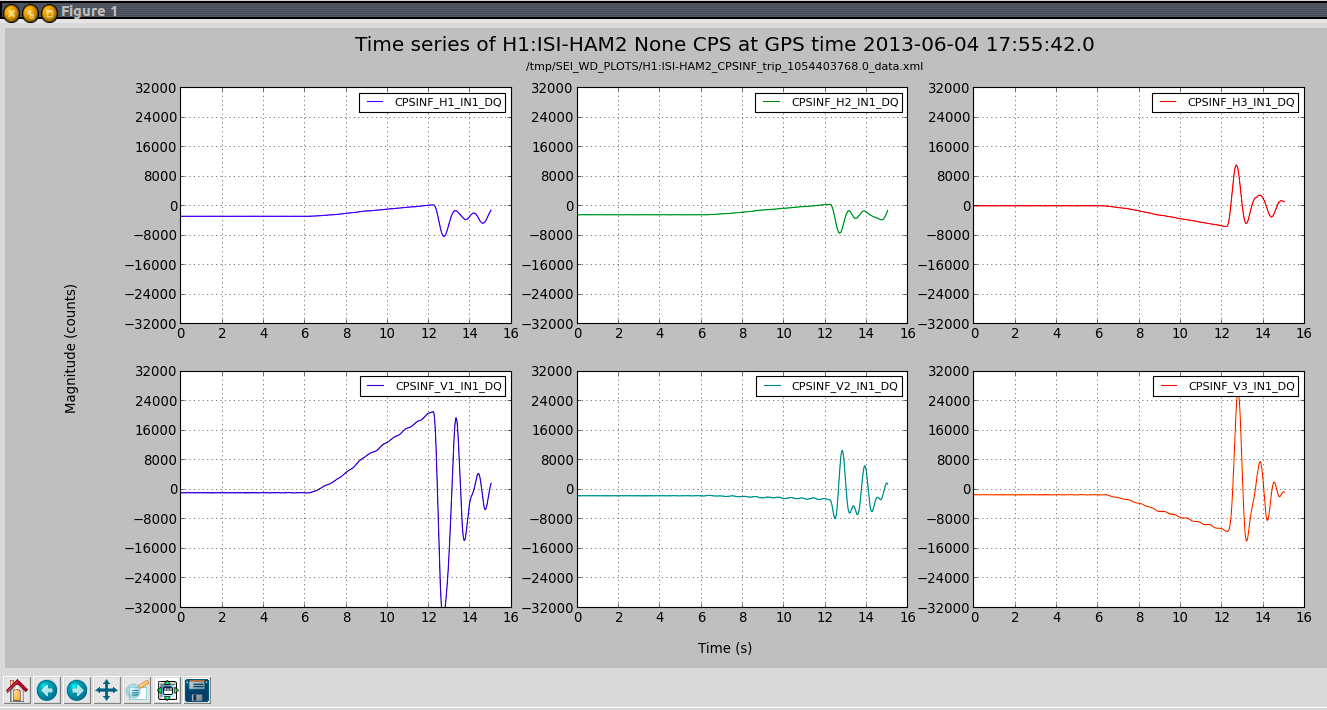
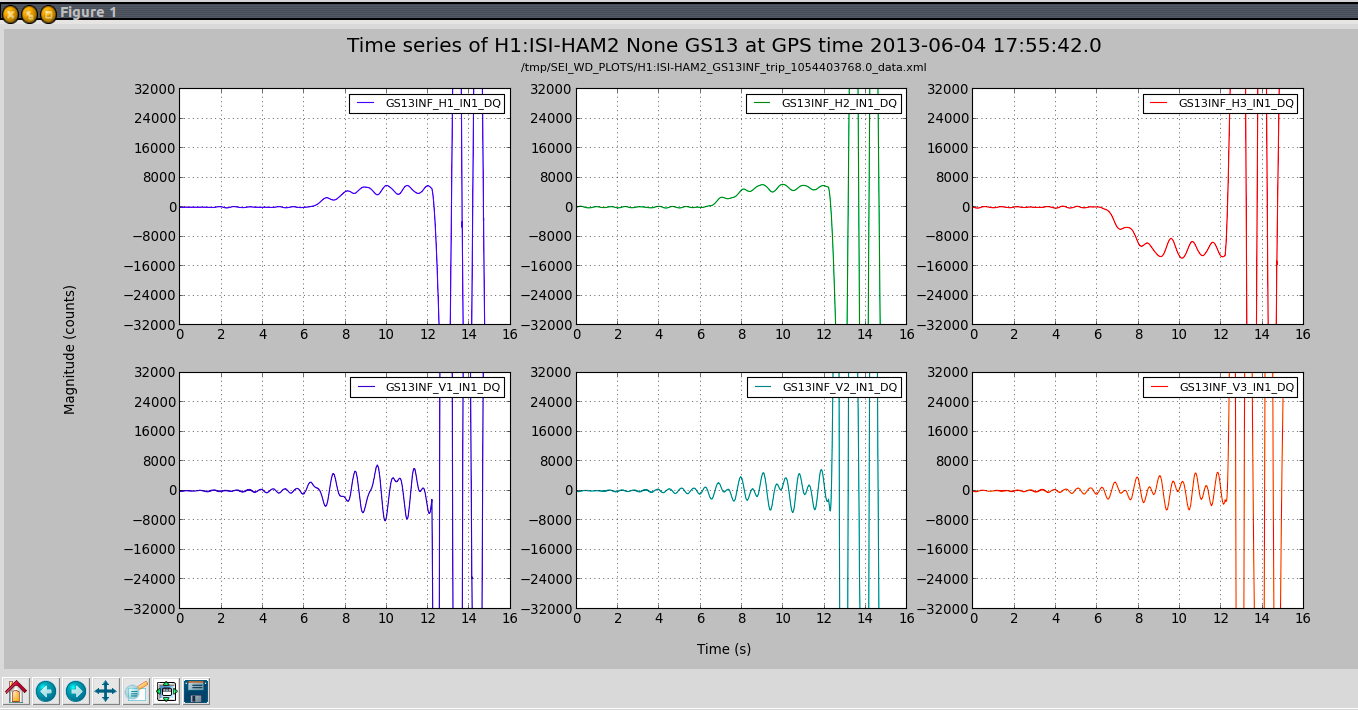
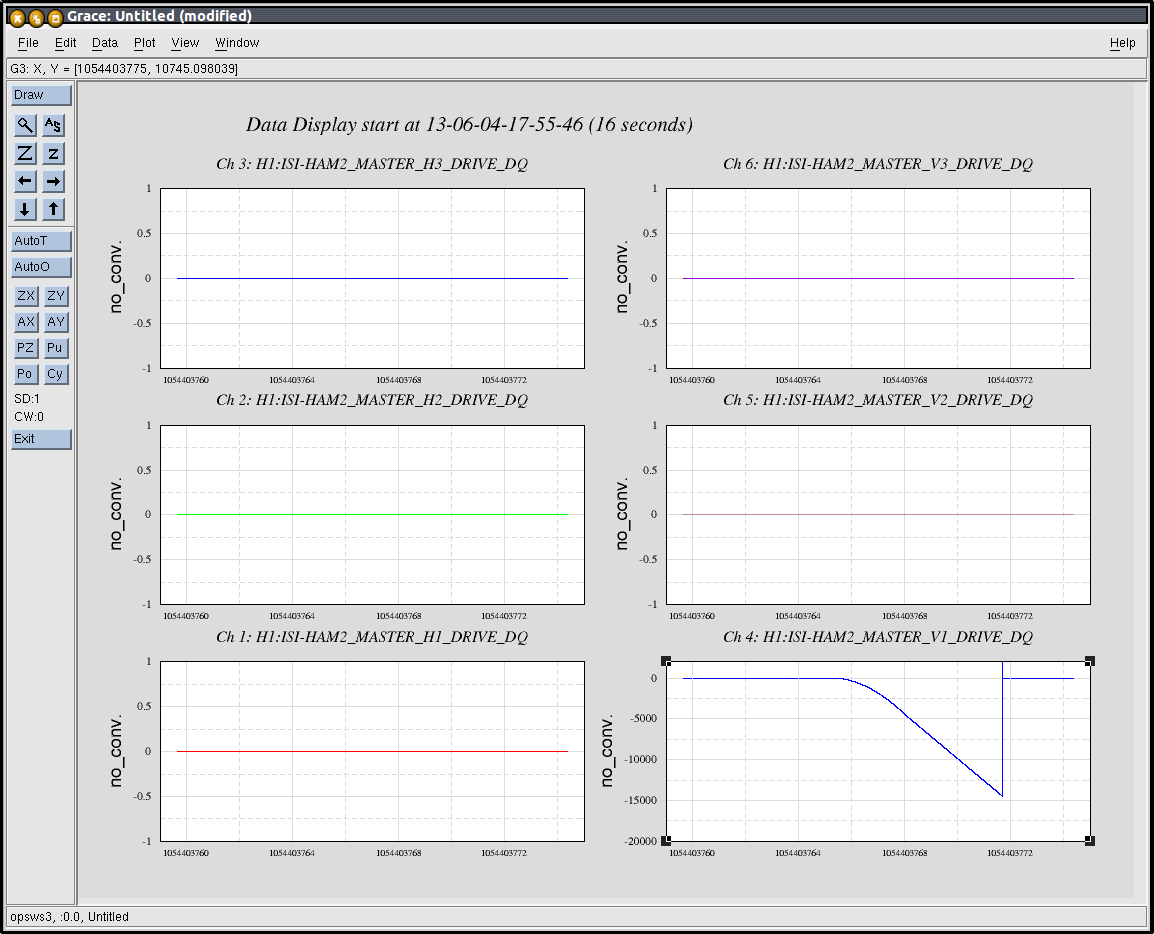
To do so, I tripped the ISI, on the CPSs with a 20,000cts ramp on V1. Produced plots are attached (ACT, CPS, GS13). They were compared to data retreived with Dataviewer (ACT, CPS, GS13). Channel routing appears to be correct. So is lookup time.
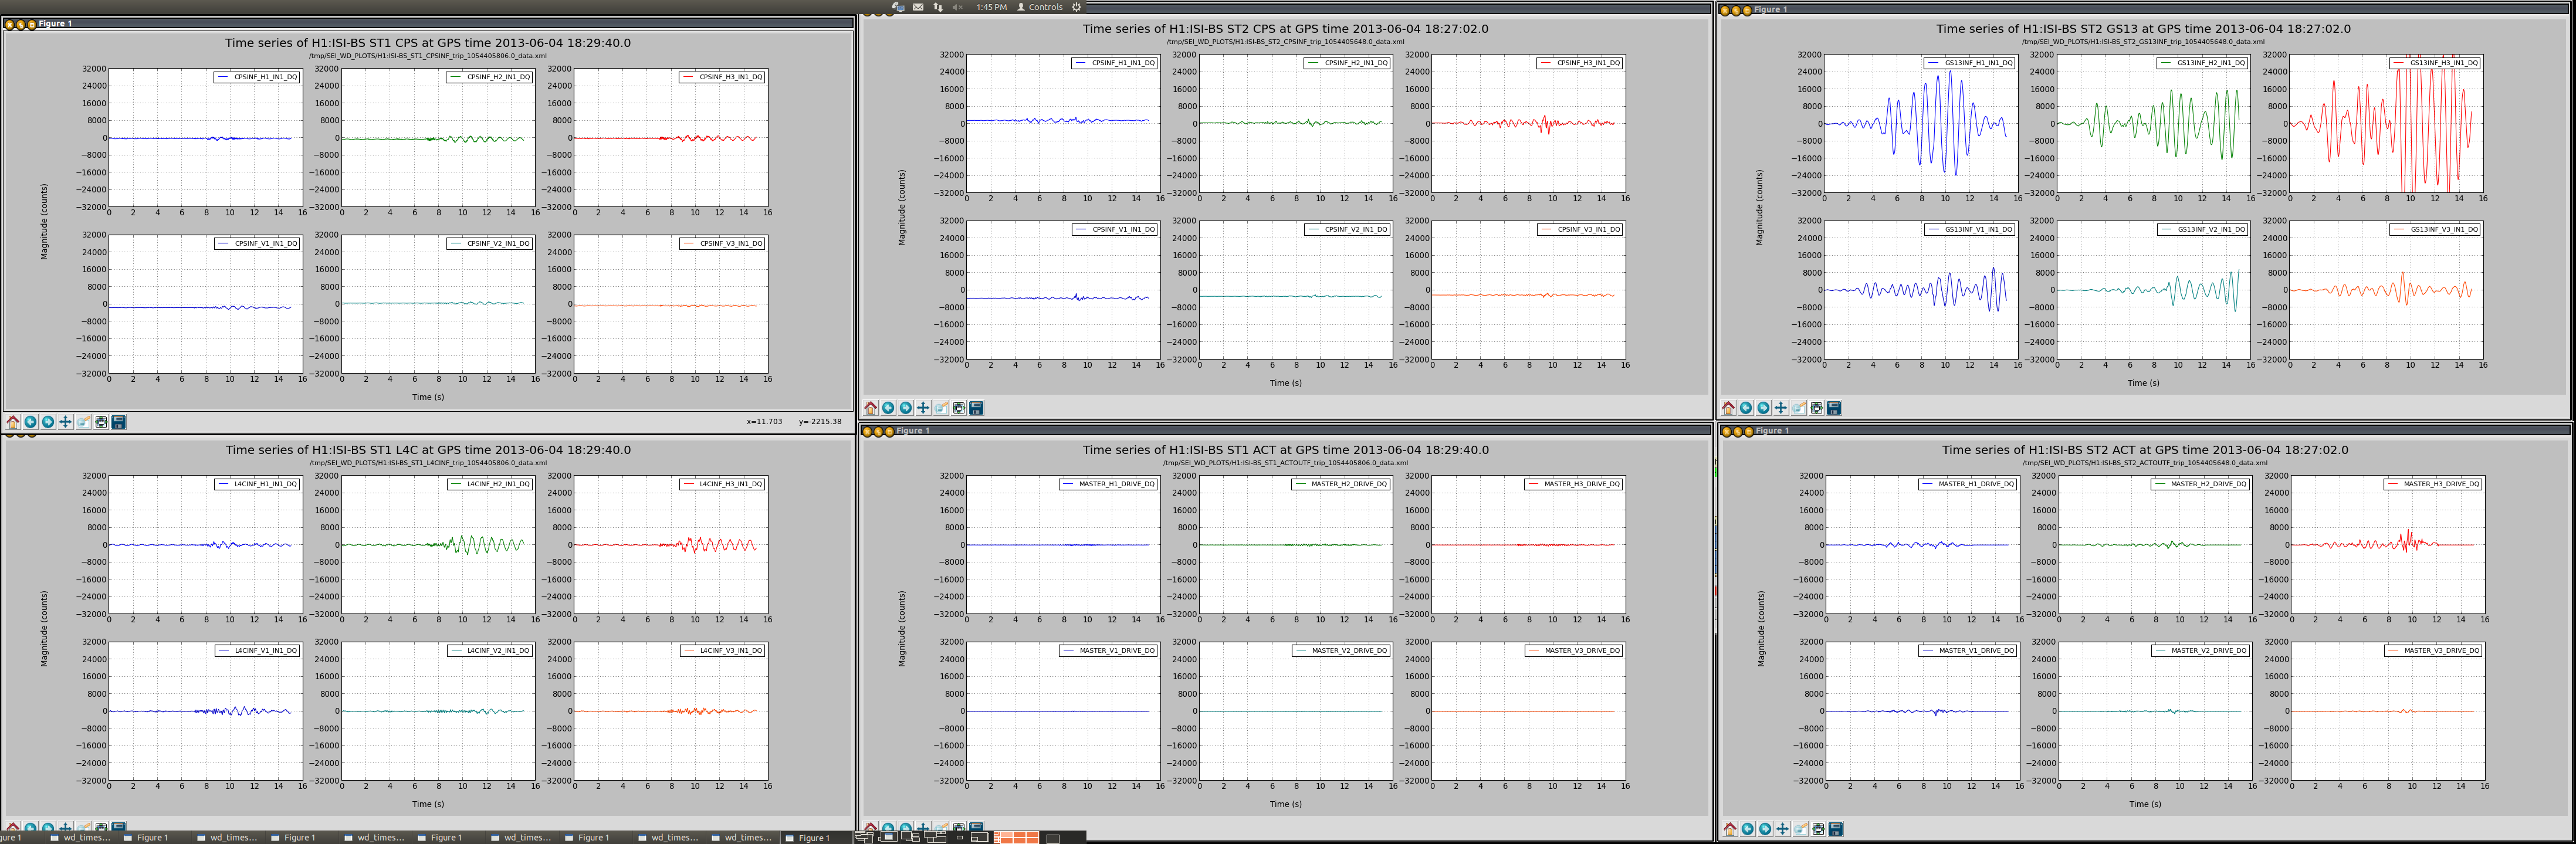
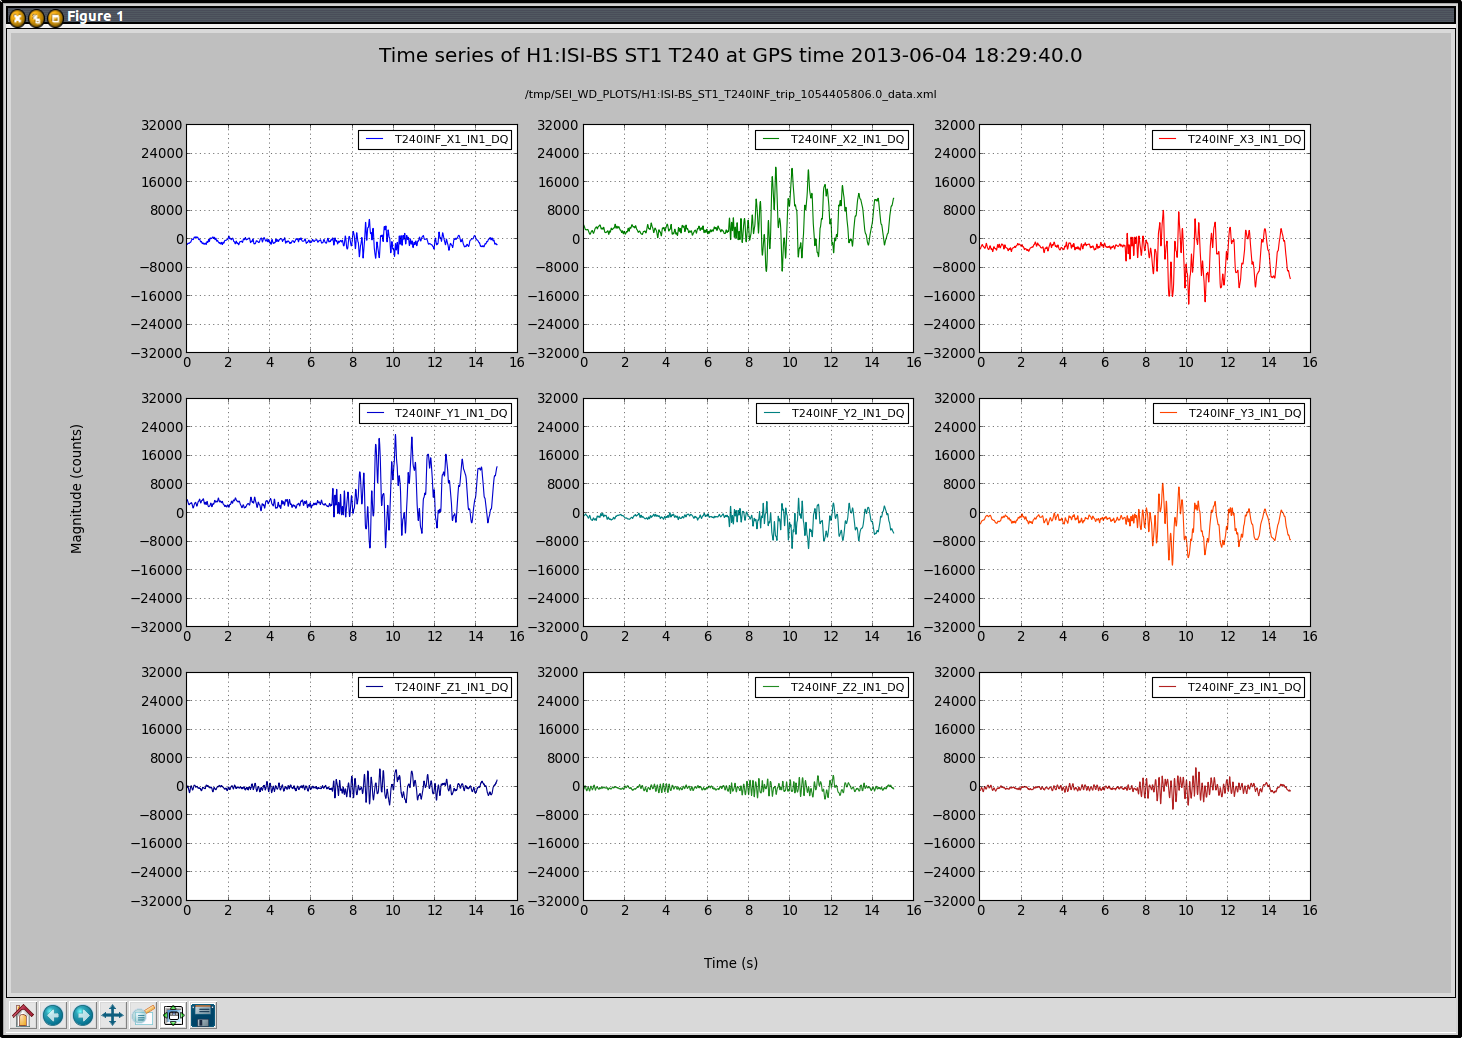
I also picked a tripped BSC (H1:ISI-BS) and tried producing the plots from its WD screens. Time series could be displayed for each sensor/actuator set (1, 2).
WD_Plots works at LHO. It may now be used by the operators to diagnose when an ISI trips.
I attached a pdf that shows how to use it from the ISI overview screens.
This is a first version that we are hoping to improve. Next, we plan on adding a vertical line to display the trip time on those plots.Further improvements could be done and operator feedback is welcome 
Note:
The scripts used are commont to all ISIs. They are under revision control at:
opt/rtcds/userapps/release/isi/common/scripts/wd_plots/
The svn update performed on those scripts was covered by WP3903. Script were not changed since.