
Stefan, Dan
We had some time today powering up on RF today to do some OMC lock/unlocked tests and some OMC scans at 50W.
Heating up the TSAMs can be seen in figure 2. Here the DCPD power dropped by 9.8mW and OMC REFL increased by 9.4mW. Overall this is a 8.45/17.14 = 50% drop in throughput... no change in AS_C power was seen. It is hard to imagine this transmission drop is all quadratic mode mismatch, and we suspect must be alignment related.
From the OMC locked/unlocked test at 50W the ratio between the DCPD drop vs the OMC REFL increase is: 21.4 mW / 22.7mW = 94%
I also did three scans with different settings whilst the TSAMs was hot, Craig will try analysing these remotely:
- 1st 1354330055 - Smaller DARM offset and lower 45 mod depth
- 2nd 1354330325 - Doubled DARM offset and lower 45 mod depth
- 3rd 1354331302 - Double DARM offset and higher 45 mod depth
As we couldn't see the PCAL lines in OMC REFL, Stefan and I also tried driving a 1Hz excitation into DARM1 to look at the relative mode height instead. Stefan will attach a plot looking at that.
We got greedy and tried a higher frequency so that we could then change some alignment offsets but lost lock doing so. Will leave the IFO DOWN for the night.


Here is a plot of AS_C, OMC_REFL and OMC_SUM_DCPD, with the gain of OMC_SUM_DCPD and AS_C matched at the injected 1Hz beacon (normalized to 1), and the gain of OMC_REFL scaled to match the noise in AS_C.
Note that there is still 24% of the 1Hz signal in OMC_REFL while the OMC is locked - not good.
Compare that to the alog 21489, where we got 1.2%

Annoyingly I forgot to switch the OMC ASC back on after each of my on/off/scan tests. So it wasn't on for large sections of the tests last night.
However, when I did switch it on it didn't make a particularly large difference. DCPD transmission went up maybe 1 mA or so.
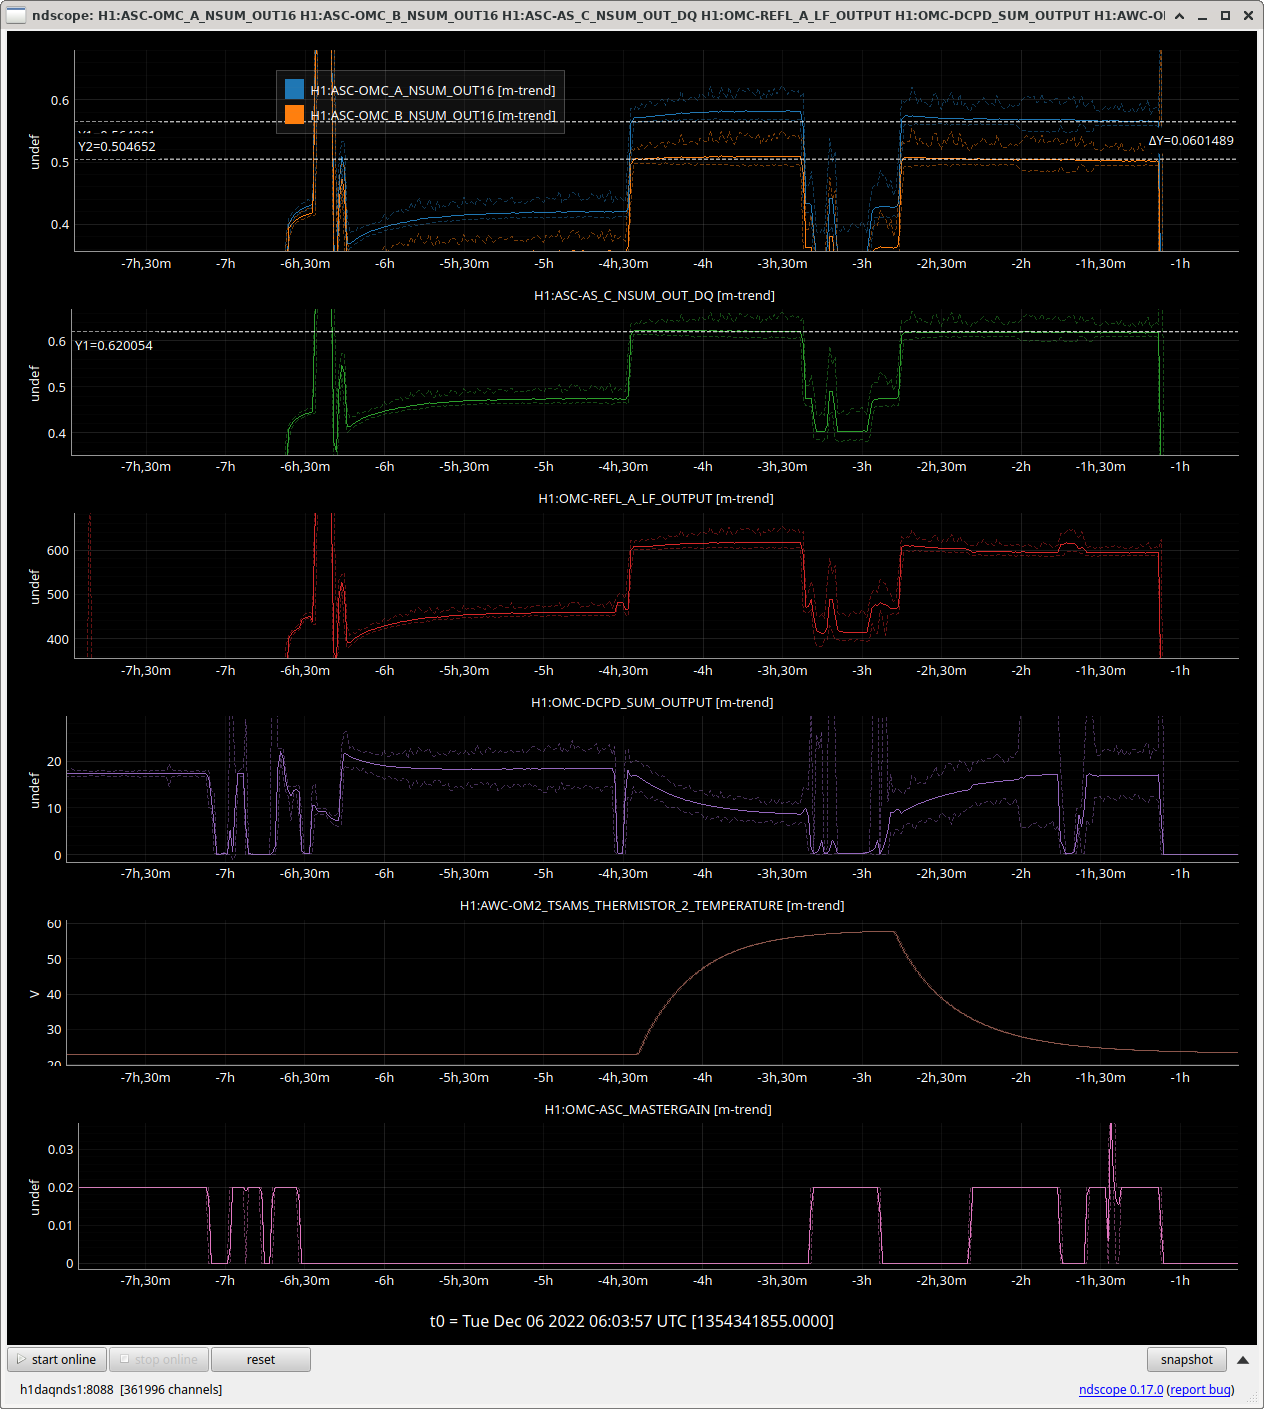

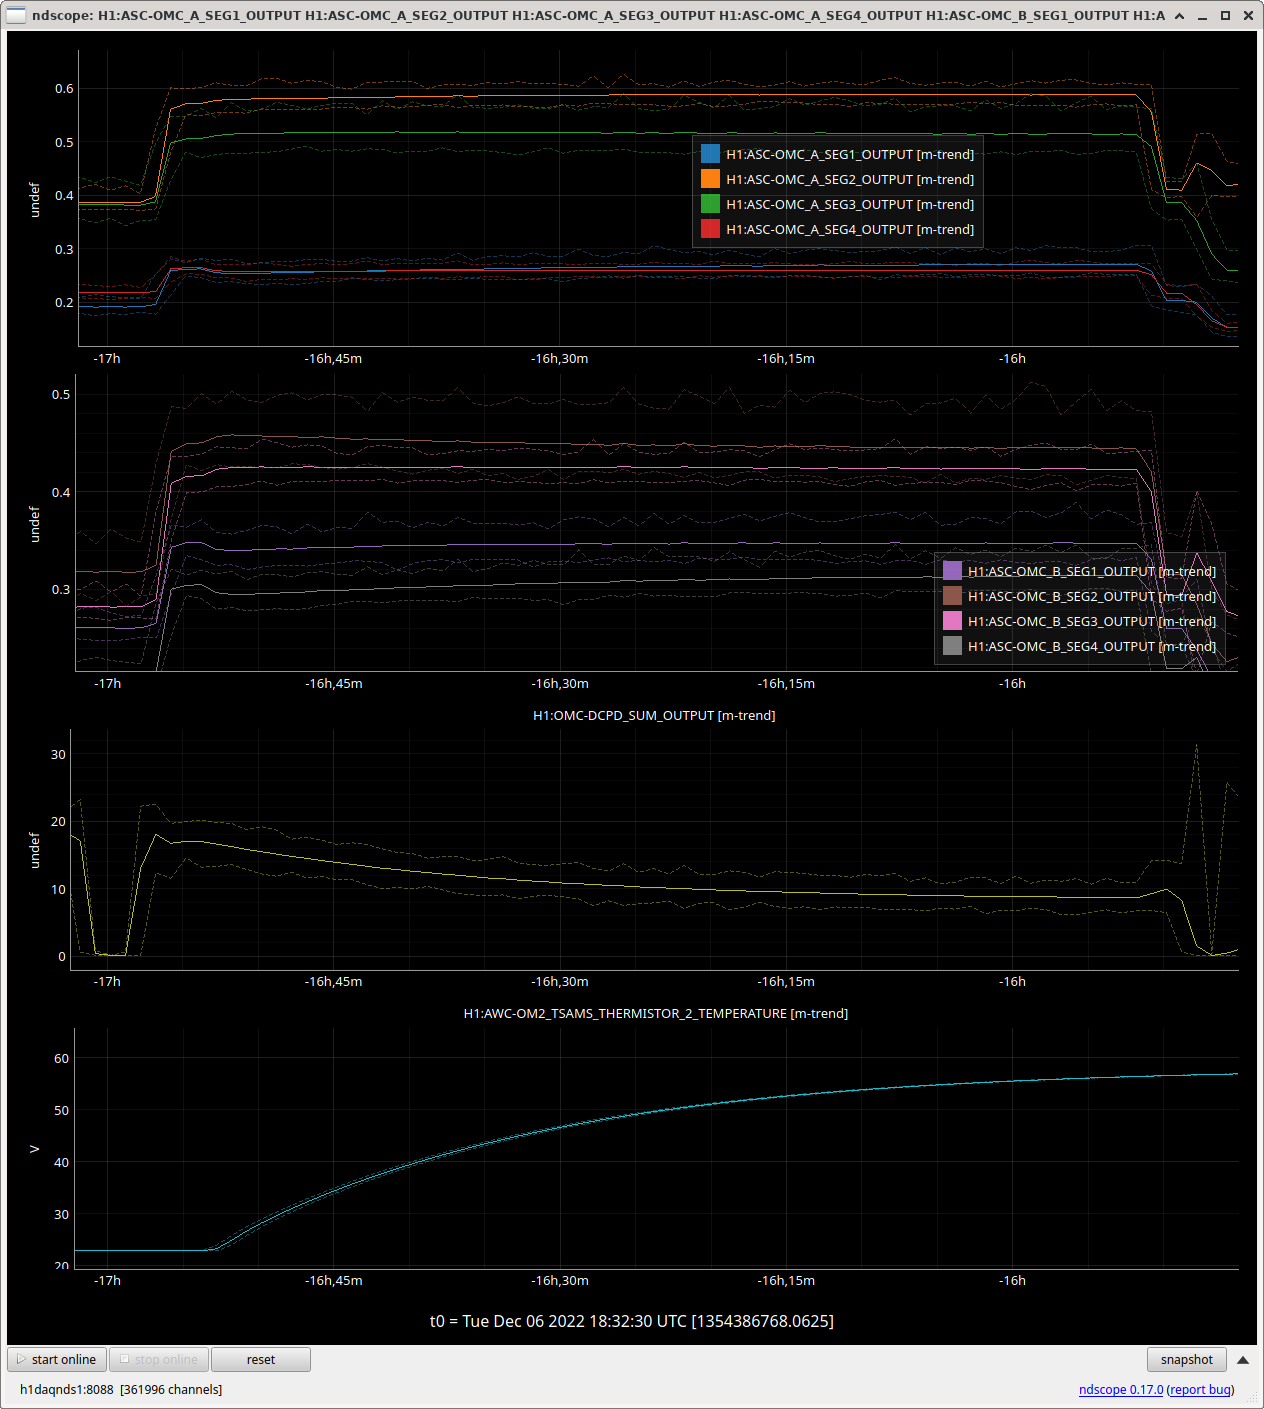
As the OMC ASC was off for a part of the TSAMs cool down we can see how much the TSAMs is moving the spot positions on the OMC QPDs. The first is when the ASC was OFF and TSAMs heating up. The second is when the TSAMs is cooling back down . The steps in the offset are when the ASC switched on, so the drift from switching TSAMs on isn't huge.

Jennie, Craig

Craig and I ran his code at https://git.ligo.org/aligo_commissioning/labutils/-/tree/master/omc_scan/OMCscan.py on these OMC scans and obtained estimates for the modes as shown in the three image files.

For the measurement starting at GPS 1354330055 we used 80s of data, the measurement starting at GPS 1354330325 we used 83s, and for the one starting at 1354331302 we used 93s of data.

Using the "hot TSAMs" OMC scans from above, we compared the first scan to the second and third ones, respectively, as well as an old scan from April 28. Plots: 1) first and second scan comparison 2) first and third scan comparison 3) first scan to April 28, 2022 comparison (with no TSAMs installed)Plot 1Here the difference is only the DARM offset was doubled between blue and red. We clearly see that doubling the DARM offset massively increased the carrier 00 content. c_20 content was also increased in kind. This trend did not extend to c_10, or any other carrier higher order mode. The sideband modes remained around the same as well. The 9+_20 sideband is extremely high, as we saw in alog 62694 from April 2022.Plot 2Here the difference is the DARM offset is doubled and the 45 MHz was doubled between blue and red. The 45 MHz is twice as high as expected. For some reason, the c_00 is significantly down, even with the doubled DARM offset? However, the c_10 and c_20 are around the same for both. Are we sure that the DARM offset was really doubled here? If so, why is c_00 lower while c_10 and c_20 are the same? Is the 45 MHz taking away the power in the c_00 modePlot 3Here the difference is the TSAMs was installed and hot, versus no TSAMs installed and some C02s applied to the ITMs in April 2022. Overall things are largely the same. First we see that the 9+_20 is much lower here, since the C02s help repair that mode (as seen in this plot). c_20 is also slightly better (and c_60 is much better for some reason?)

Using Craig's code at https://git.ligo.org/aligo_commissioning/labutils/-/tree/master/omc_scan/fit_two_peaks.py I fitted Lorentzians to the C02 and C20 peaks from the three OMC scans.
1st GPS 1354330055 TSAMS hot, smaller DARM offset and lower 45 mod depth. See first graph attached. The mode spacing between horizontal and vertical is 0.587MHz.
2nd GPS 1354330325 TSAMS hot, doubled DARM offset and lower 45 mod depth. See second graph attached. The mode spacing between horizontal and vertical is 0.491 MHz.
3rd GPS 1354331302 TSAMS hot, doubled DARM and higher 45 mod depth. See third graph attached. The mode spacing between horizontal and vertical is 0.588 MHz.
These are all close to the expected separation from measurements of the OMC, see LHO aLOG #65546.
There seems to be some excess power in the C02 peaks, possibly from other nearby modes, further analysis ongoing.
The 3rd scan taken by Dan reported here actually has a lower DARM offset (H1:LSC-DARM1_OFFSET = 1.5e-5), same as the 1st scan. The 2nd scan does have a higher DARM offset (3.0e-5). This partially explains the carrier 00 levels seen in the 3rd scan vs 2nd scan. I wrote a quick script,thermal_state_capture.py, which takes in a GPS time and displays some common useful parameters we want to know about the thermal state of the interferometer, including:1. Ring heater settings 2. CO2 settings 3. SR3 disk heater setting 4. Input laser power / PRG 5. TSAMs setting 6. Modulation depths for 9 and 45 MHz 7. DARM offset 8. DCPD light levelCode is here: https://git.ligo.org/aligo_commissioning/labutils/-/tree/master/thermal_state_capture