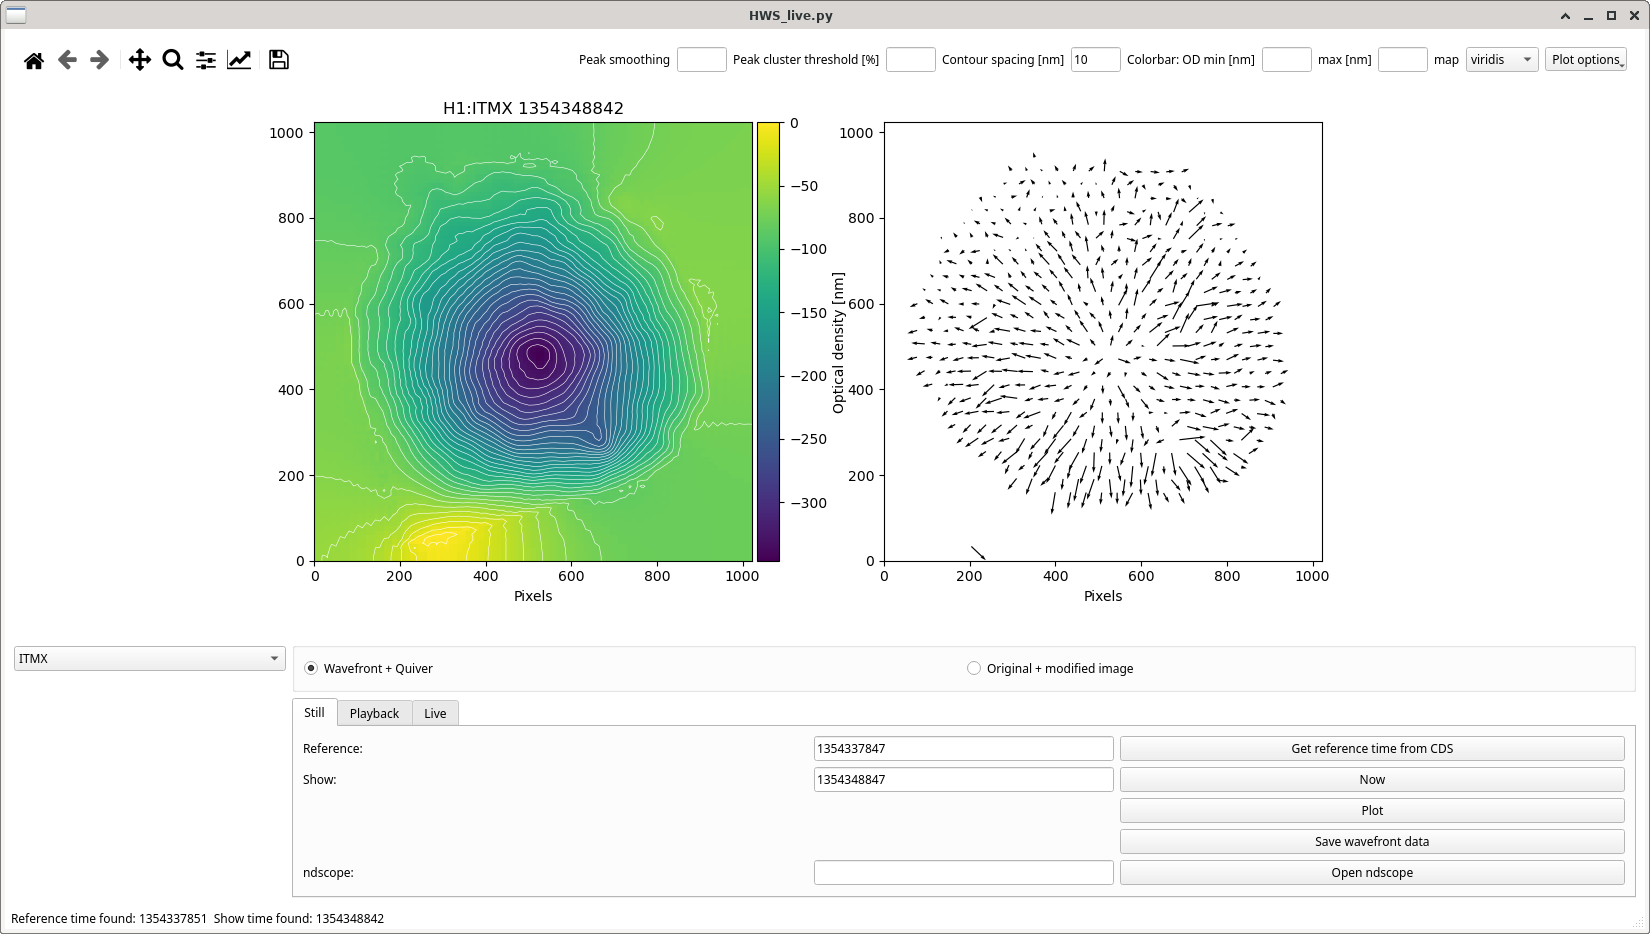
There was some confusion in the commissioning meeting yesterday about how many point absorbers are likely on ITMX (ITM07). Last night we had a reasonably long 50W lock on RF where I also had the CO2s off on both X and Y so the power up and cooldown are all due to the IFO beam heating.
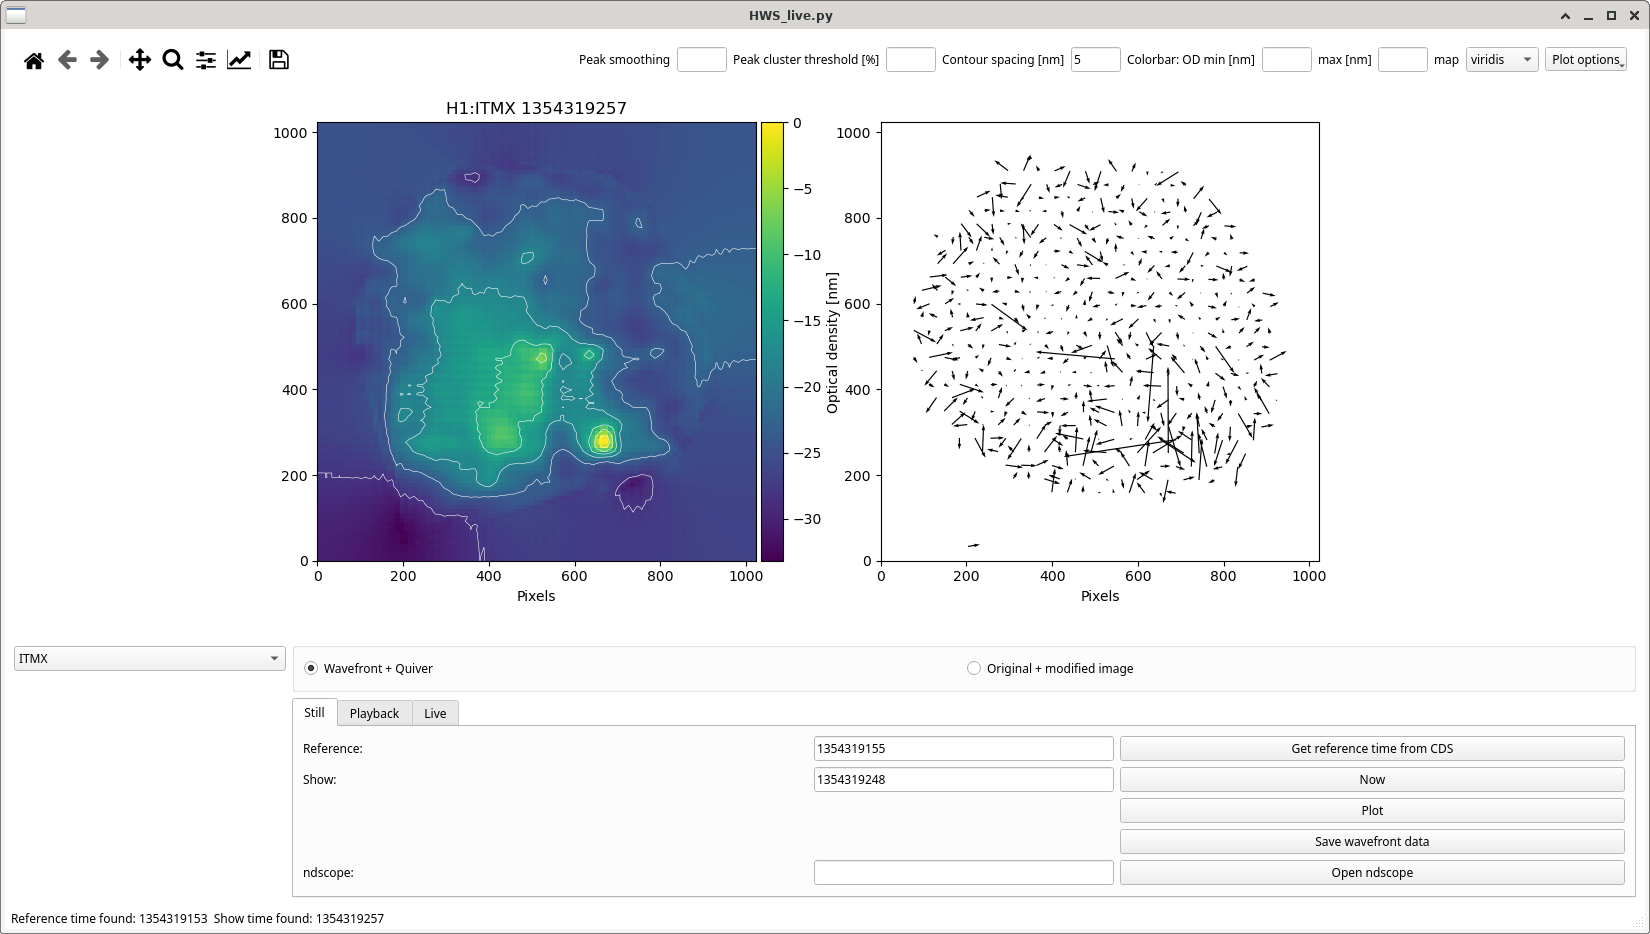
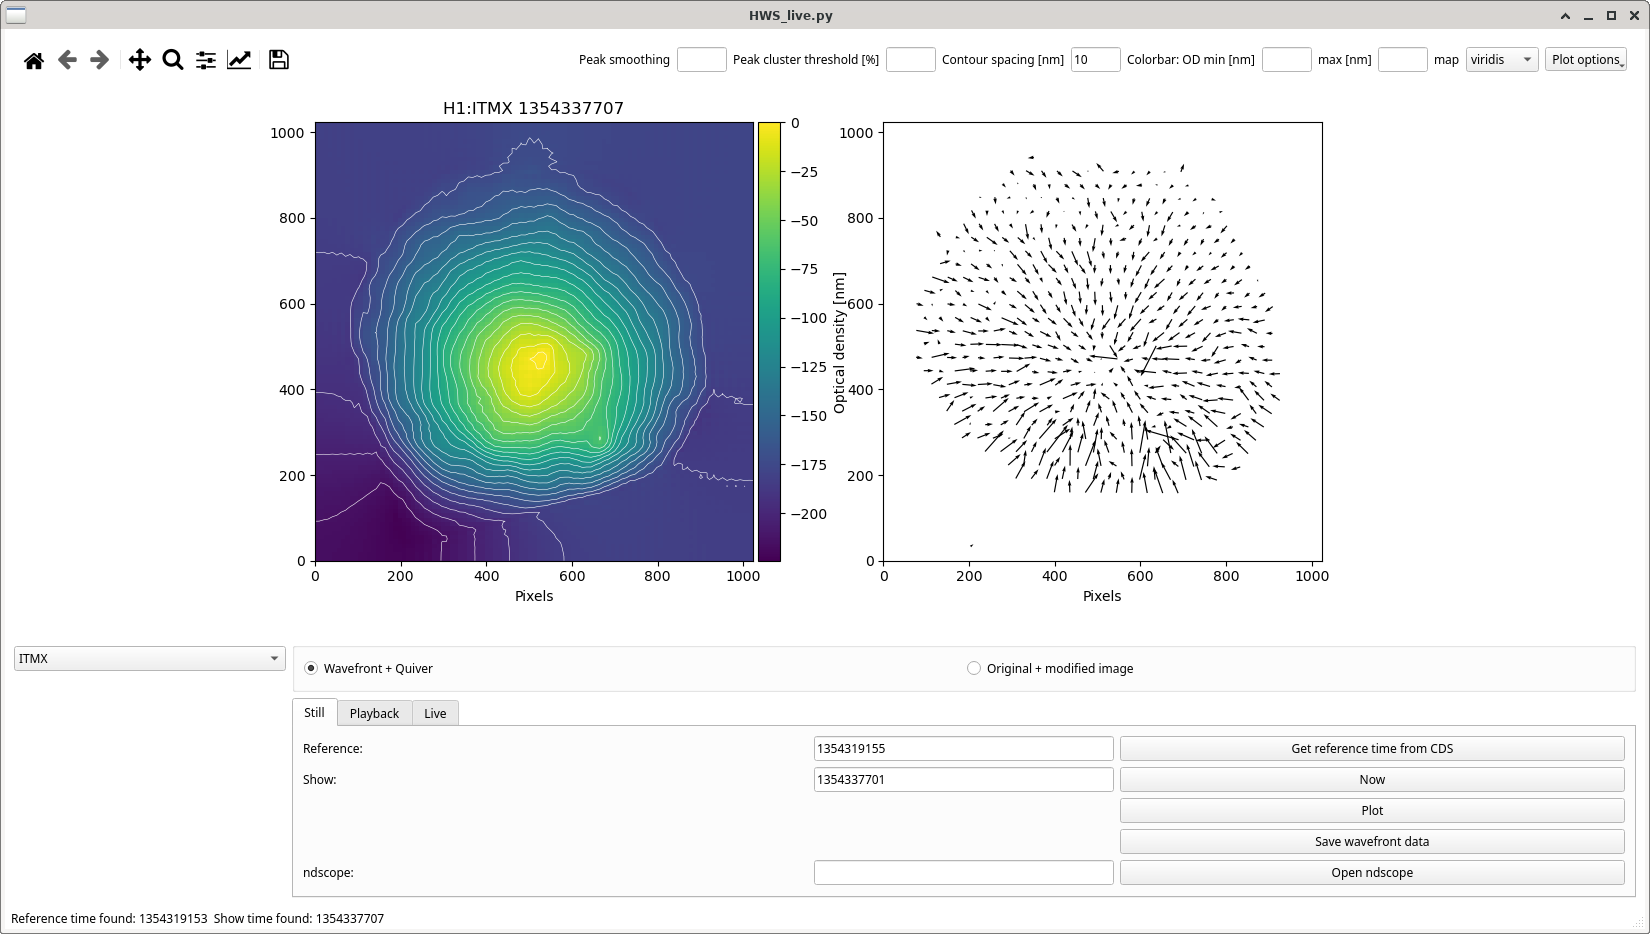
I look at two cases, the short time scale to see where a point absorber is heating up more quickly and a long term one (many hours) to see if something is still there. This is all qualtative, there are people doing more indepth analysis that may pickup some other weaker ones, but these to me look reasonably obvious. This is looking at power up, similar features can also be seen in the cooldown.
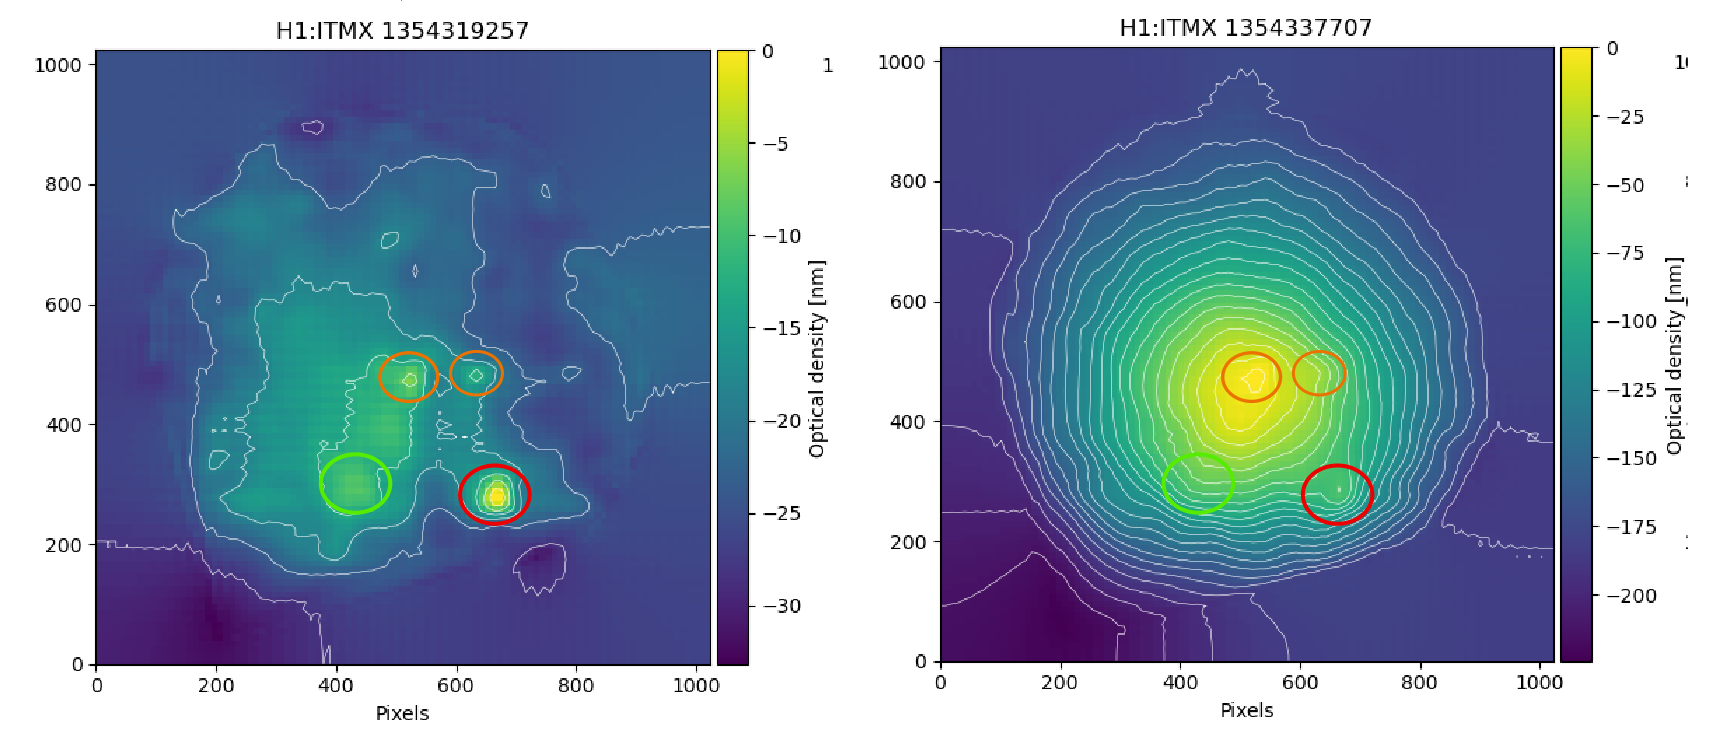
The red one is particularly strong given how much deformation there is far from the beam centre. The two orange ones are near the centre of the beam, whether there is definitely two or just one I'm not sure, a bit hard to pick out if it's the IFO beam heating we are seeing there. Green is a bit weaker and further out. The ITMX HWS are much better than O3 when we had significant clipping, the IR filter has also recently been replaced since post-O3 which helps pick these out. When we do some spot moves at higher power that will help verify which of these are real or not - especially features that may look like absorbers that are further away where clipping may still be an issue.
- Power up
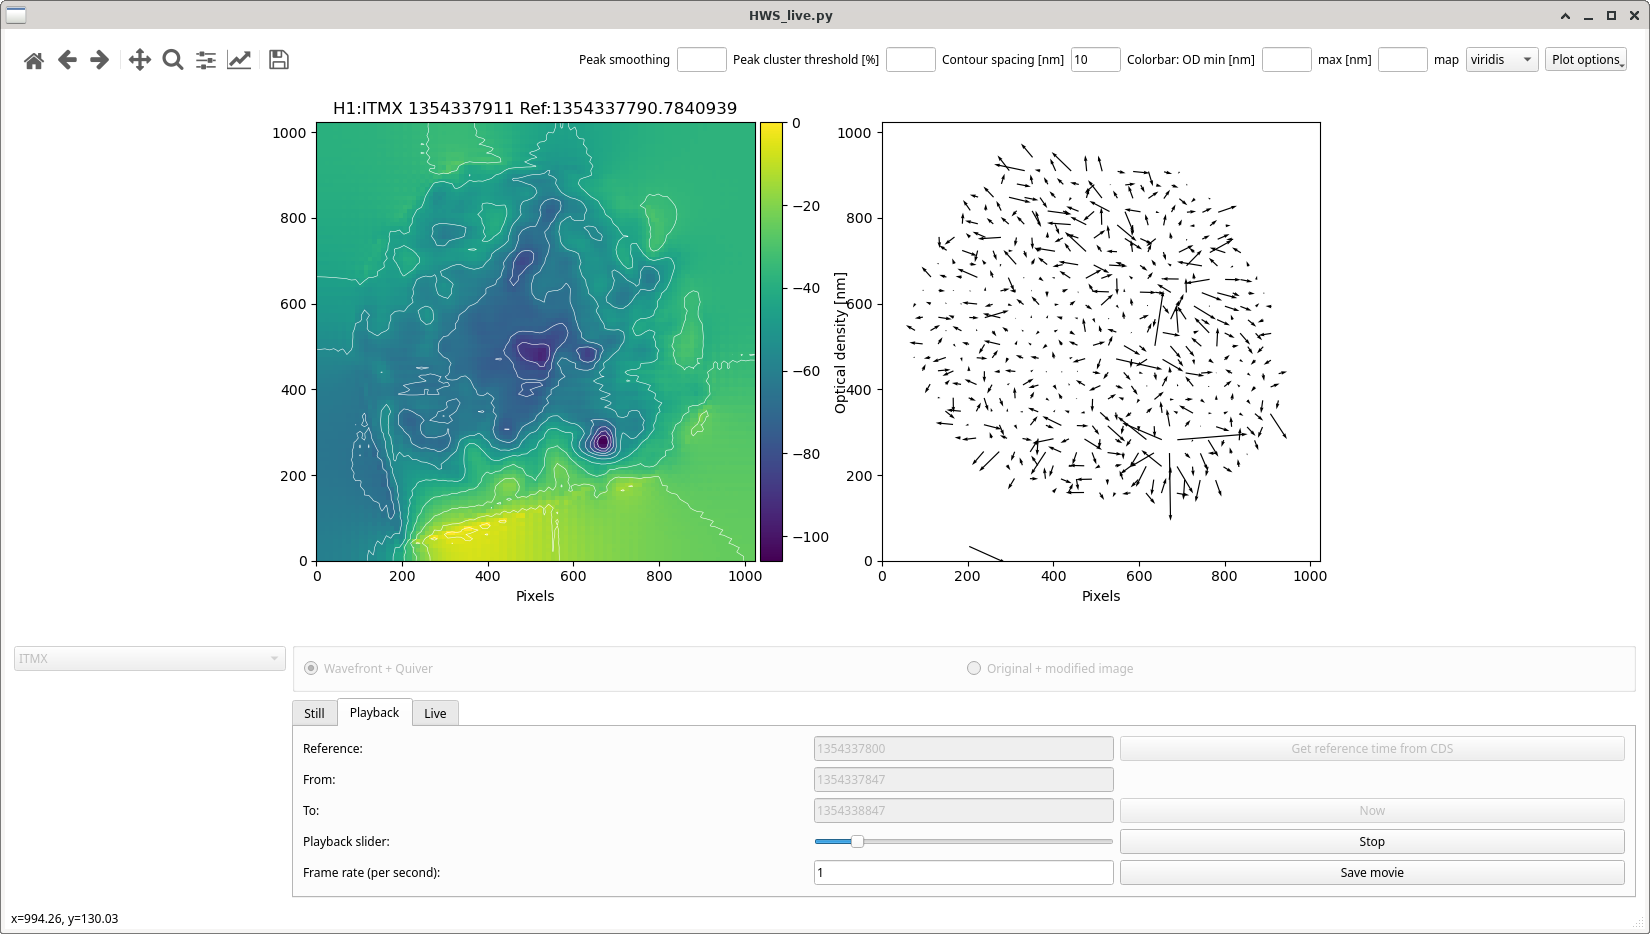
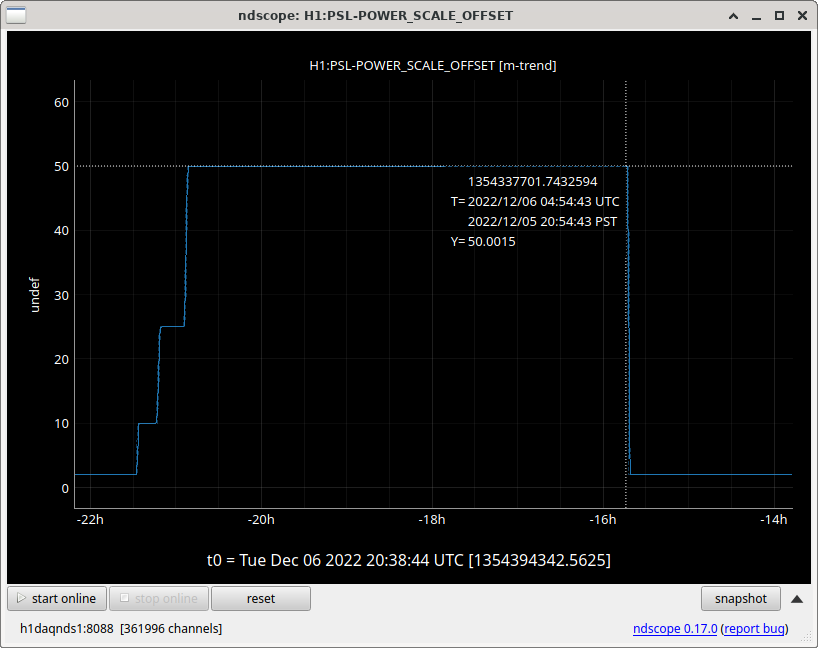
- Going from 25->50W after the spot move (because moving the beam around makes the HWS images more noisy relative to the "cold" references we take)
- Going from 25->lockloss many hours later
- Power up
For reference, here are some earlier measurements for possible point absorbers on ITMX.
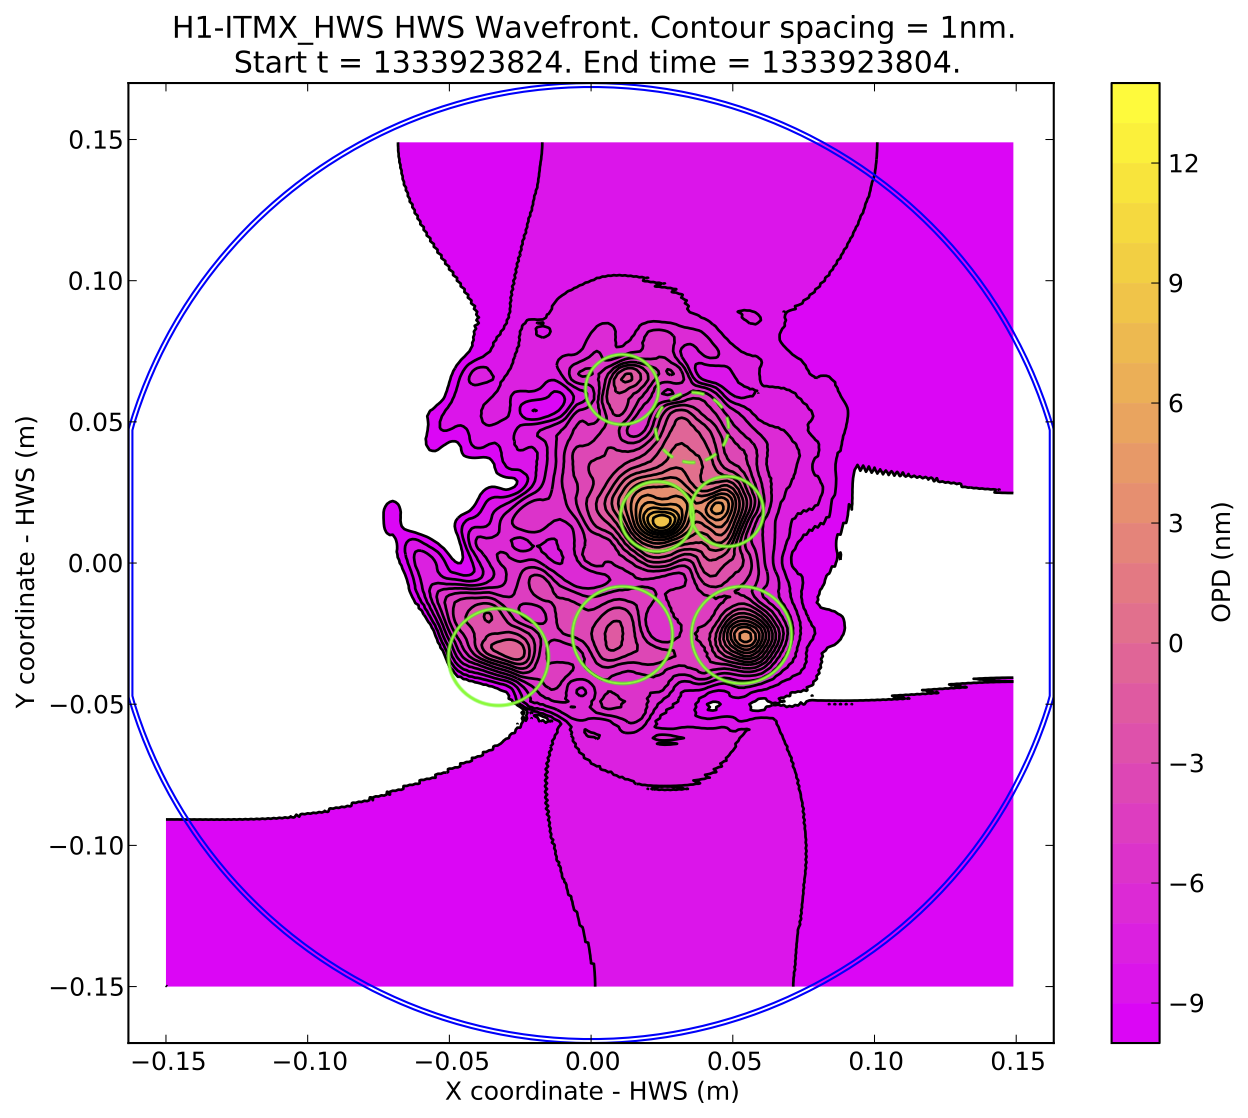
The same 4 point absorbers that Dan identified are in the older measurement. There are 3 other plausible absorbers there. These are all highlighted in a qualitative way
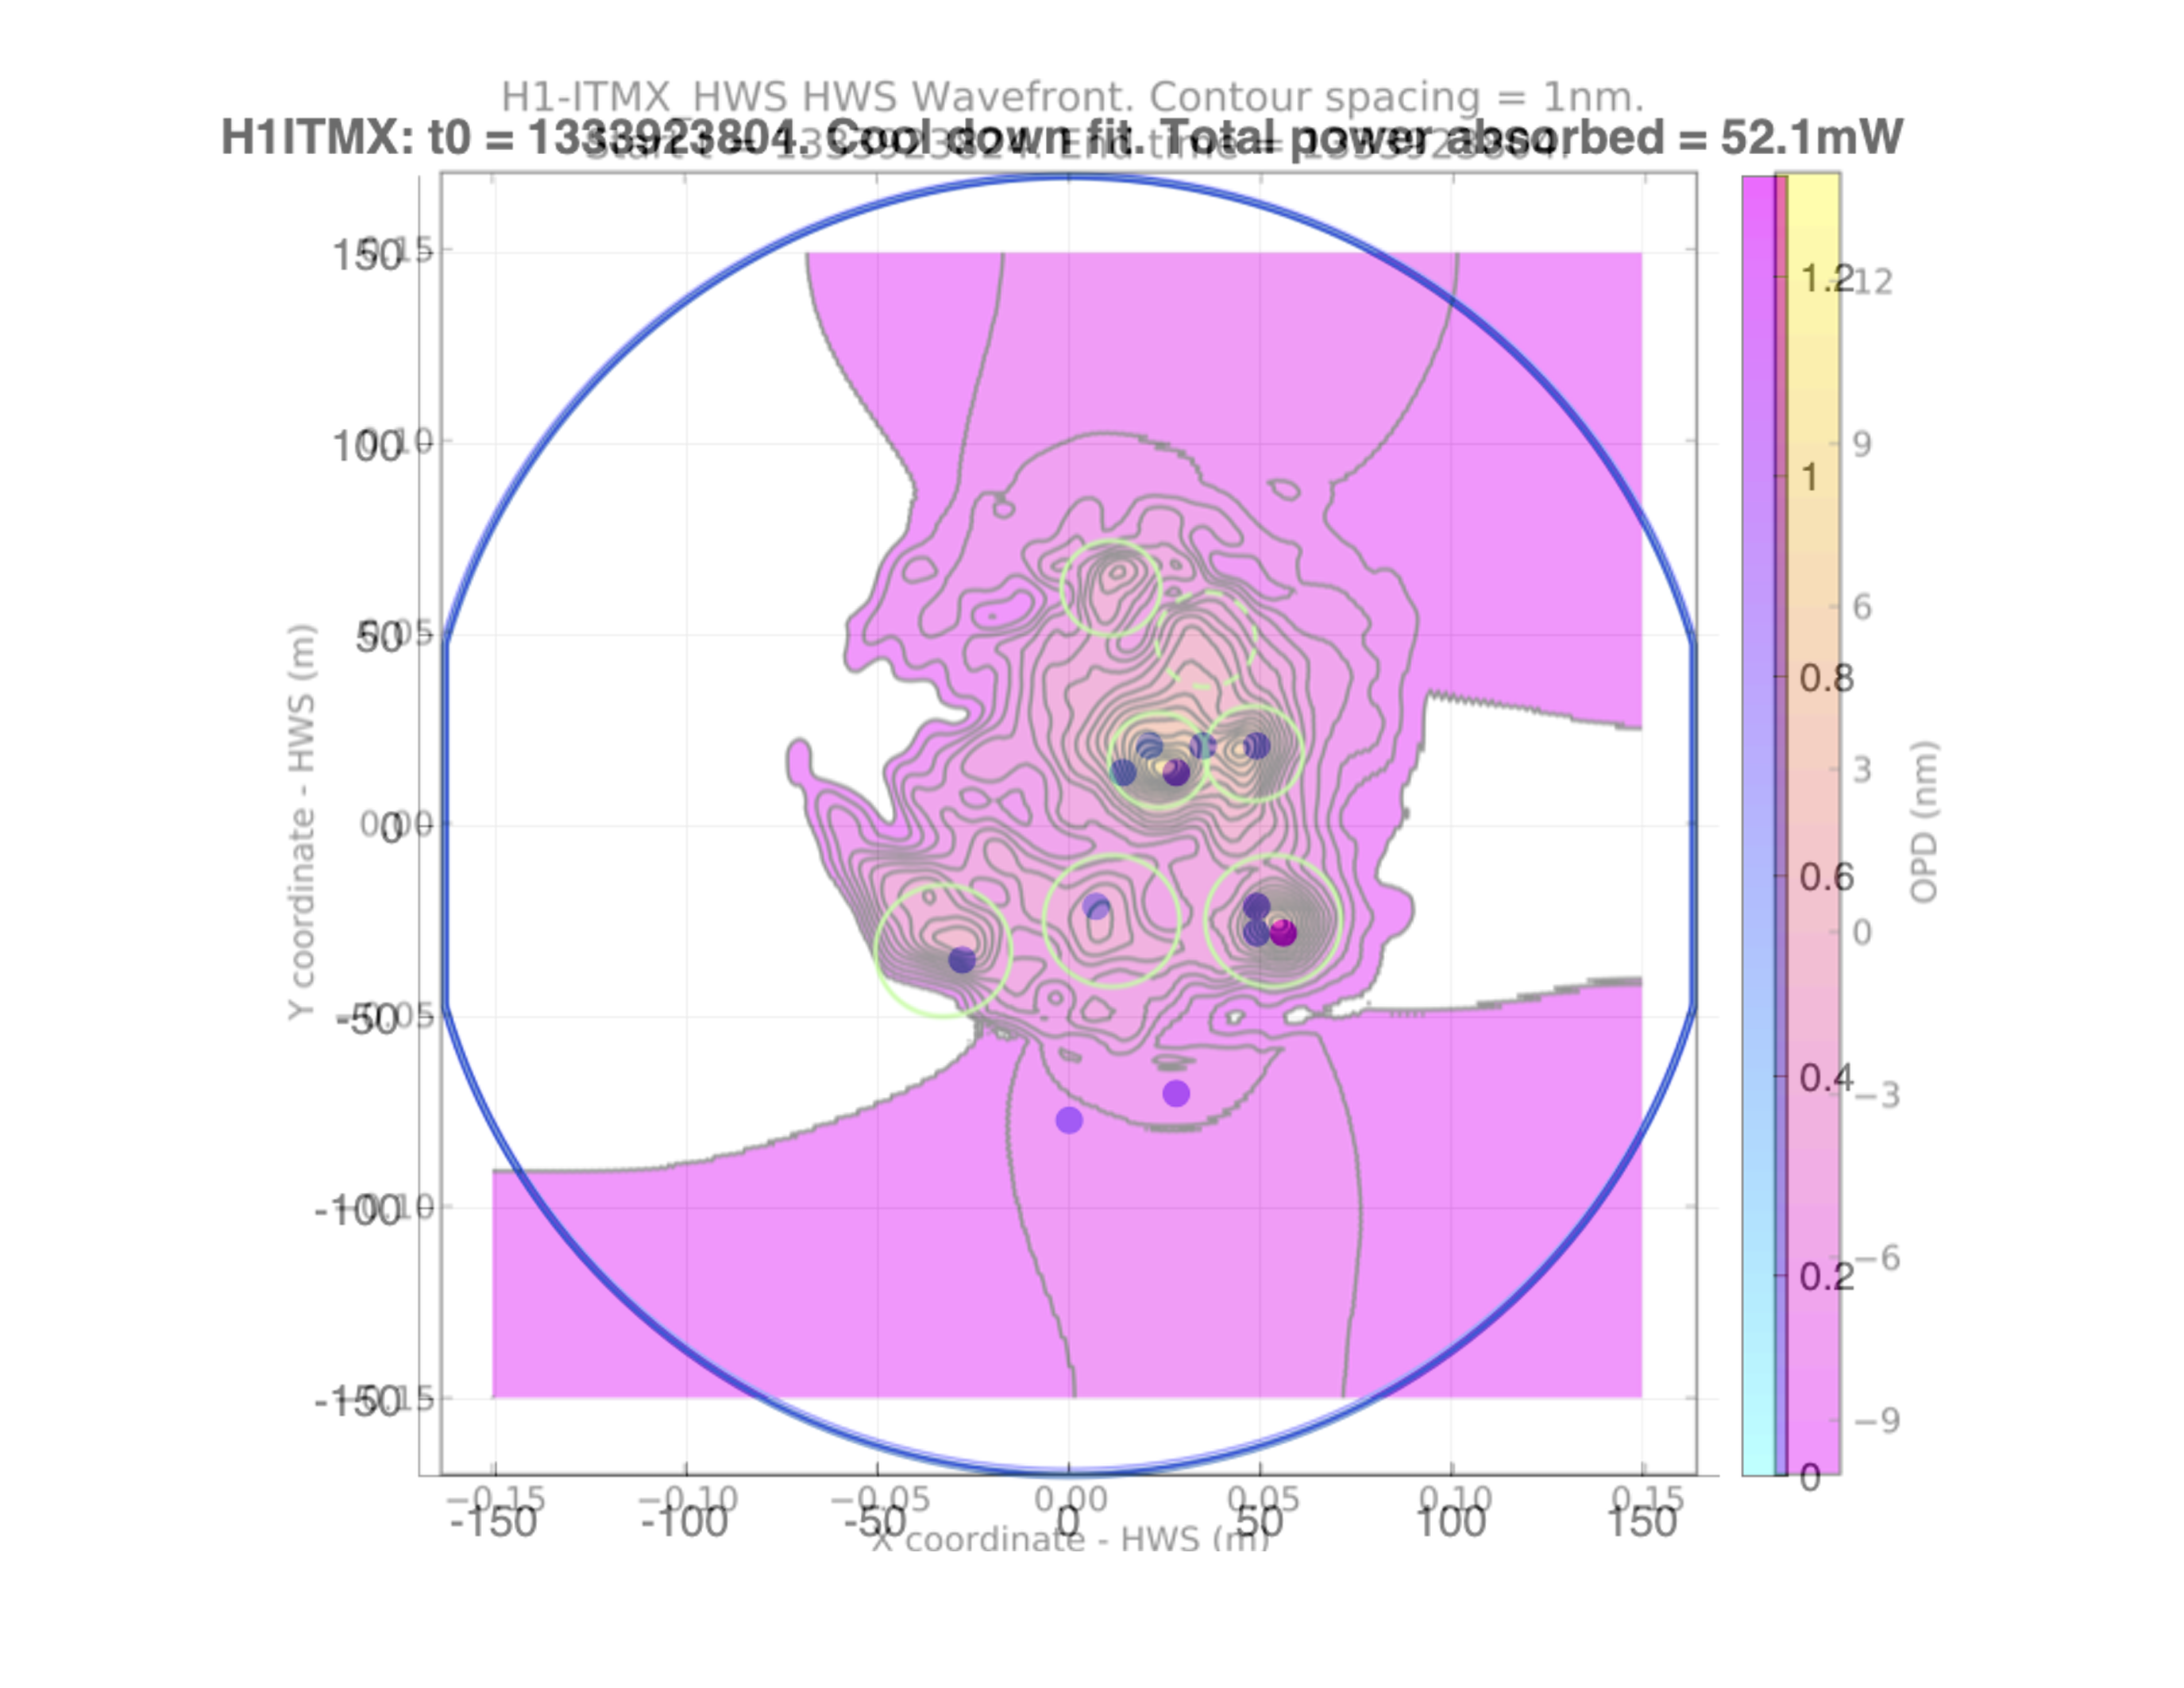
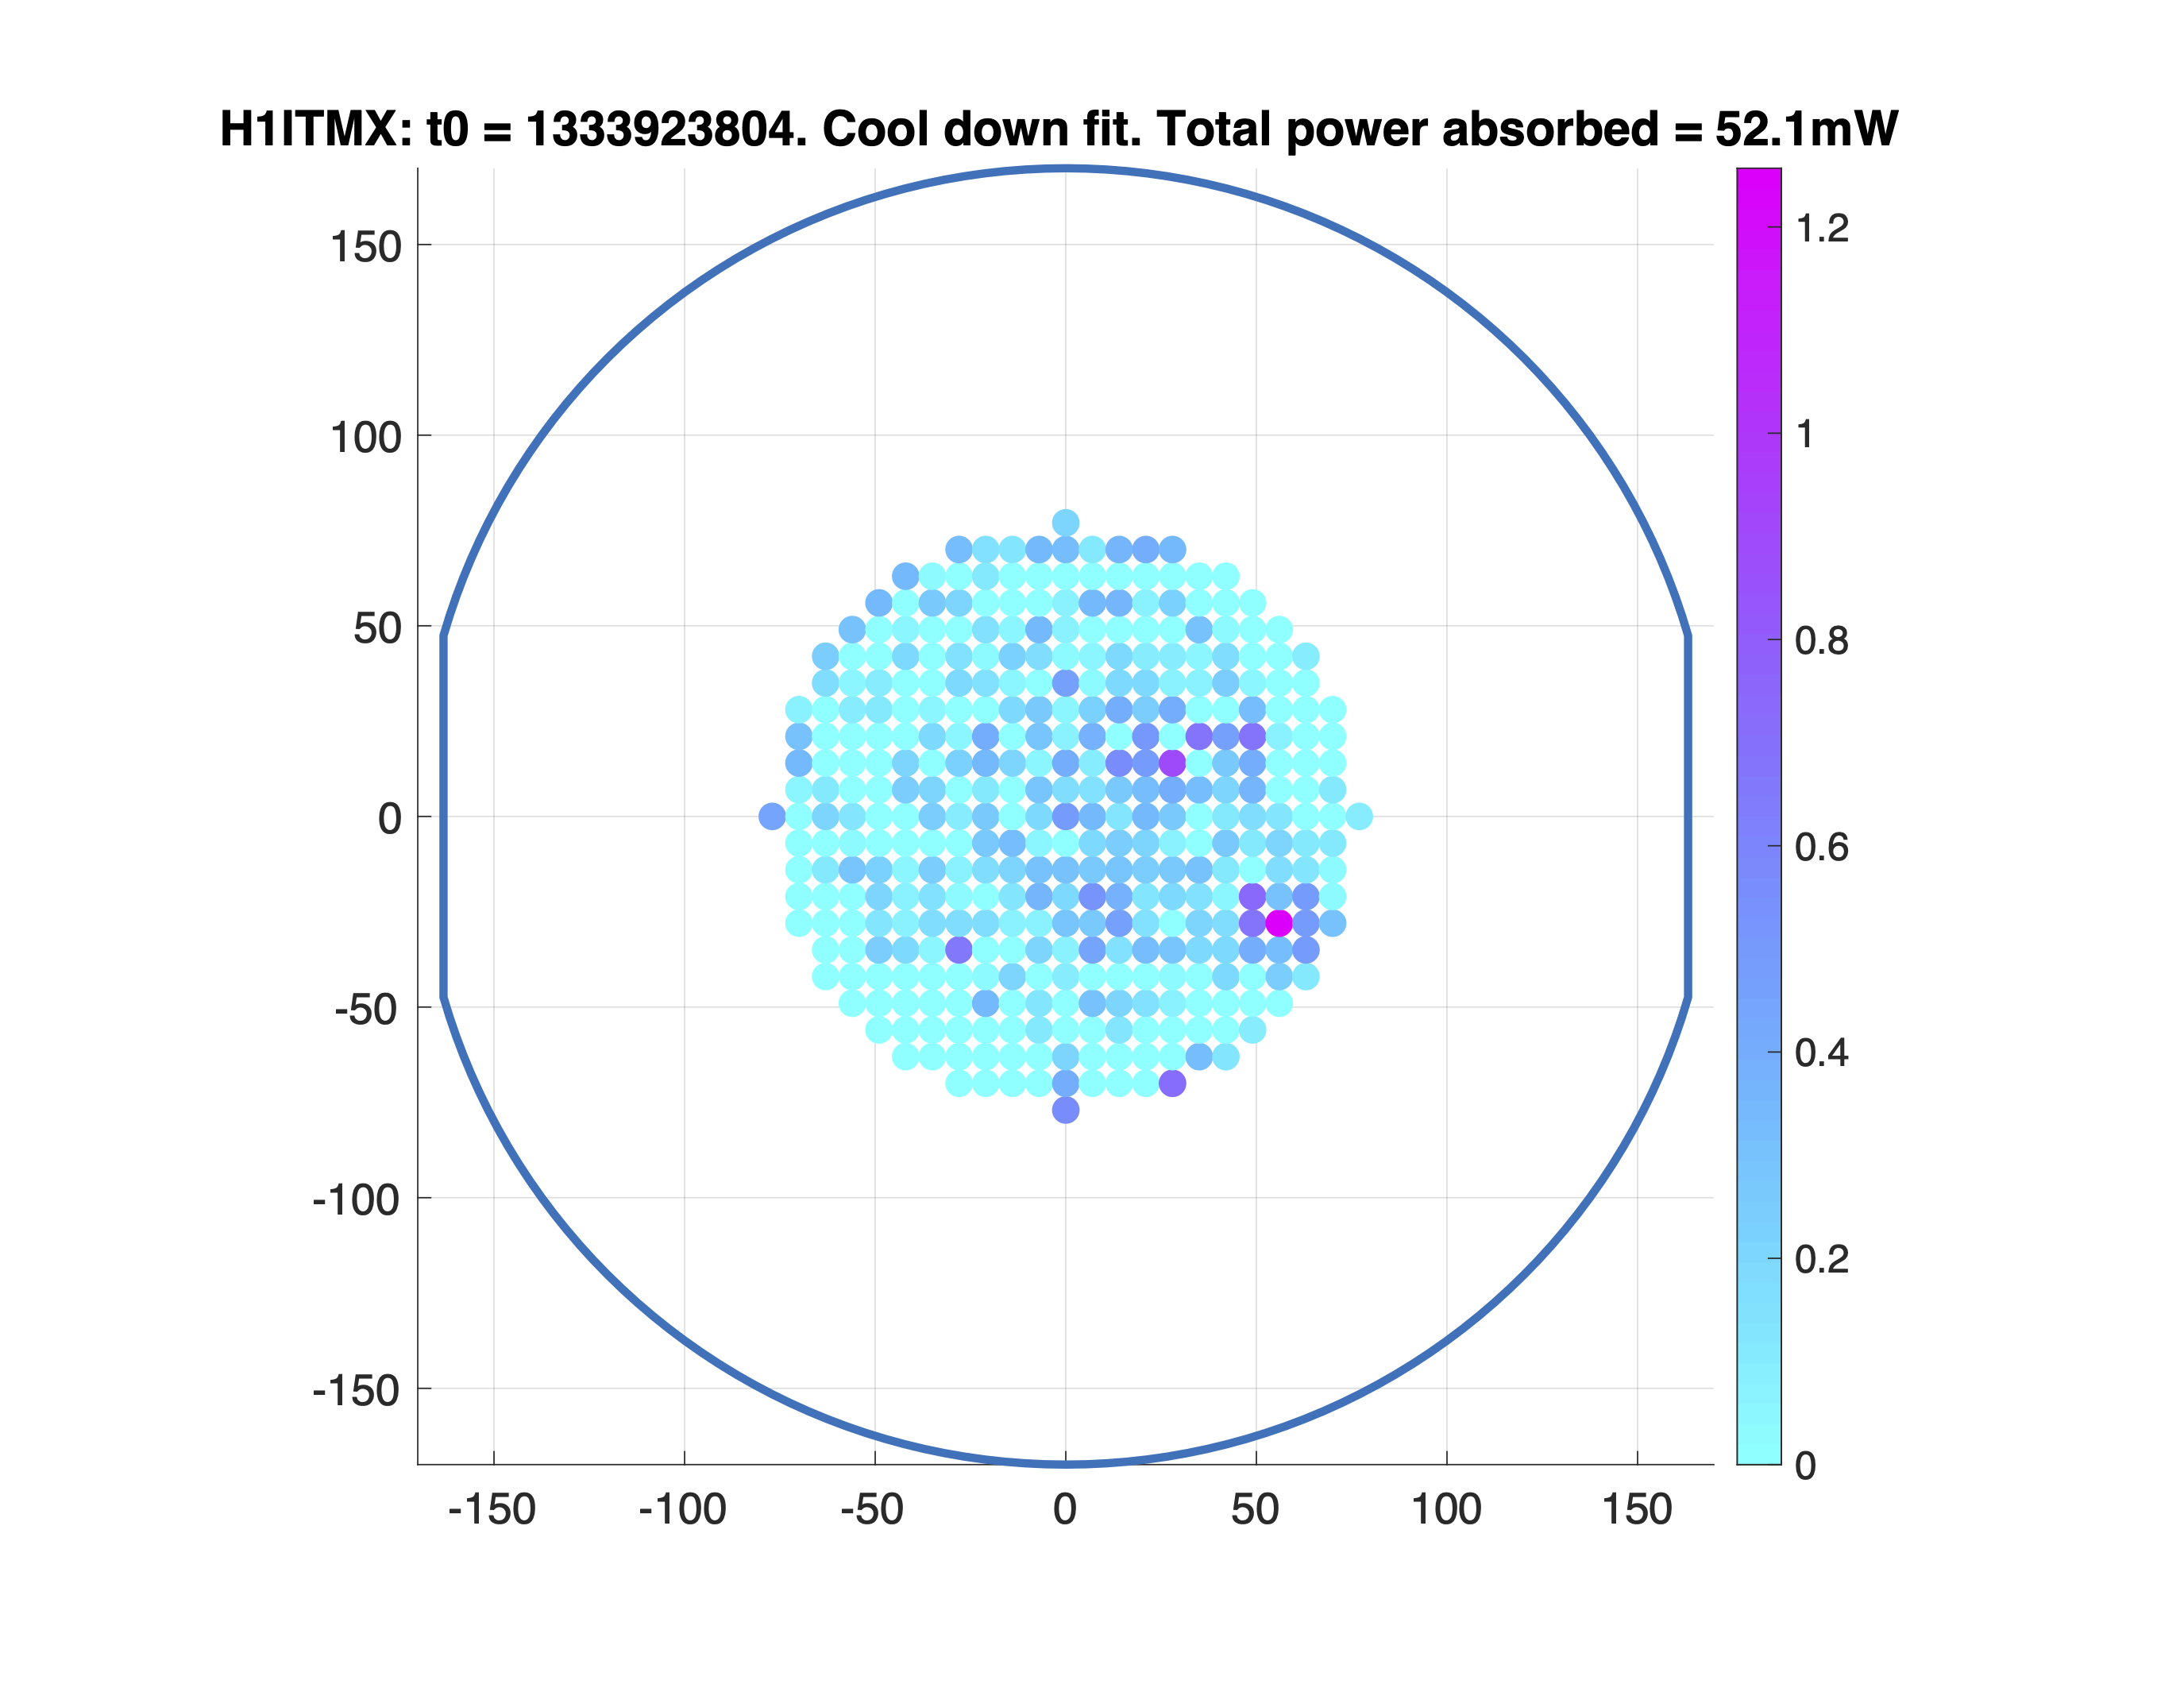
A brute force fit for the absorption map on ITMX (from the above measurement in O3).
The brute force fit map. The color bar is absolute absorbed power in units of mW
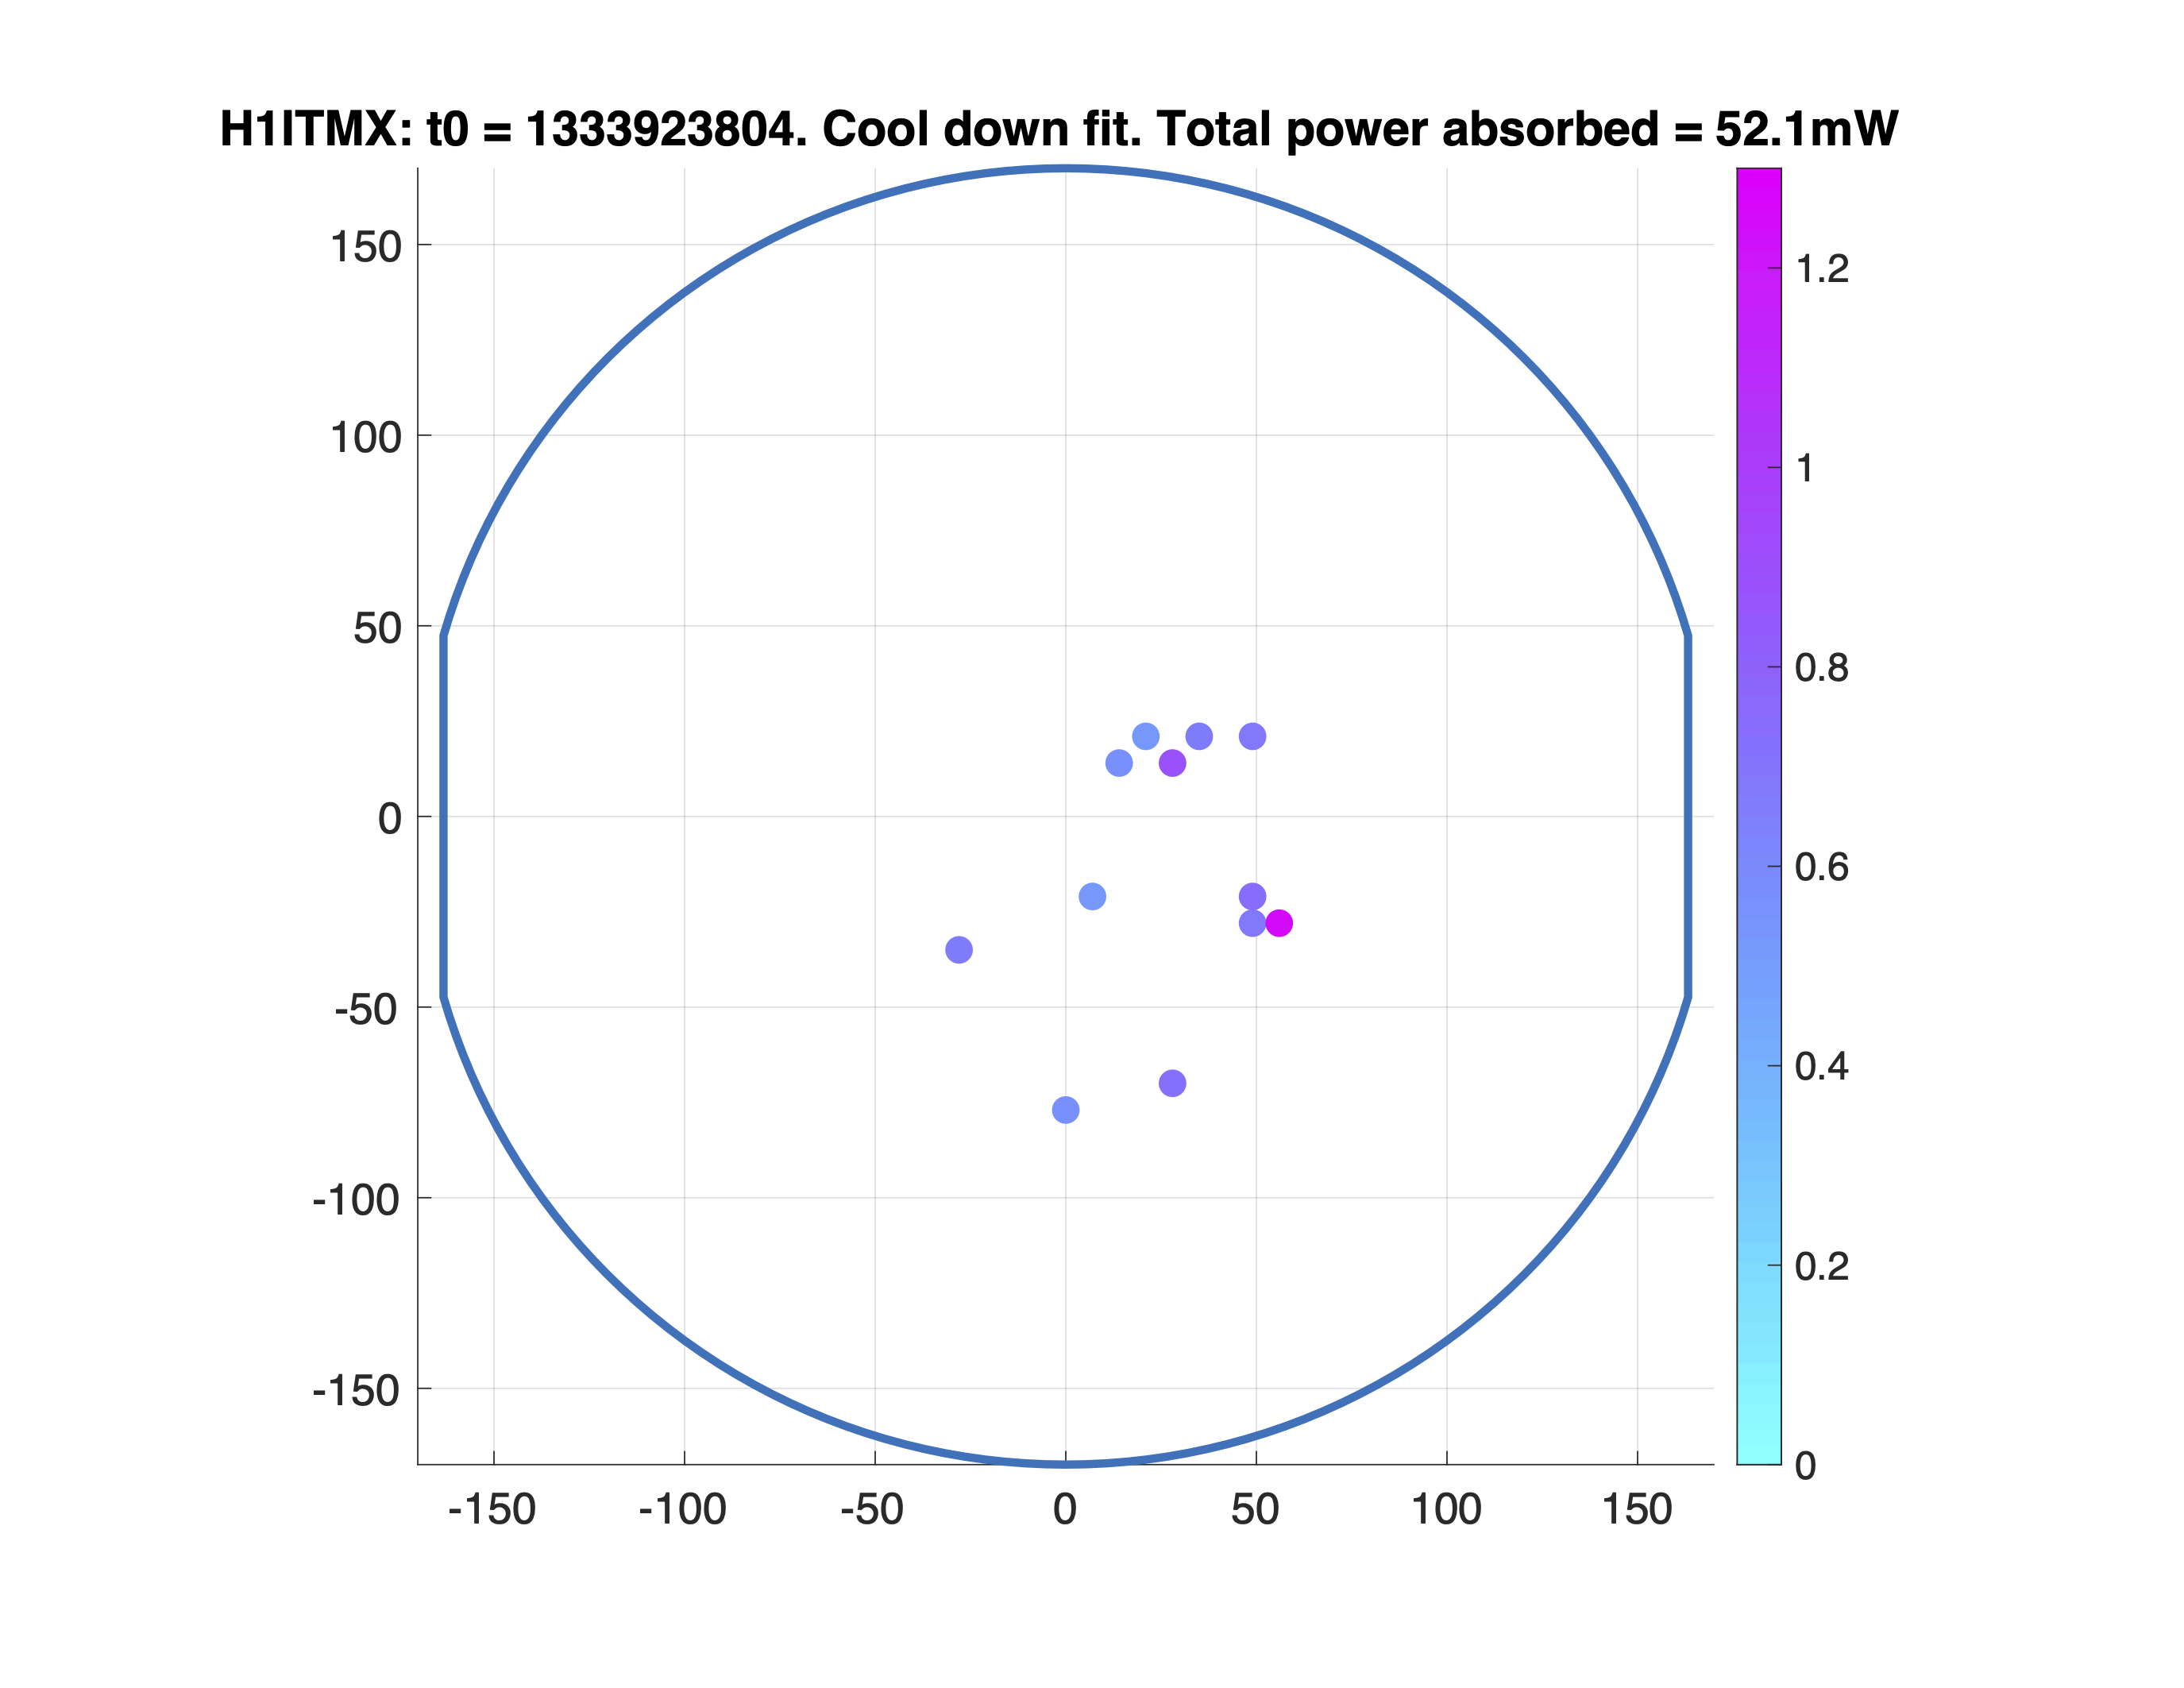
The high points in the map that are greater than 0.5mW absorbed power
The overlap of the high points and the wavefront measurement