Last week, I tried to evaluate the best configuration to use the sensor correction (HEPI vs ISI) and the influence of the ISI stage 1 blend frequency (CPS-T240-L4C) on the isolation once the sensor correction is engaged on the ISI.
The stage 1 motion was measured in different control configurations:
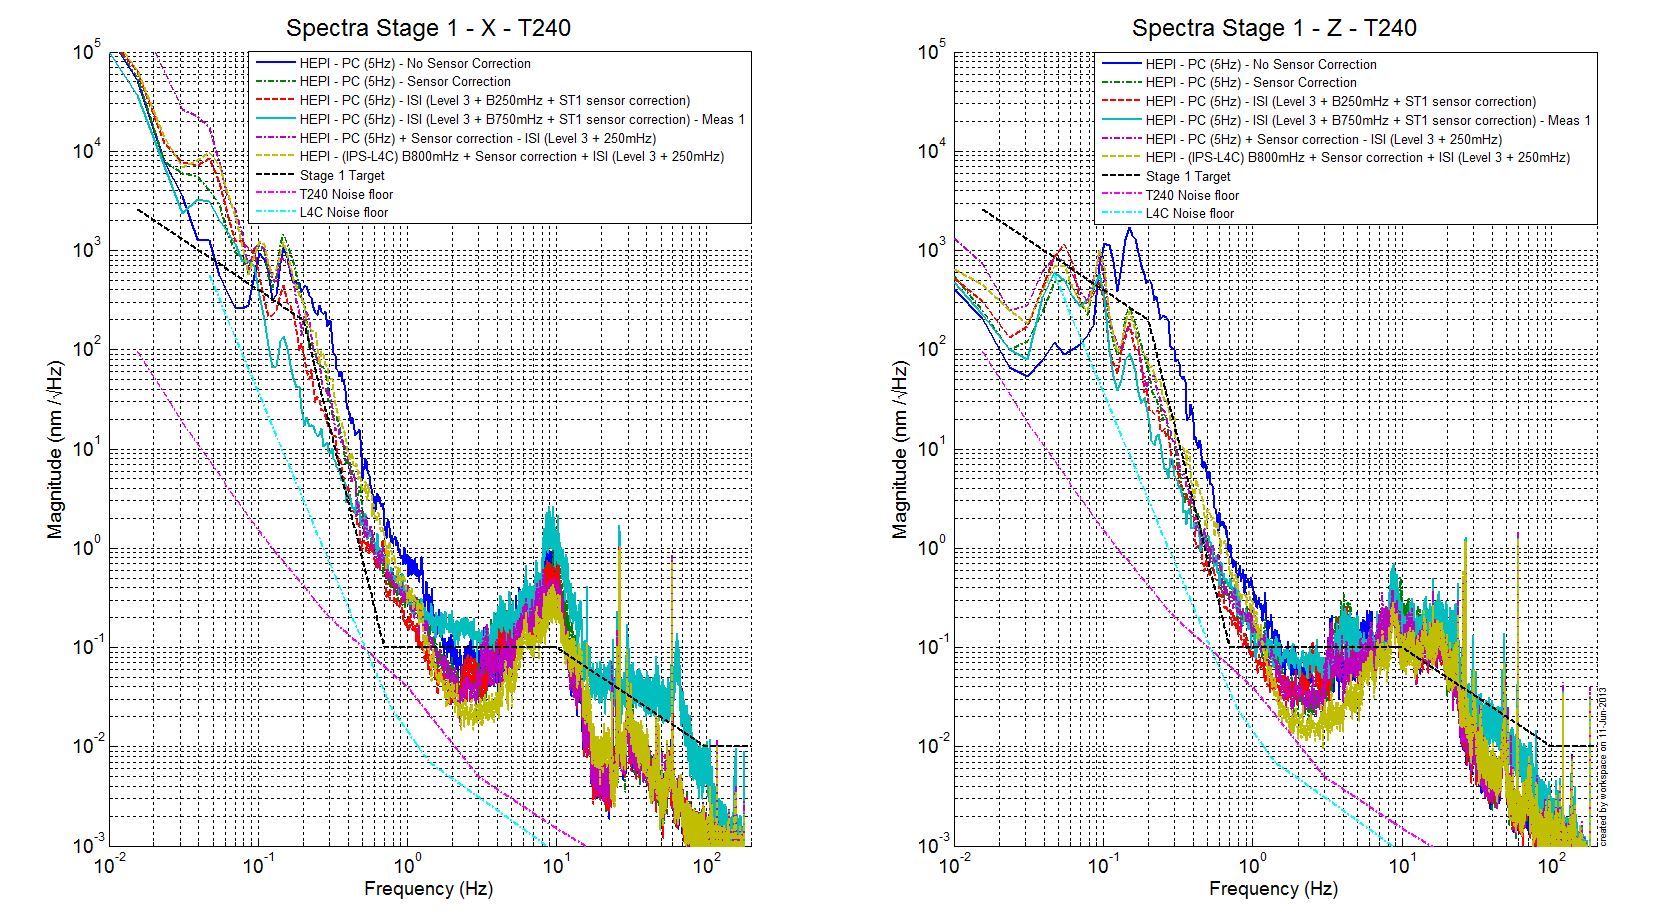
- HEPI controlled in position (UGF 5Hz), ISI – Isolation Level 3 (40Hz UGF on stage 1 – 15Hz on stage 2) – Blend 250mHz (with T240s in stage 1 super sensors)
- HEPI controlled in position (UGF 5Hz) with sensor correction from STS-2 to HEPI, ISI – Isolation Level 3 (40Hz UGF on stage 1 – 15Hz on stage 2) – Blend 250mHz (with T240s)
- HEPI controlled in position (UGF 5Hz), ISI – Isolation Level 3 (40Hz UGF on stage 1 – 15Hz on stage 2) – Blend 250mHz (with T240s) and sensor correction from STS-2 to Stage 1
- HEPI controlled in position (UGF 5Hz), ISI – Isolation Level 3 (40Hz UGF on stage 1 – 15Hz on stage 2) – Blend 750mHz (with T240s) and sensor correction from STS-2 to Stage 1
- HEPI controlled in position (UGF 5Hz) with sensor correction from STS-2 to HEPI, ISI – Isolation Level 3 (40Hz UGF on stage 1 – 15Hz on stage 2) – Blend 750mHz (with T240s)
- HEPI with IPS-L4C blend (UGF 10Hz) with sensor correction from STS-2 to HEPI, ISI – Isolation Level 3 (40Hz UGF on stage 1 – 15Hz on stage 2) – Blend 250mHz (with T240s)
Below 100mHz
- The amplification at low frequency seems to be more important when the sensor correction is implemented on HEPI (probably due to the tilt - twist of the HEPI structure). The effect is more visible in the horizontal directions.
red & cyan (Sensor correction on the stage 1 ISI) vs purple & gold (Sensor correction on the HEPI)
- With the sensor correction implemented on the ISI, the amplification seems to be lower when the blend frequency (CPS-T240) is higher
cyan (750mHz blend) vs red (250mHz blend)
[100mHz;2Hz]
- When the T240s and the CPSs are blended at 250mHz, sensor correction implemented in HEPI or ISI performs similarly (with SC on the ISI, isolation seems slightly better)
red (SC on the ISI) vs purple (SC on the HEPI)
- The SC performs better when the blend frequency (CPS-T240) is increased at 750mHz. Are we reinjecting more noise or tilt when the CPS-T240 are blended at 250mHz? The Q of the low pass filter at 750mHz also has lower than the Q of the 250mHz low pass filter. It might also explain the difference of isolation around 200mHz.
cyan (750mHz) vs red (250mHz)
- The smallest stage 1 motion is obtained when the HEPI is controlled with the IPS-L4C blend
gold
Above 2Hz
- Isolation is slightly better (at 2Hz) when the HEPI is controlled with the IPSs and the L4Cs.
gold
- When the T240s and the CPSs are blended at 750mHz, the isolation is limited due to the lack of “roll off” of the CPS low pass filters.
cyan
Regarding these results, it seems that the sensor correction works better at low frequency (below 2Hz) when it is implemented on stage 1 (vs HEPI). Further measurements need to be performed to determine the effect of the blend filters with sensor correction on the isolation.