Sheila, Dhruva
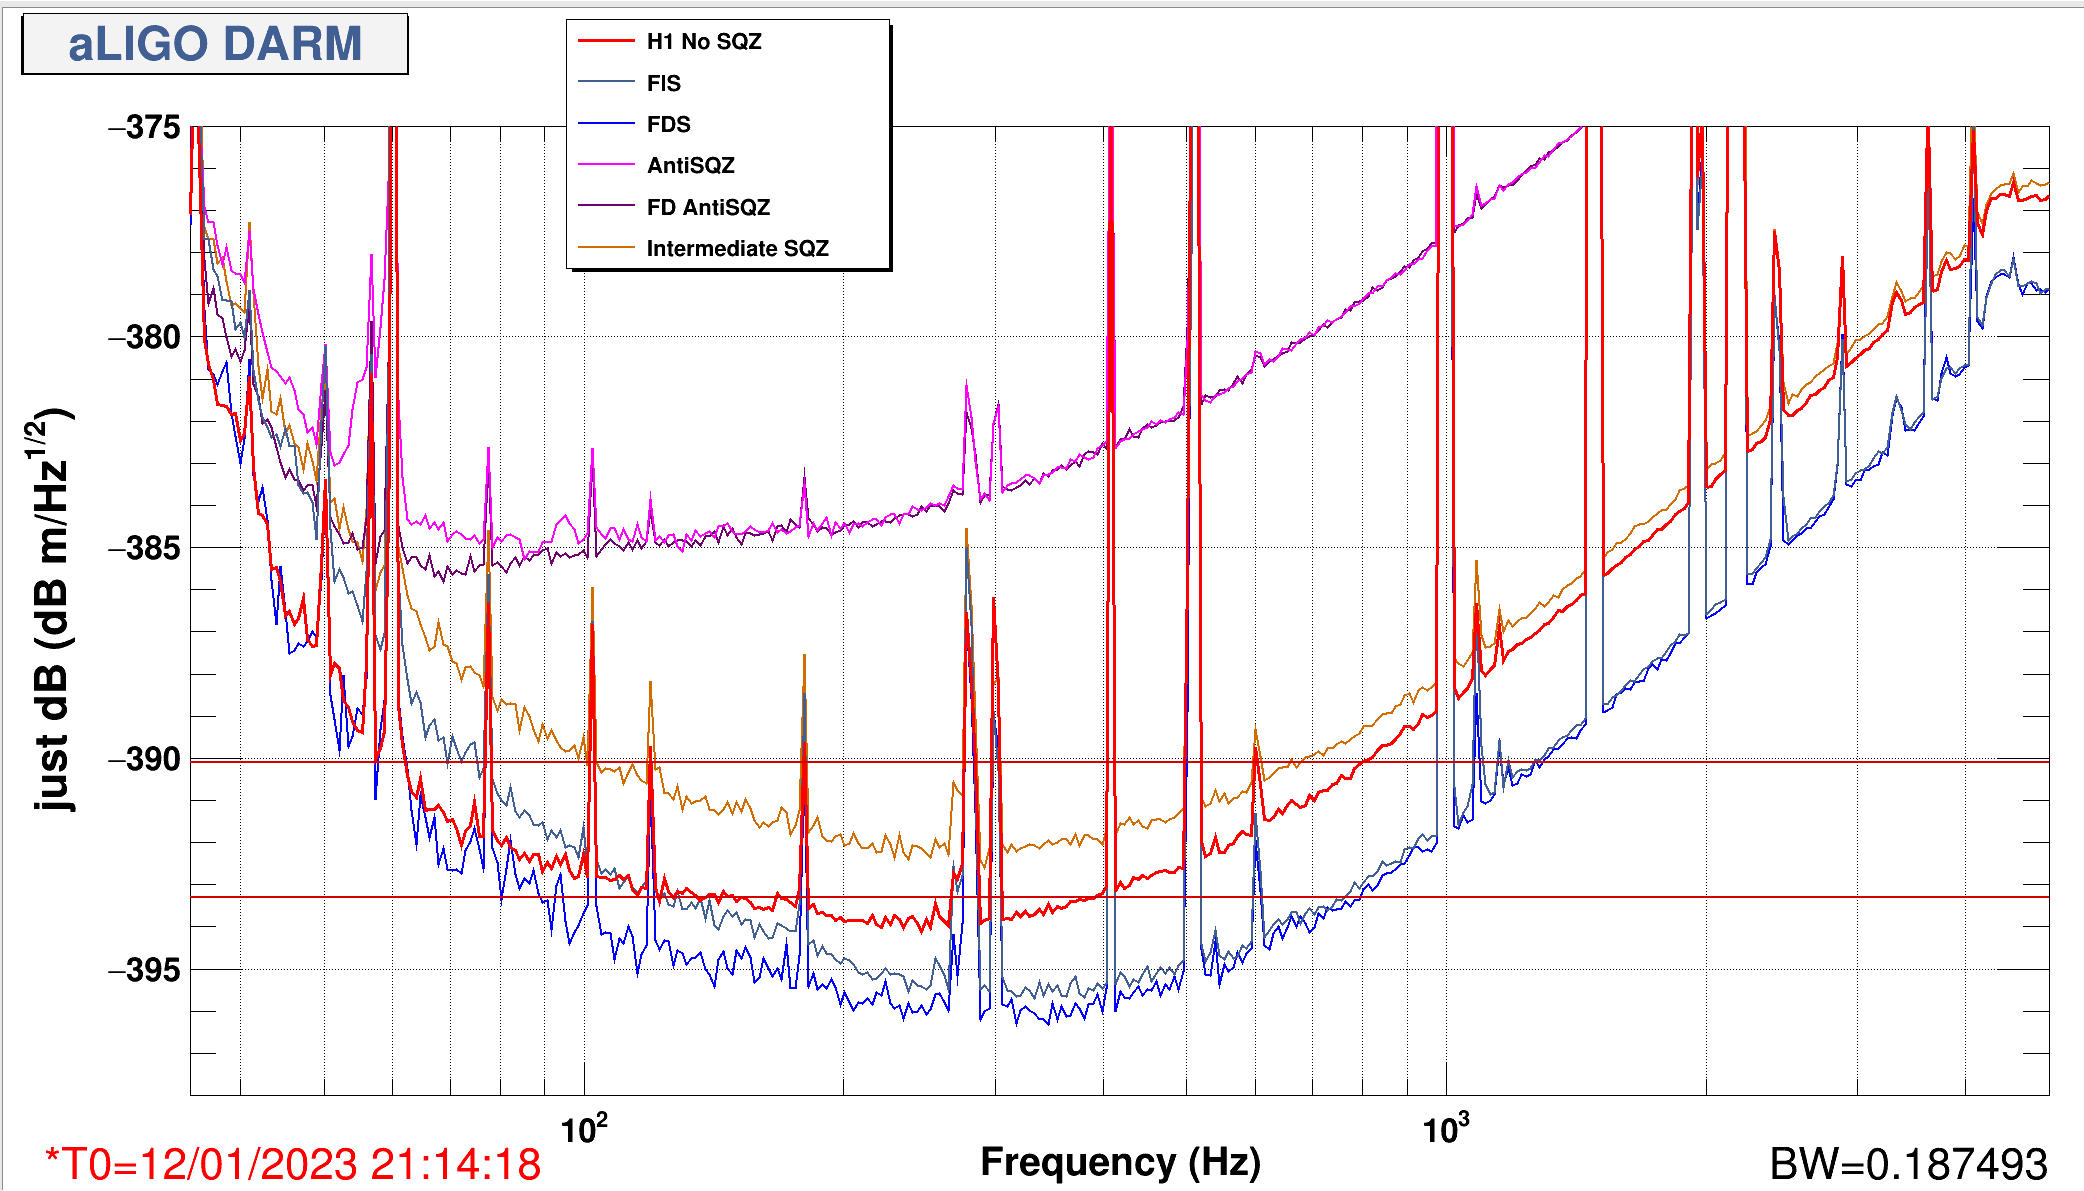
Sheila adjusted the classical noise subtraction code a bit to account for the new calibration. We took the following data-sets
SQZ: 1357604765 (30 min)
AntiSQZ : 1357602874 (15 min)
FDS : 1357597504 (60 min), however only 30 min starting at --8504 was used for the subtraction
FD anti-SQZ: 1357601818 (15 min)
Intermediate Angle (No FC) : 1357603829 (15 min)
Quiet time was at 1357593276 for 1 hour
Squeezing is around 3 dB, antiSQZ is around 11dB. The subtracted spectra show no clear frequency dependence in loss. The radiation pressure increase seems faster than models (not plotted) would seem to suggest. We need to think about the implications of these measurements a bit more

Some model curves for reference.
Parameters :
13.5dB Injected SQZ
40% loss (No frequency dependent loss)
370kW arm power
FC Params from ADF measurement
FC detuning : -35Hz
Thoughts - Low (<90Hz) and high (>1kHz) frequencies seem to agree with model. The mid-frequencies see an extra rotation(?). Cannot explain this by changing readout angle of the IFO or the SEC detuning. Frequency dependent squeezing curves look good so it looks like this mystery rotation (?) is cancelled by the filter cavity.
Here's a plot comparing the gwinc quantum noise model curve to the measured data (without subtraction). The model assumes 370kW circulating. I had to divide the model curves by 0.75 in order to make them sit on top of the measured data. This is consistent with the idea that there is a ~20-25% loss in optical gain in the IFO. If all of this is coming from IFO-OMC mode-mismatch, it would mean that the squeezing loss can be improved by the same amount and we could theoretically get closer to 5dB of squeezing by recovering these losses. Additionally, the shot noise in the IFO would also come down by ~3dB (because of increased optical gain) which would mean a 5dB improvement in quantum noise from where we are currently.
I added some external mode mismatch to Dhruva's models and got pretty good agreement. The first two plots compare the data he gave me (the attached FDS.txt) to the gwinc models; frequency independent and frequency dependent. You can get similar results with a large combination of parameters, but the ones I used are listed in the attached yaml files. I used about 4% IFO/OMC mismatch, 4% SQZ/IFO mismatch, and 5% SQZ/FC mismatch for the frequency dependent cases.
The second two plots show the frequency independent (SQZ) and frequency dependent (FDS) quantum noise budgets with the data plotted on top. The relative phasings of the mismatch in these models gives a frequency dependent mismatch loss which increases the noise in the problematic 100 Hz -- 1 kHz region of Dhruva's frequency independent fits.
Running
pytest test_lho_sqz.py -k "test_compare_gwinc or fits"
on the attached script will generate the attached plots in a local "test_results" folder. Uses the master branch of my pygwinc fork.


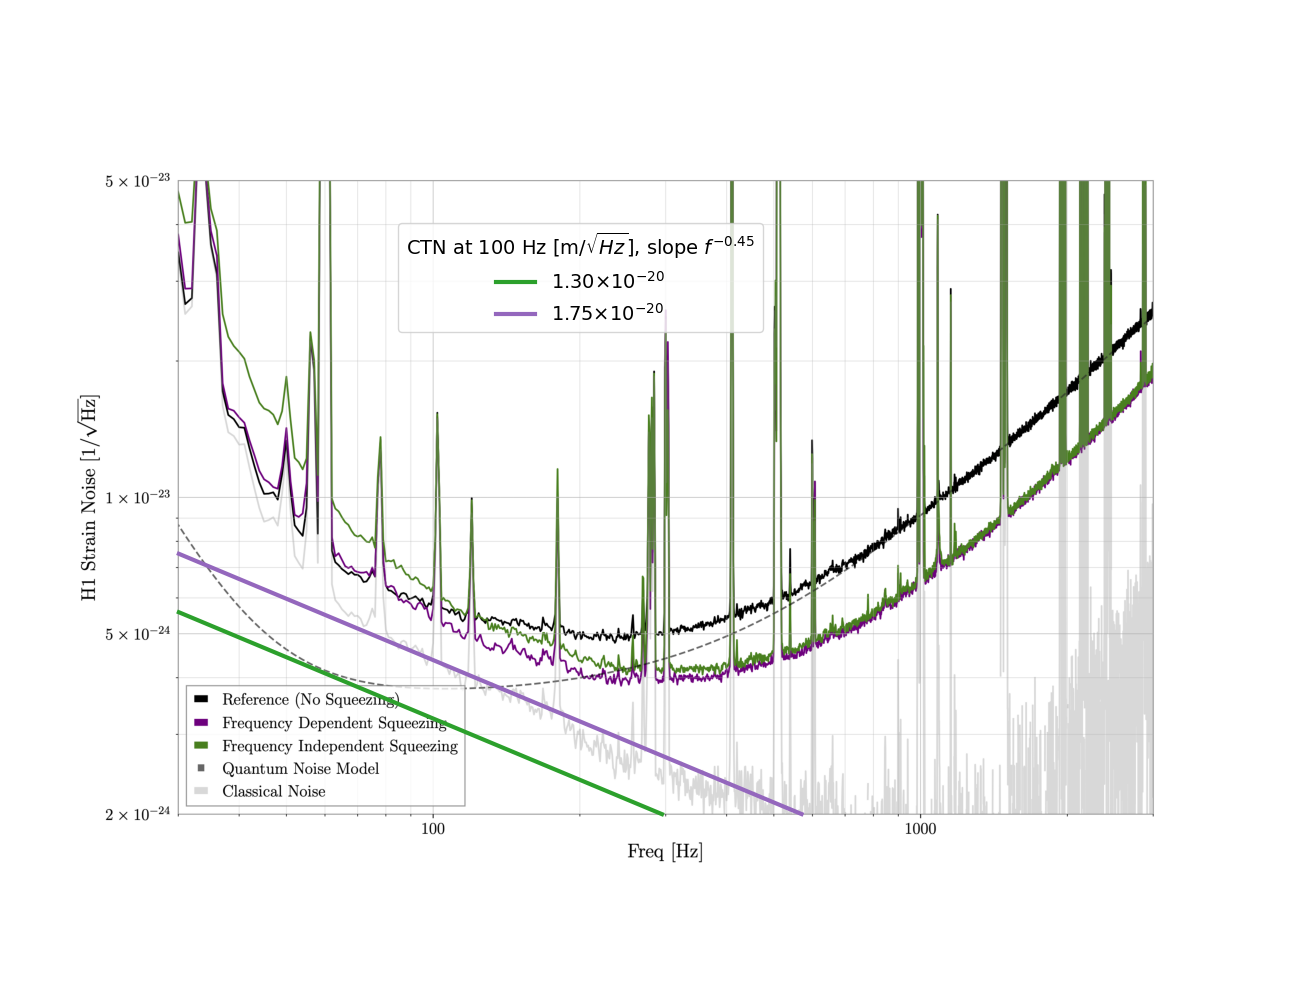
Adding a 'paper-style' plot for SQZ data with the same GPS times
Same as the last plot, with the classical noise estiimate, superimposed with the same two coating thermal noise curves shown for LLO in 63581