H.-Y. Huang, J. Kissel
I revised the code in pyDARM merger reuest #101. and search for potential time delays in measurement path. The main difference now is that:
- separate the component into two parts, actuation and sensing.
- Actuation part : include digital AI, DAC and analog AI, and also inlcude time dealy from SUS to IOP and IOP to analog. Corresponding function in pyDARM: actuation_stage_residual()
- Sensinig part : the normal sensing path from TIA, 524k whitening filter, analog AA filter (It is empty now), ADC, and a series of digital compensation filters (H1:OMC-DCPD_A0).
Corresponding function in pyDARM: omc_path_response()
- Also include 7.6 us time delay (4 cycles delay) in the model (LHO:67693) -> This may be new issue that should be included by pyDARM (?)
The time delay budget in this model:
- 61e-6 [ SUS to IOP delay ]
- 61e-6 [ IOP to analog delay ]
- 15e-6 [ unknown actuation time delay ]
- 7.6e-6 [ 4 cycles delay ]
= 61 + 61 + 15 + 7.6 us
= 144.6 us
The total time delay here is 144.6 us.
With above information, compare the measurement taken in 02 March and model. The measurement data is store at /svn/aligocalibration/trunk/Common/Electronics/H1/SensingFunction/OMCA/Data/20230302_H1_TIAxWC_OMCA_S2100832_S2300003_DCPDAandB_RemoteTestChainEXC.xml
/svn/aligocalibration/trunk/Common/Electronics/H1/SensingFunction/OMCA/Data/20230302_H1_TIAxWC_OMCA_S2100832_S2300003_DCPDAandB_RemoteTestChainEXC_tf.txt
where the export, *_tf.txt has columns [freq, real(A), imag(A), real(B), imag(B)].
The attachment:
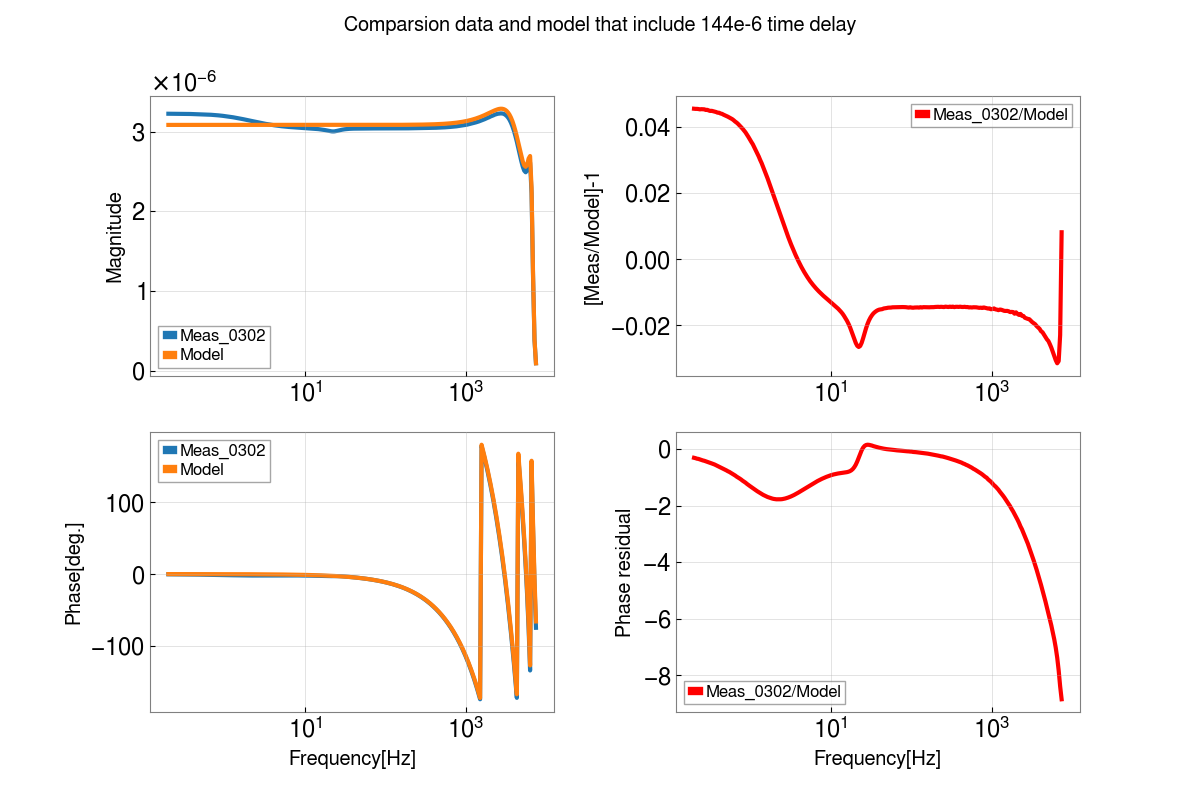
Figure 1 : quadplot that shows the comparsion between measurment data and model. Left-handed side shows the magnitude and phase of measurment data and model. Right-handed side represents the magitude residual and phase residual.
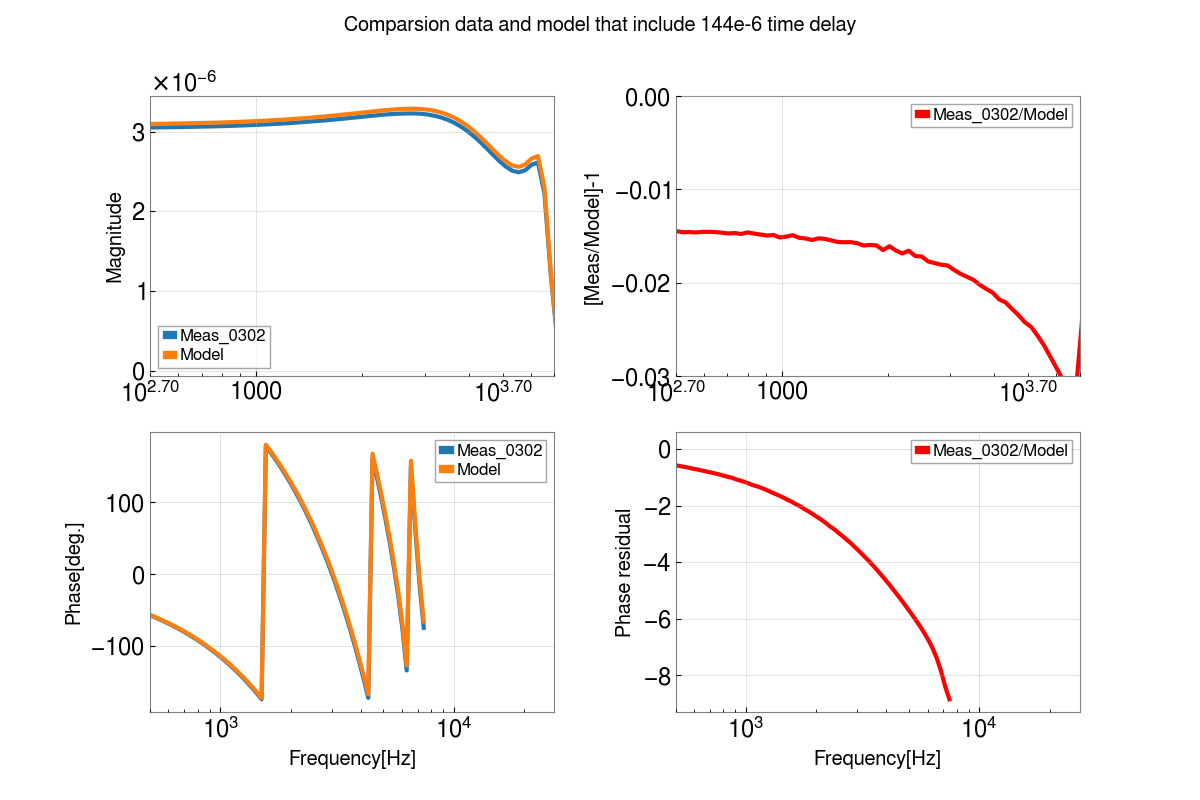
Figure 2 : still quadplot. Zoom in the Figure 1. Set x-axis limt from 500 Hz to 7000 Hz in all subplots. Set y-axis limit from 0 to -0.03 in magnitude residual.
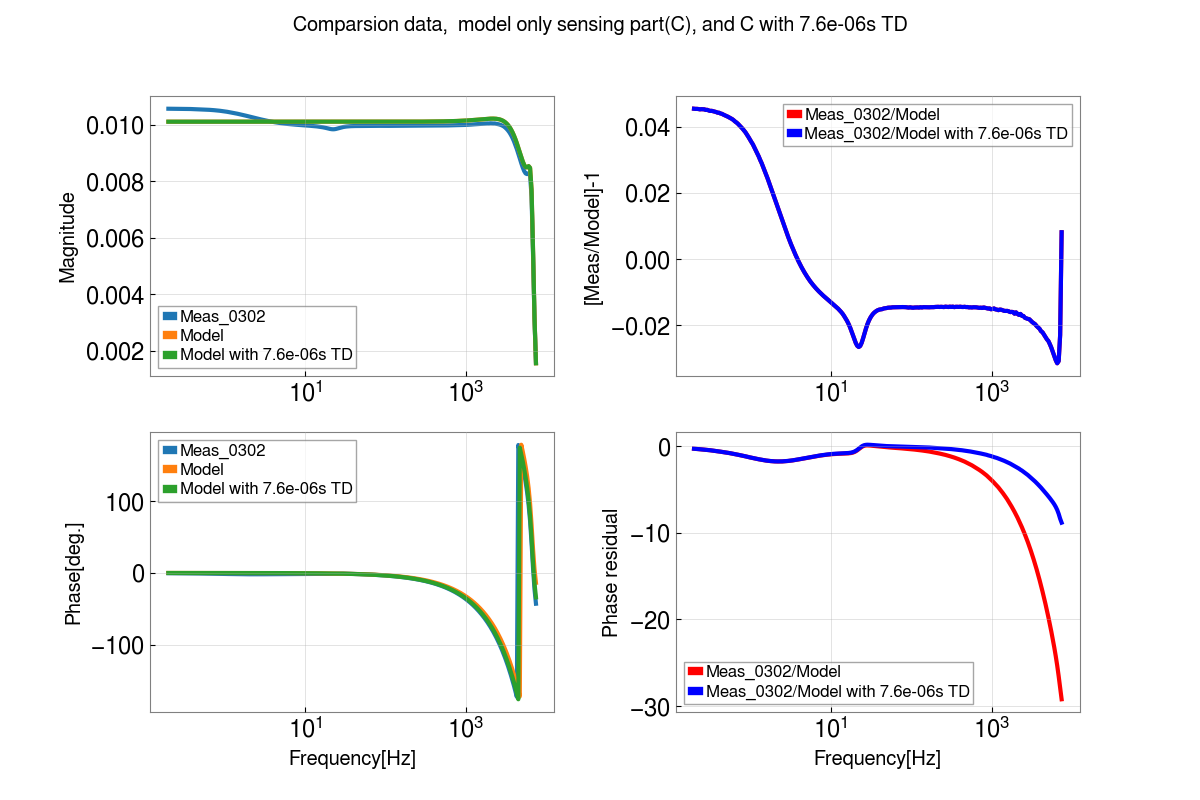
Figure 3 : also quadplot, but this shows only sensing part of DAC-driven measurement model. The Orange line in left side of figure shows the model we use now. The Green one shows current model that is added extra 7.6 us time delay that try to compensate phase loss in high frequency in orange oone.
Will update comparison between the current model and measurment taken today without whitening filter and TIA (LHO:67760) later.
Hsiang-Yu Huang
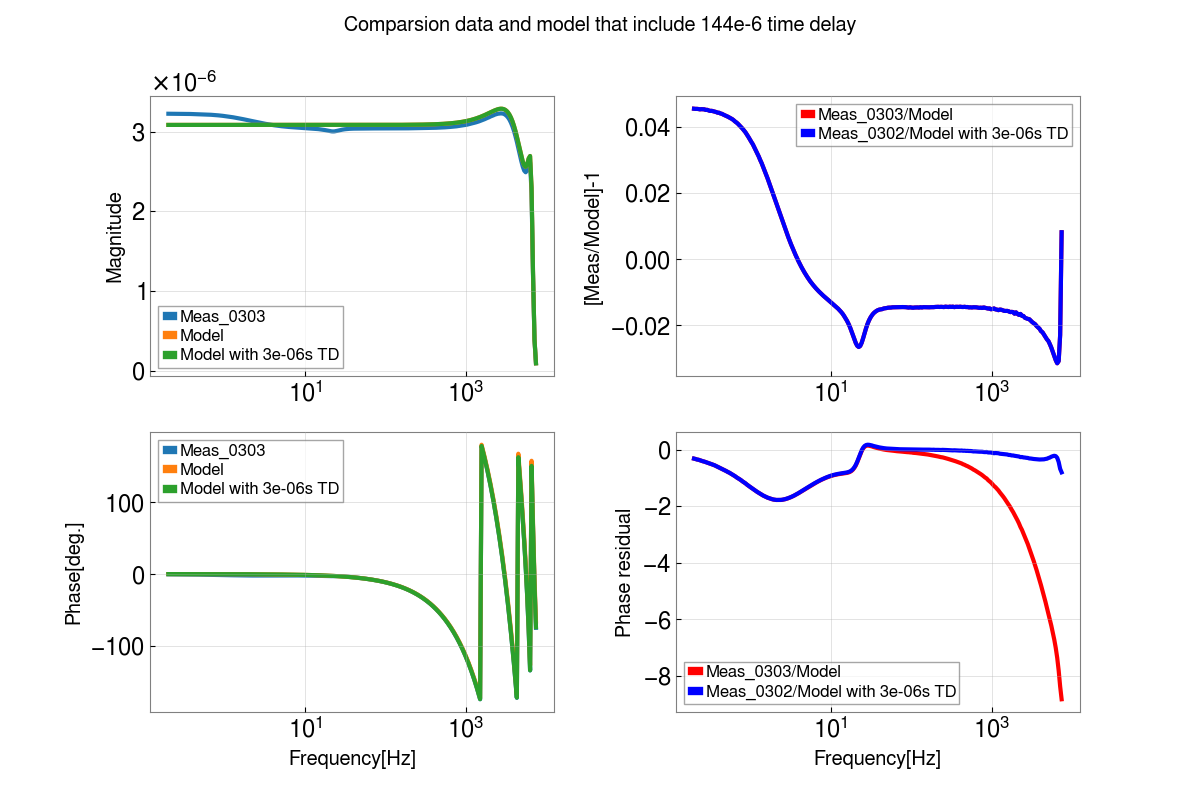
Bonus plot:
This quadplot not only shows the whole model included 144 us time delay compars to measurement data taken in 02 March,
but also represent the model(Green line), add extra 3 us time delay to compensate phase loss in high frequency. The angle is less than 1, *almost* close to 0.
For clarification, this measurement drives a 16-bit DAC that lives in the lsc0 IO chassis.

However, that DAC drive chain (as Hsiang-yu mentions, the request goes through a 16k to 65k digital AI filter, the 20 V / 2^16 calibration, then through the analog AI filter) is identical to the DAC drive out the suspensions. Thus, for *convenience* -- since we already have a pyDARM model of the suspensions (SUS) DAC drive chain -- then we replicate this lsc0 DAC drive chain with *variables* that may confuse readers into thinking that, somehow, the ETMX SUS is involved in this measurement, like "SUS to IOP" and pyDARM python methods that are named after the suspension's actuation chain, like "actuation_stage_residual()."

Further, throughout O1 to O3, LHO has needed an additional 15 usec of delay to explain the suspension's measured response to DAC drive, the so-called "unkonwn actuation time delay."
Given that we don't have any evidence to the contrary, we assume this lsc0 DAC signal chain in this measurement has the same delay.

So, re-writing Hsiang-Yu's statements in an attempt to strip out the references to the suspension actuator:

- separate the measurement into two parts, (1) the lsc0 DAC Drive and the (2) OMC DCPD sensing chain.
   (1) lsc0 DAC drive part: this includes
      :: a one 16 kHz clock cycle delay (61 usec) to get the DAC drive to the lsc0 IOP model (above called "SUS to IOP"),
      :: a 16k to 65k digital AI filter frequency response (and unity DC gain),
      :: another four 65 kHz clock cycle delays (61 usec) to wait for the DAC FIFO buffer to fill up and write (above called "IOP to analog"),
      :: another one 65 kHz clock cycle delay (15 usec) that's needed to explain the total delay in other DAC signal chains
      :: the DAC calibration from counts into volts,
      :: the analog AI filter frequency response,
   (2) Sensing Chain:
      :: the frequency response and calibration of TIA,
      :: the frequency response and gain of the whitening filter
      :: the analog "AA filter" (which is the "copy and pass-through chassis"),
      :: the one 524 kHz clock cycle delay (7.6 usec) (LHO:67693)
      :: ADC calibration from volts to counts, and a series of digital compensation filters (H1:OMC-DCPD_A0).

(So, if you're tally up the delay alone in this measurement, we expect (61 + 61 + 15) + (7.6) usec = 144.6 usec.