Rahul K. Arnaud P, Elenna C.
Today during maintenance, Rahul, Arnaud and I took a look at how effective the ITM L2 to R0 damping is, and checked the frequency of the ETM L2 feature. We (commissioners) have hypothesized that the 3.4 Hz instability we are seeing results from some sort of R0/L2 coupling in the ETMs, and is not being appropriately damped.
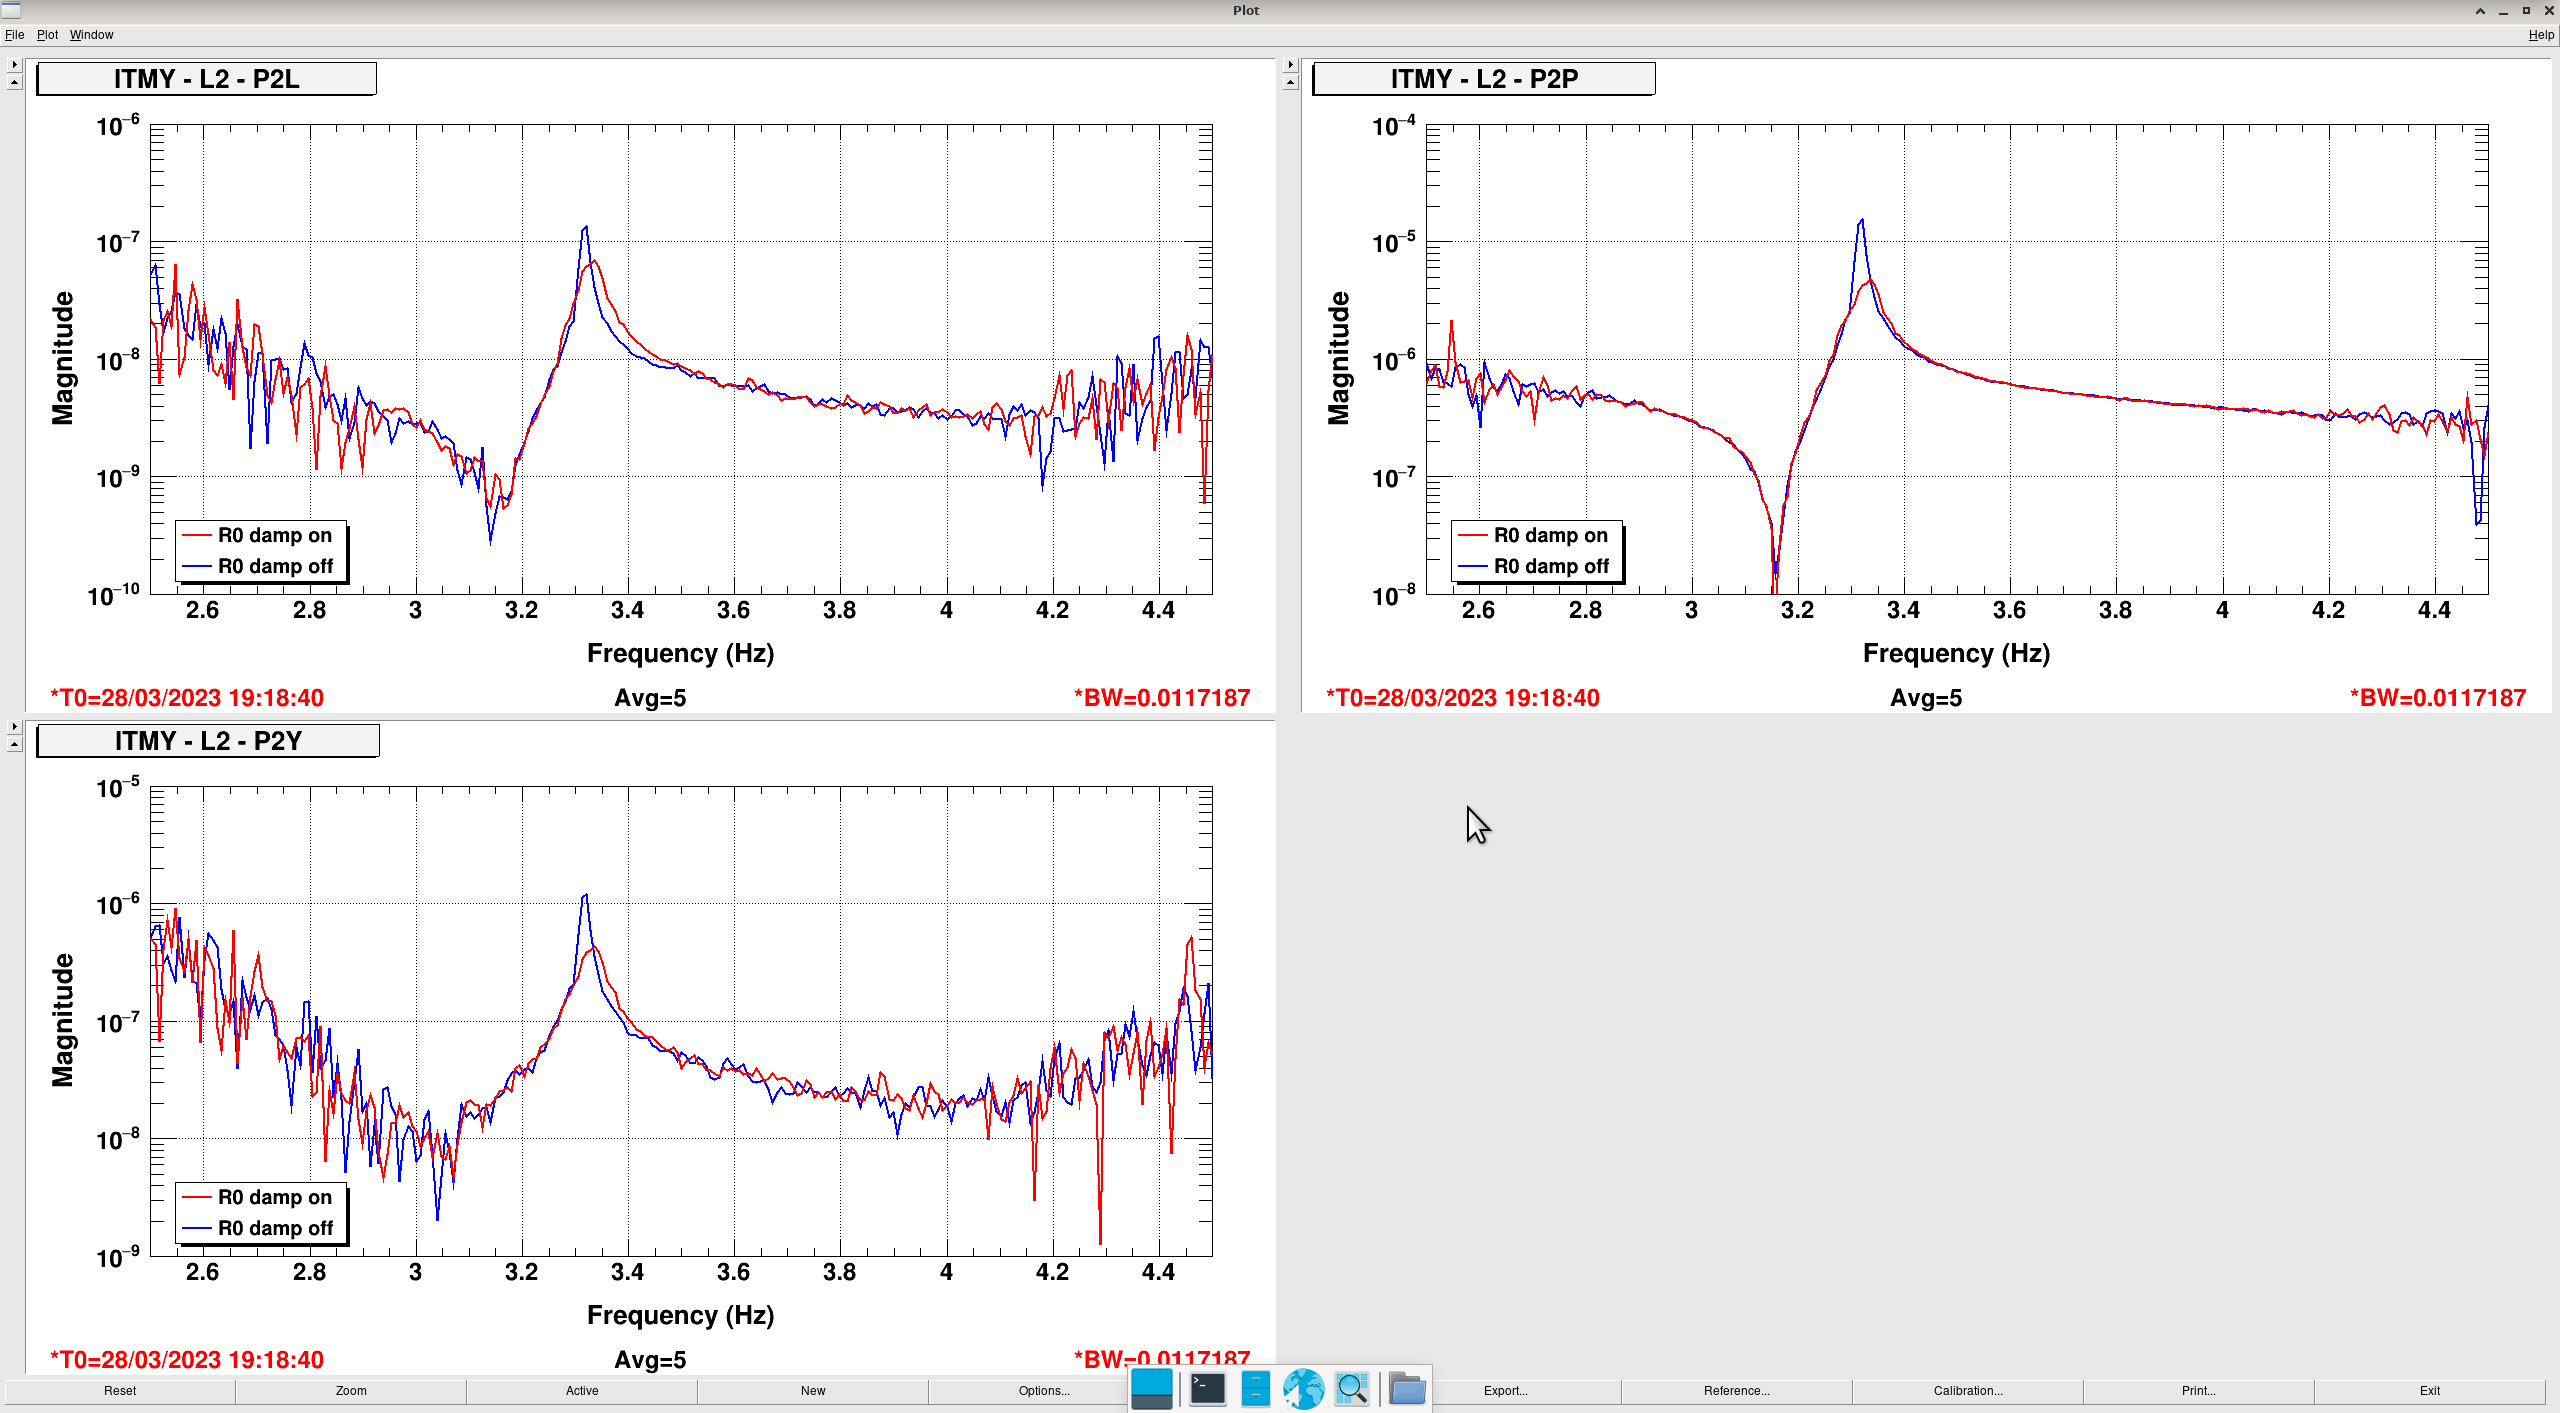
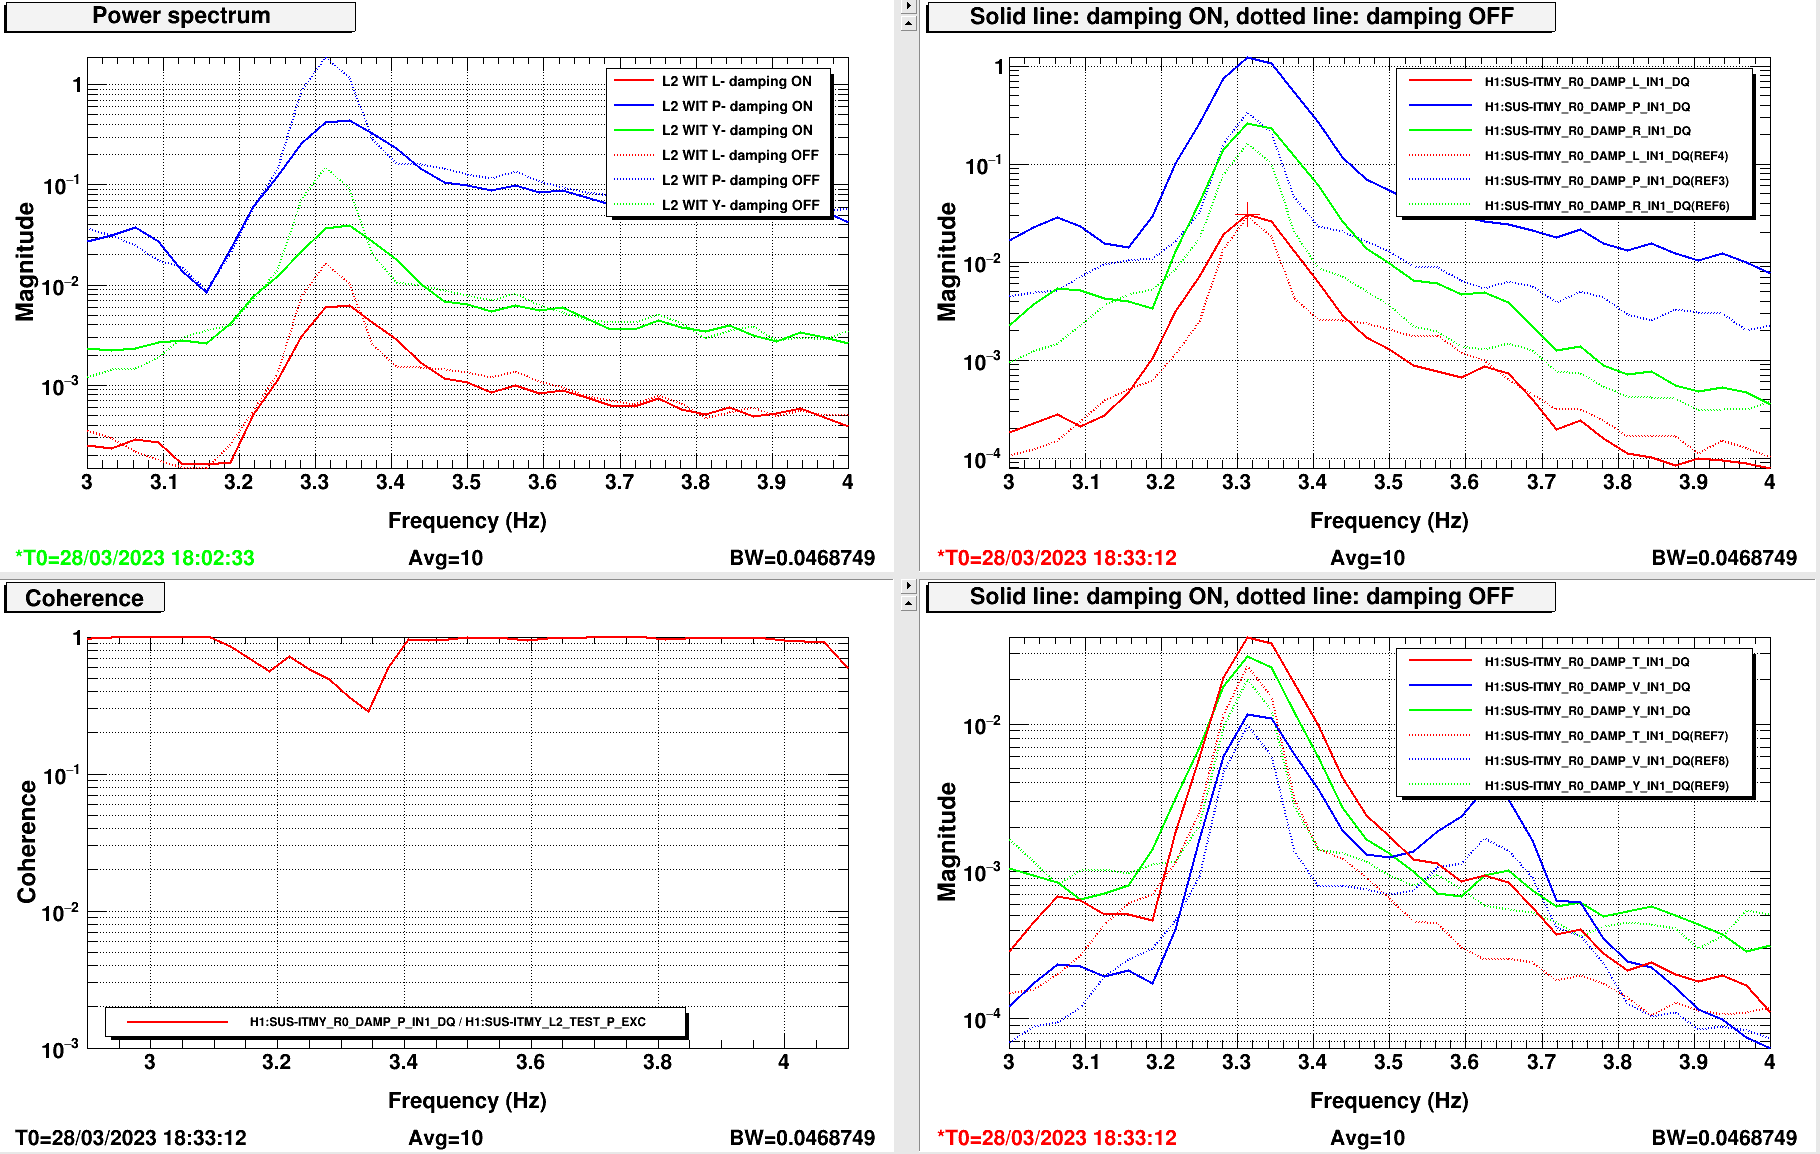
Rahul, Arnaud and I injected a 3-4 Hz band of white noise at the L2 P test excitation point and measured the resulting L2 WIT and R0 damp IN1 spectra with the L2 wit damping OFF and ON. In the ITMs, the resonance feature appears to be evident at 3.31 Hz, which is what was predicted by the model, and what the L2 wit damping targets with the resG in the damping bank. With the damping on, we see that the motion is reduced by about a factor of 2 in L, P and Y on L2. However, the motion increases on R0. After some discussion, we decided that this is probably ok, as we want to reduce the L2 motion improve the existence of the 3.3 Hz motion in the ASC loops. As it stands, we can likely do better in the suppression of 3.3 Hz motion in the ITMs, but we did not have much time to tune today, so perhaps next week we will investigate if we can improve more than a factor of 2. See a plot of the ITMY measurement. The results are the same for ITMX. The templates used for this measurement are saved in "/ligo/home/elenna.capote/DTT" at "ITM{X,Y}_R0_testing.xml". There are also high resolution versions with a 3 mHz bandwidth saved in the same directory with the name "highres" tacked on to the end.
Quick ITM summary: the resonance feature occurs at 3.31 Hz, and the damping is applied to the correct frequency, reduces motion by a factor of 2.
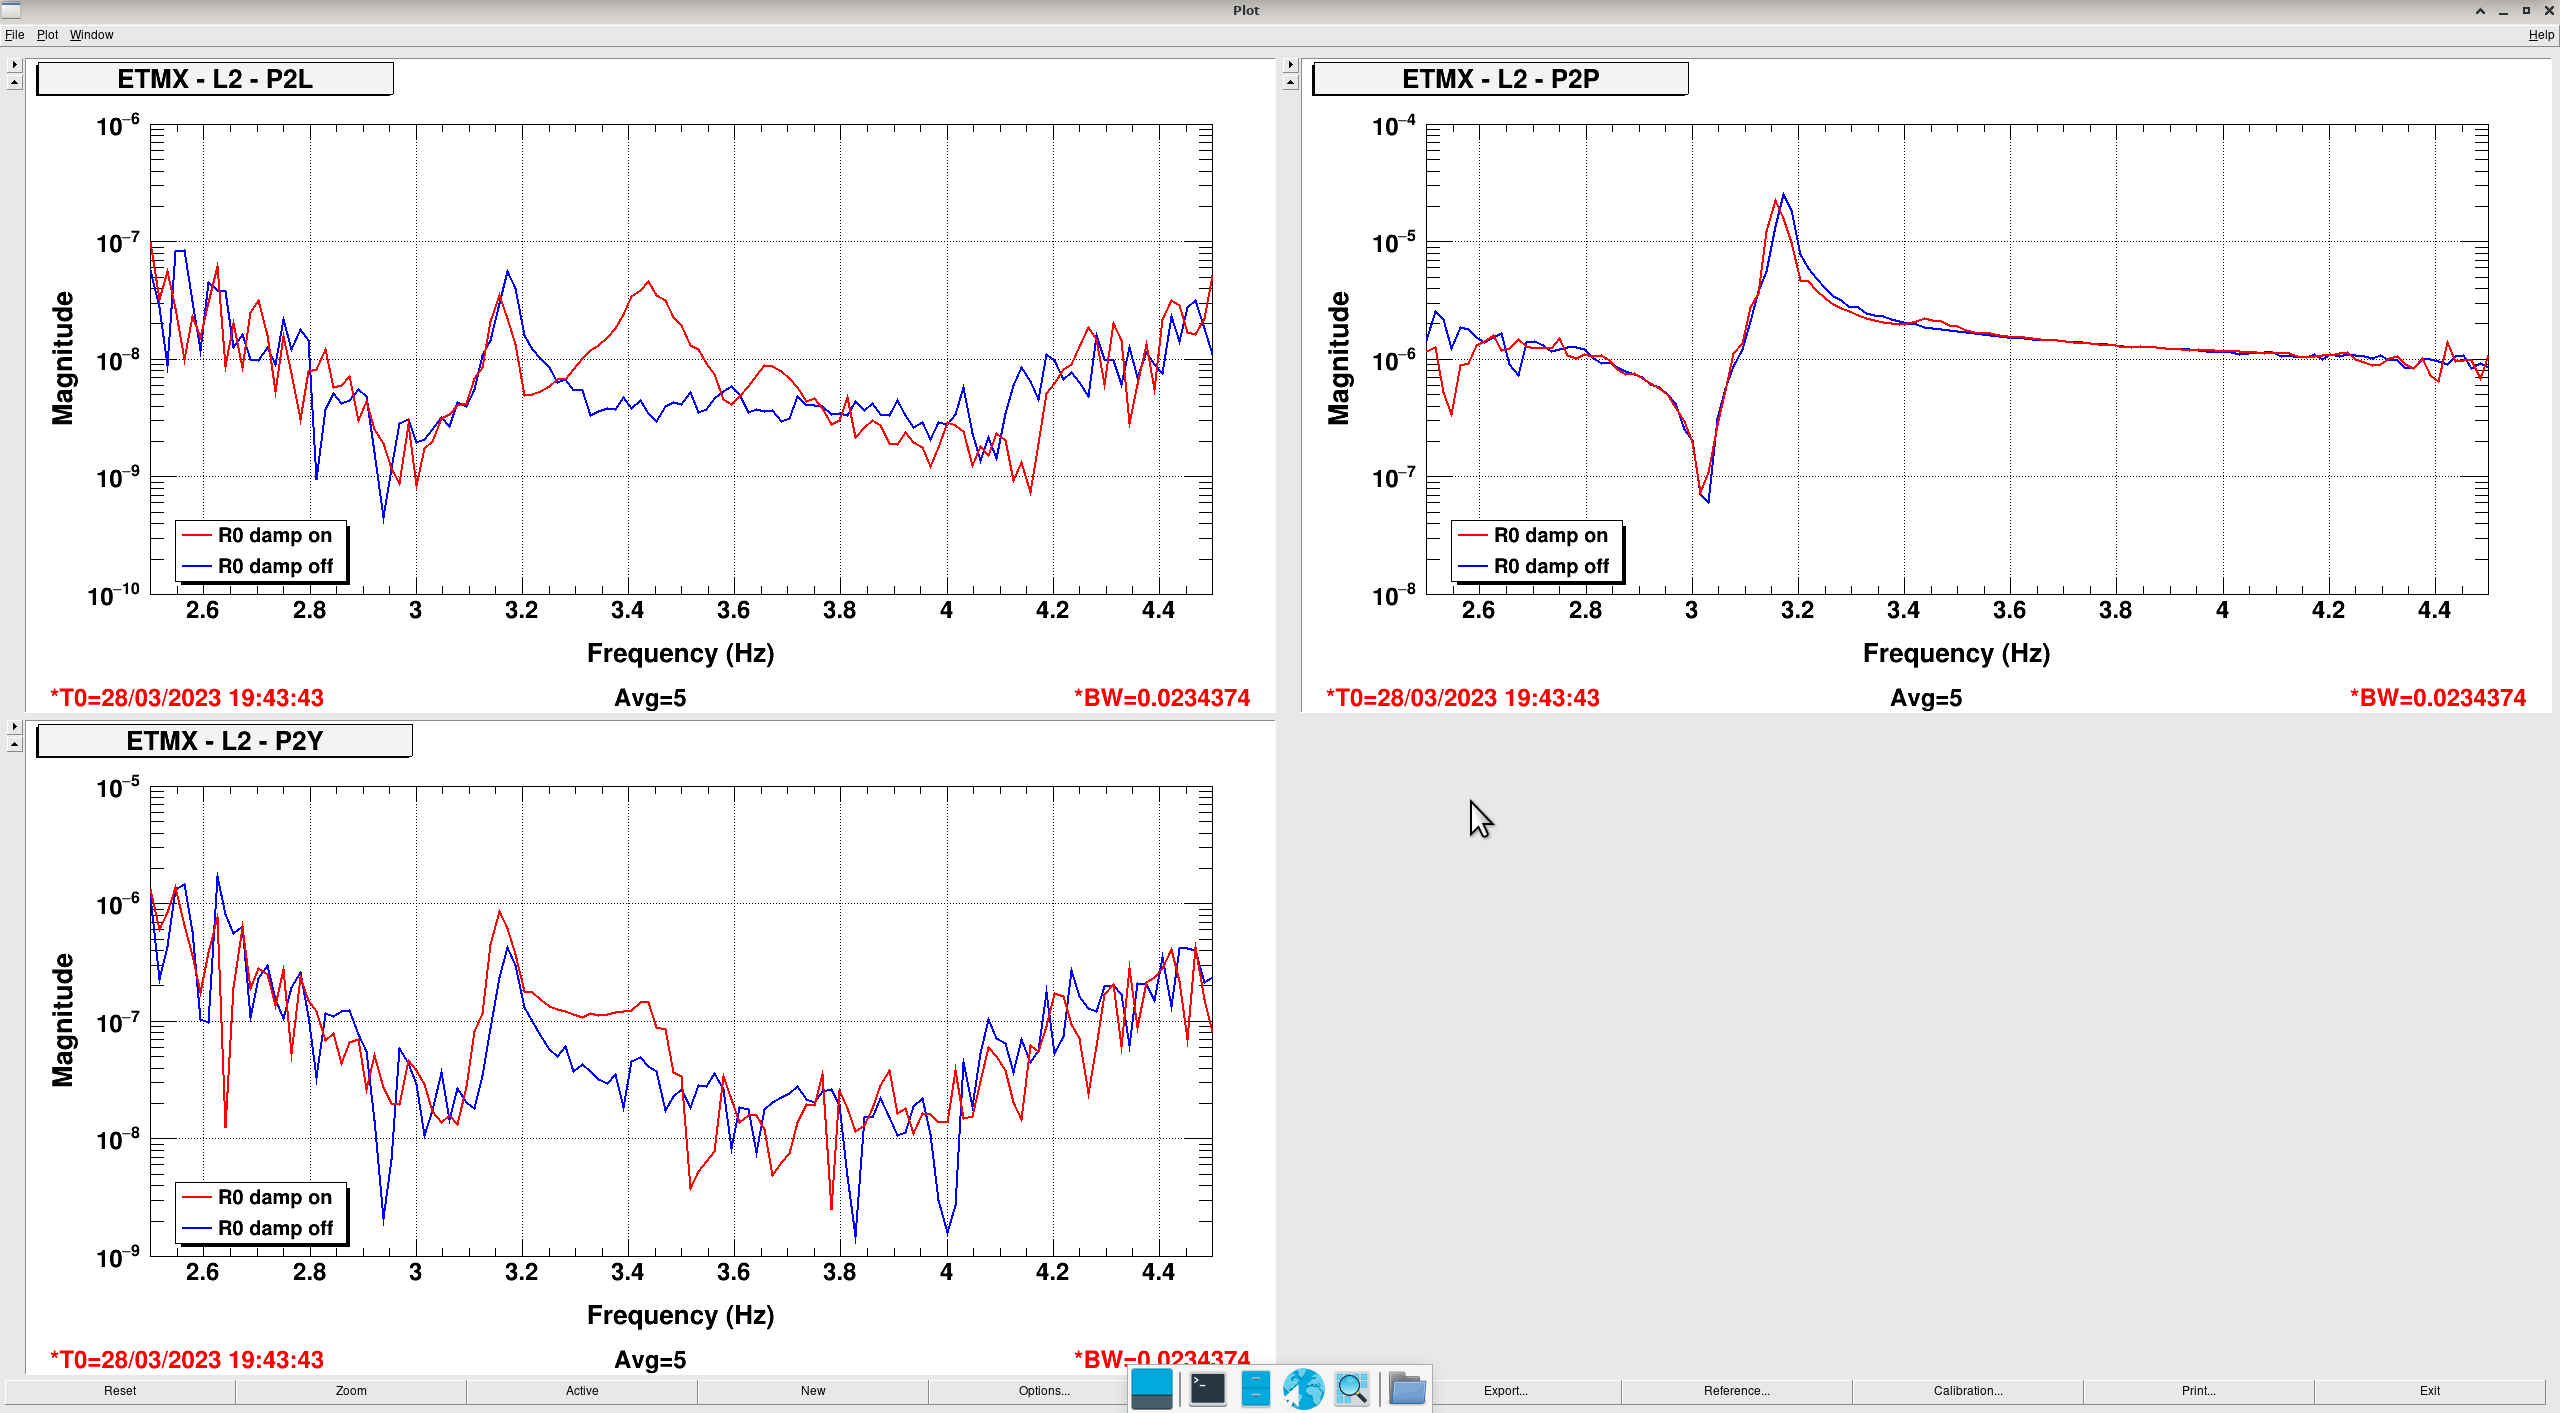
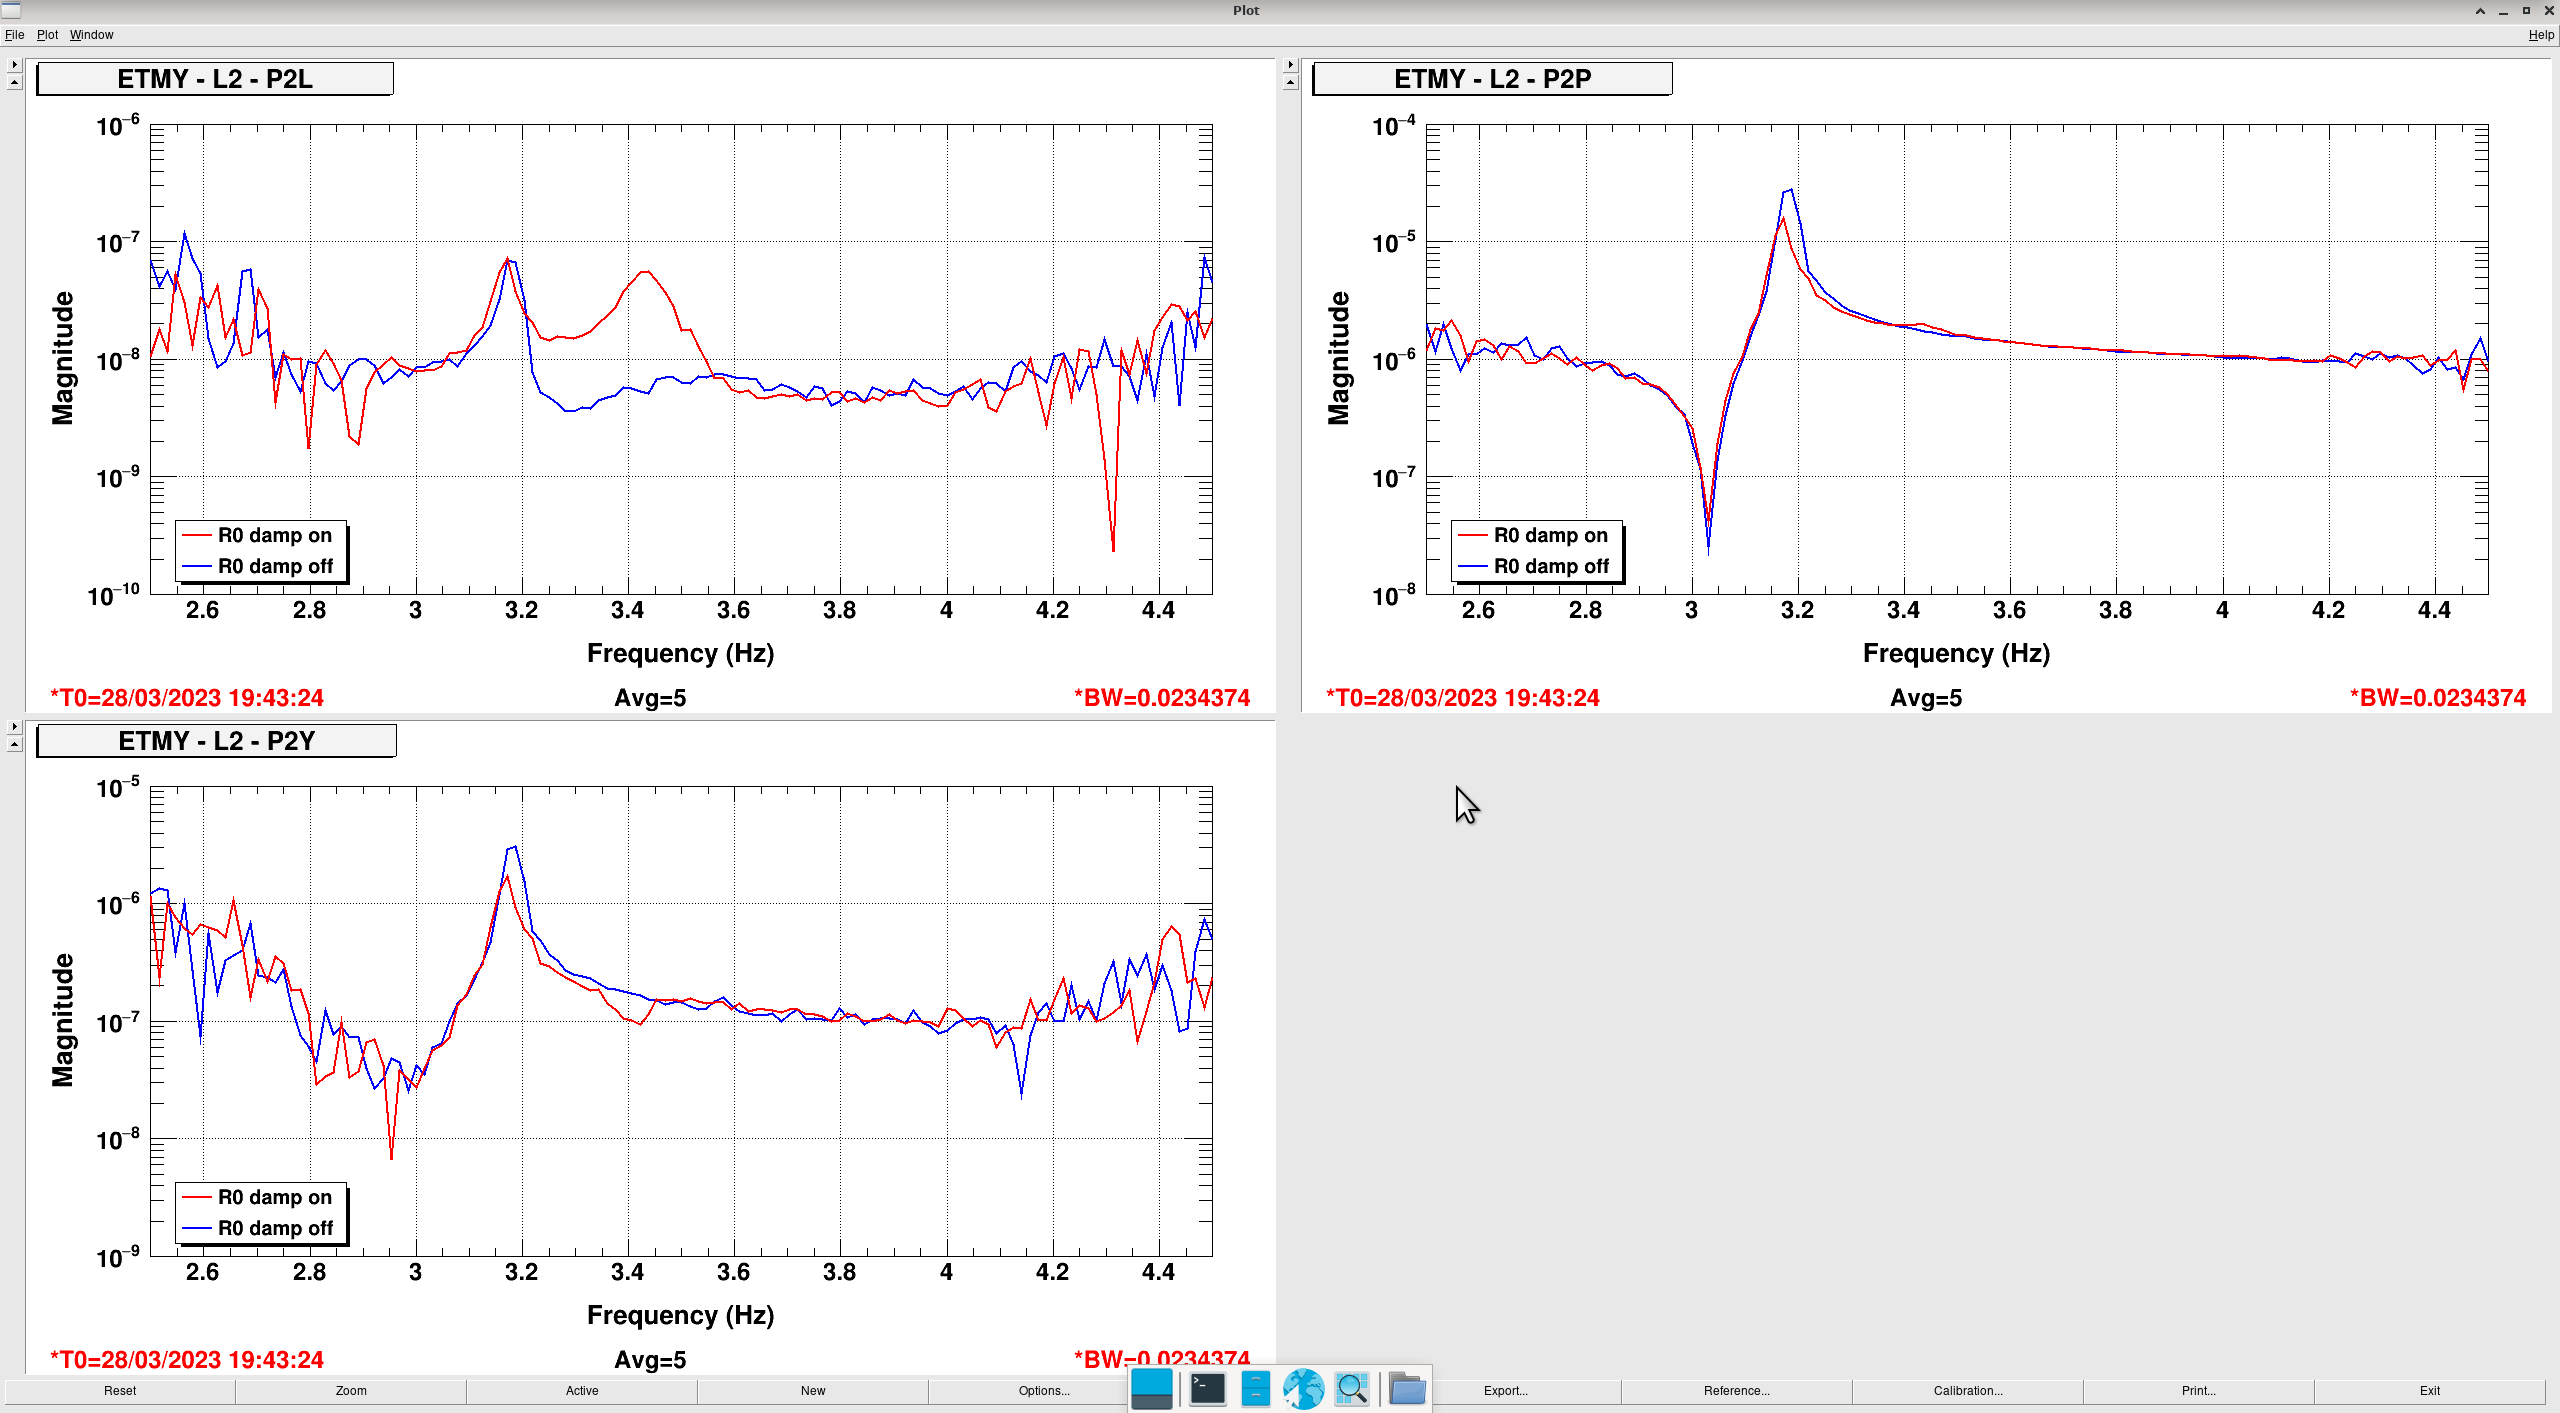
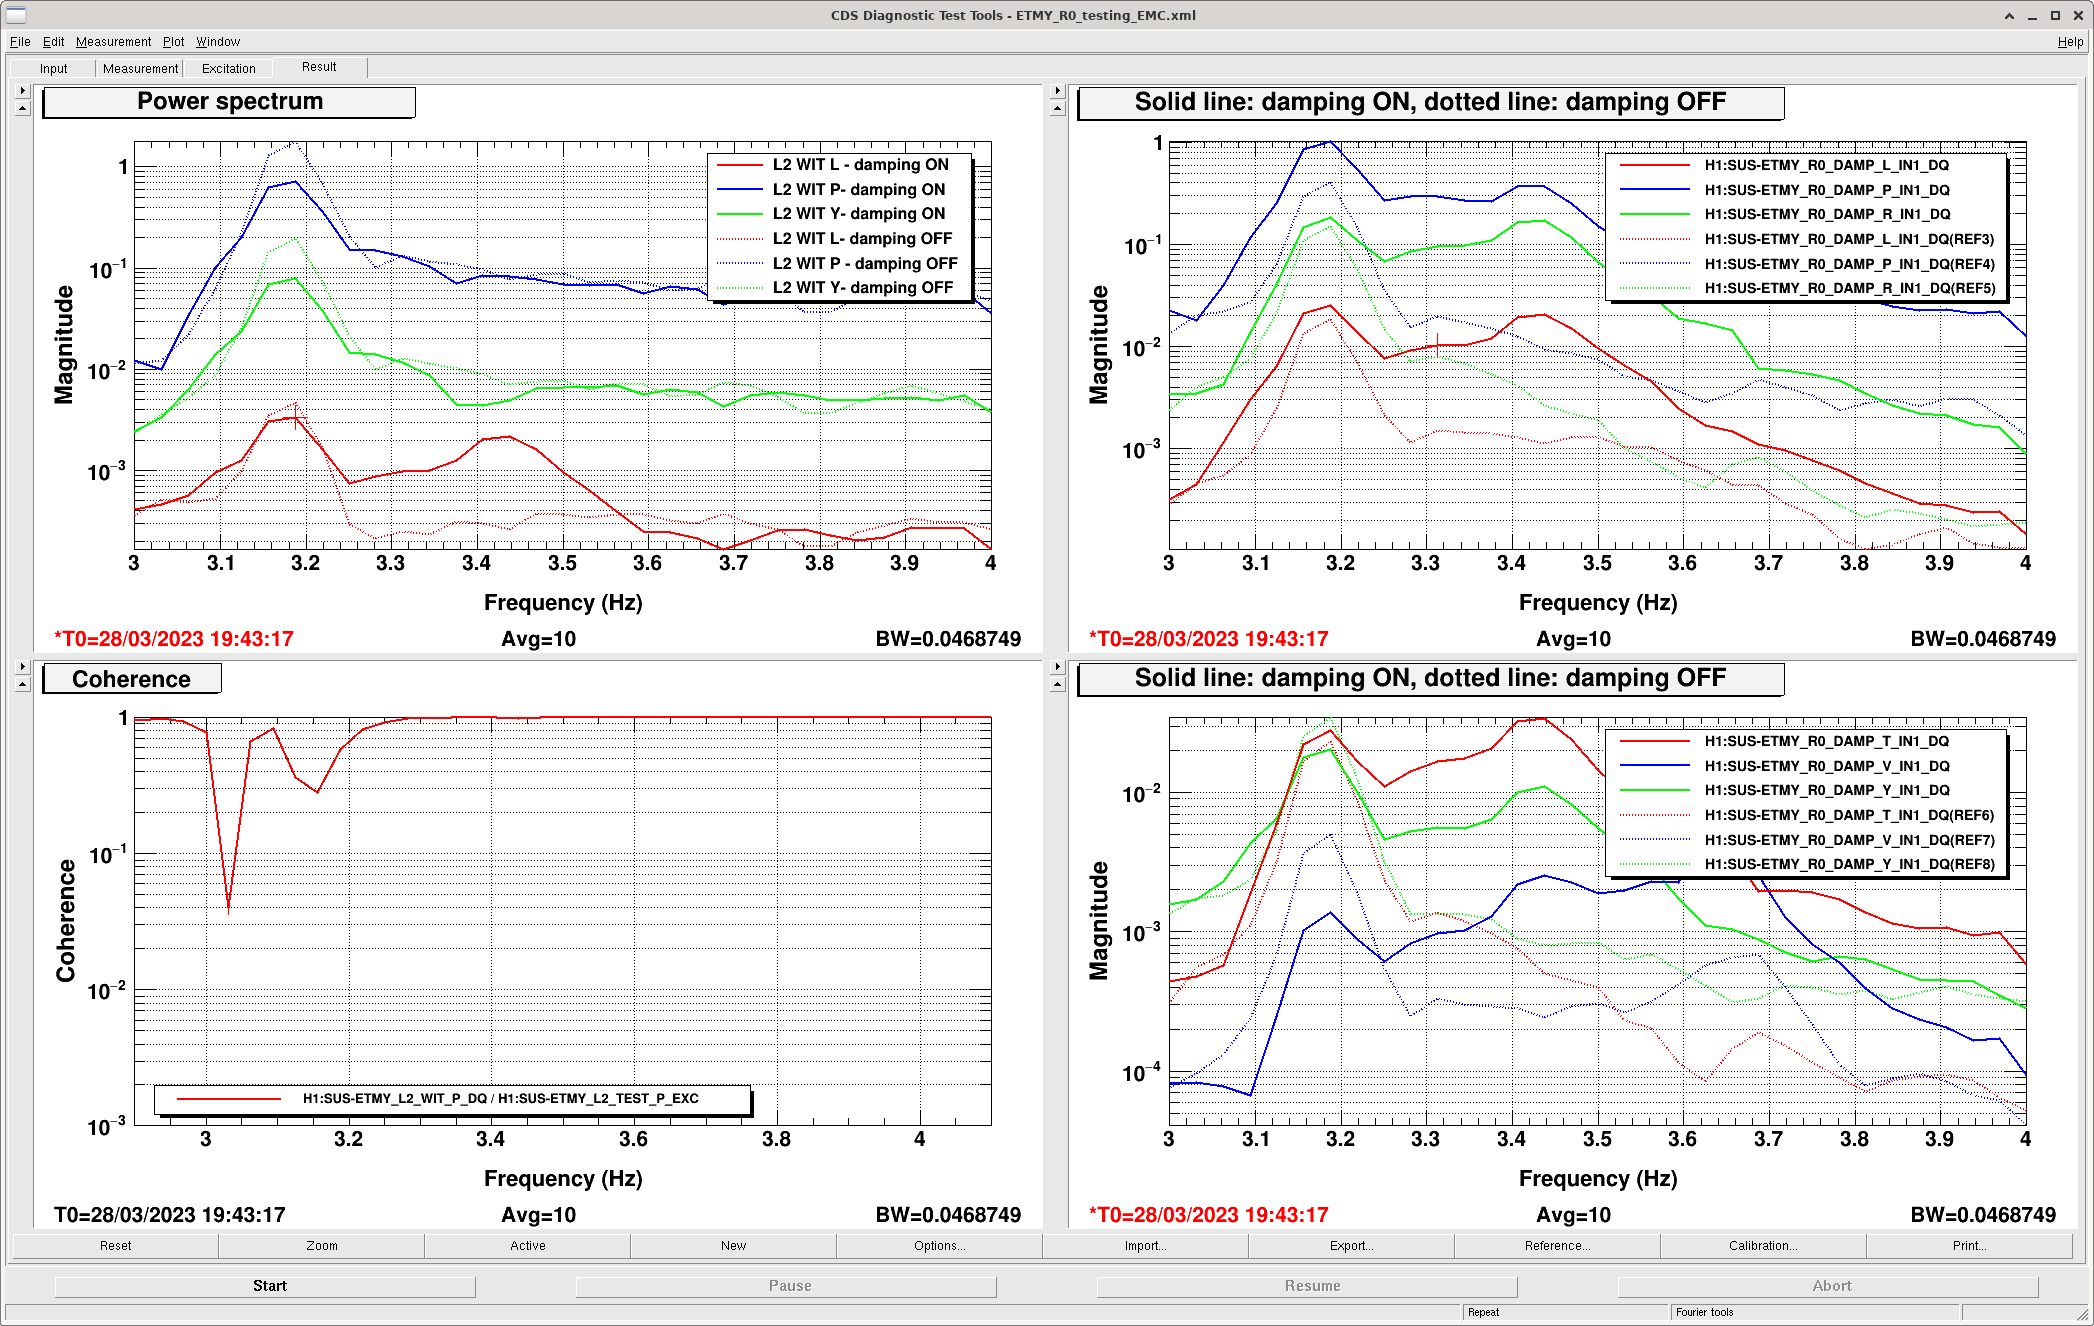
Next, we applied the same method to the ETMs. Without the damping on, we applied the 3-4 Hz band limited noise injection, and saw that the resonance feature appears to be at 3.18 Hz (huh!). Not at all what I expected. Currently, the L2 WIT damping has the resG located at 3.43 Hz, because we thought that the ETMs were the source of this feature. However, the damping is similarly reducing the motion by about a factor of 2. There is probably room for improvement here, but it seems to be working well as is. Next week, we can try tuning the damping filters to better match this resonance feature and perhaps damp it further. We do not have a high res measurement of the effect due to time constraints. See a plot of the ETMY measurement. We got similar results for ETMX. ETMY results are in the same directory stated above. Currently, Rahul has the ETMX results saved elsewhere; he will comment their location.
Quick ETM summary: the resonance feature occurs at 3.18 Hz, and the damping is not necessarily to the correct frequency, still reduces motion by a factor of 2.
Overall, it seems like the L2 WIT to R0 damping is working as needed, with some room for improvement. These results tell me that we need to look elsewhere for the source of the 3.4 Hz motion.
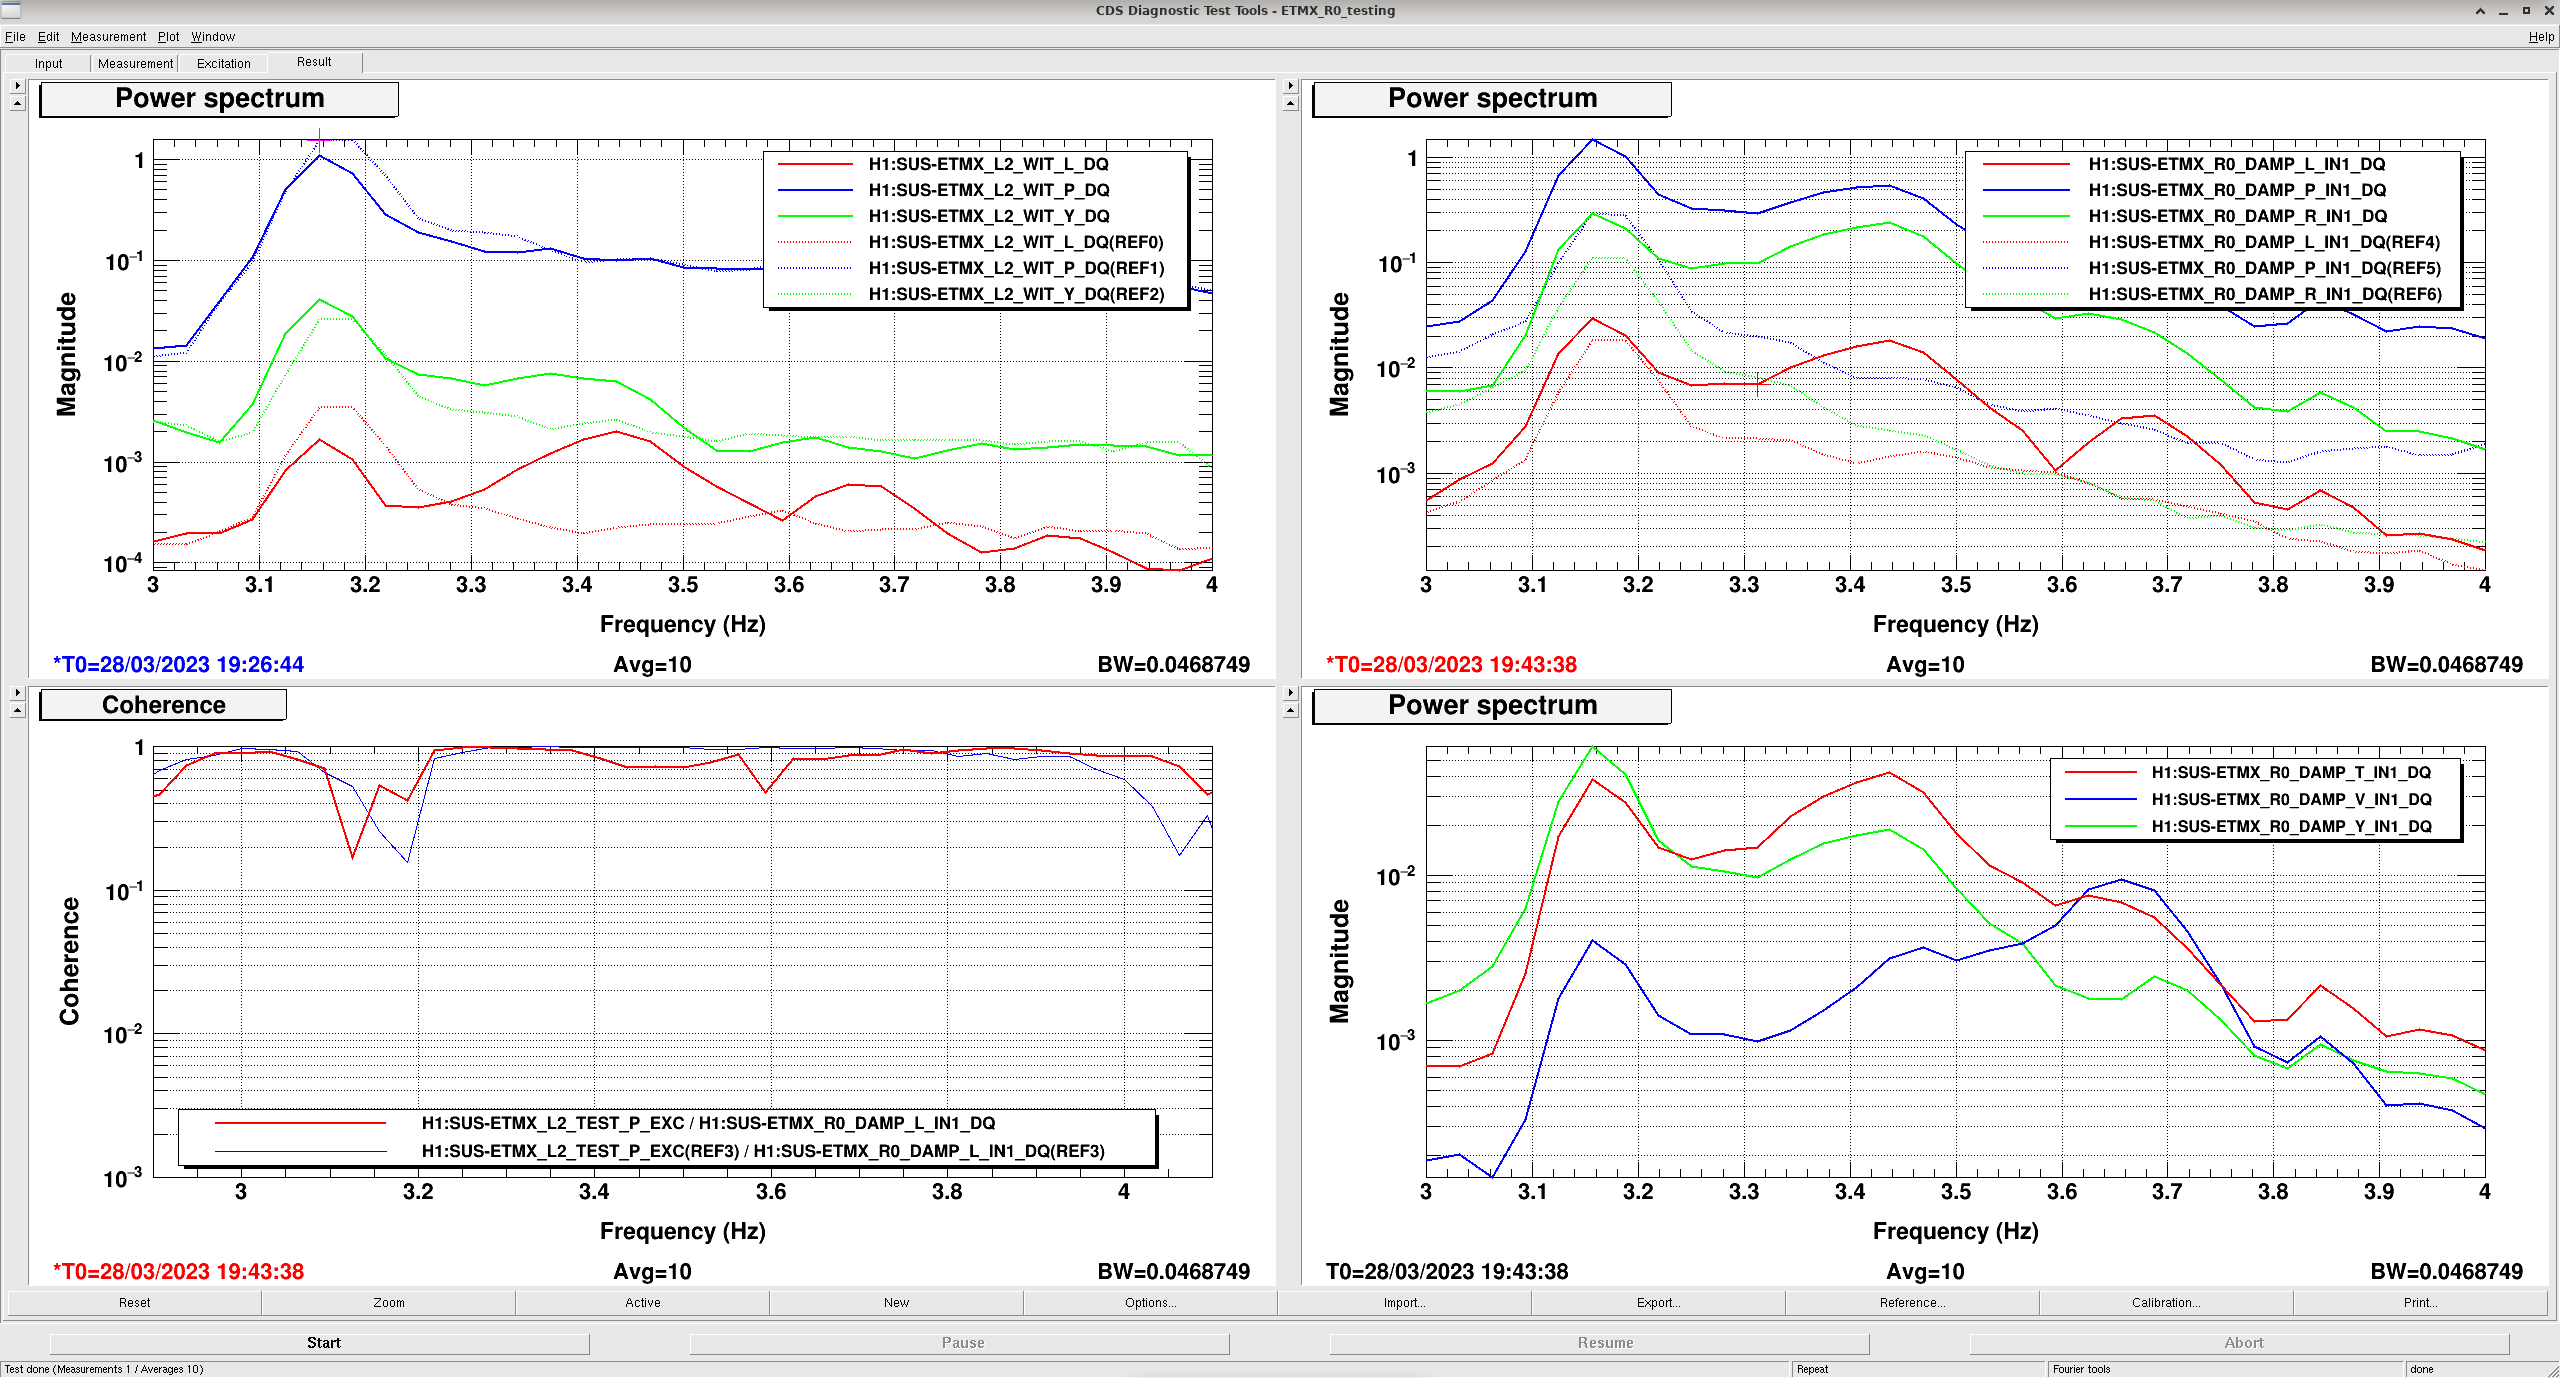
I am uploading the results for ETMX, comparing damped (solid line) and undamped (dotted line) spectra.
I see a resonance peak at 3.15Hz. Damping improves the L and P dof for ETMX and makes it slightly worse for Y dof.
For the R0 chain all three dof gets worse (when damping is applied at ETMX_R0_L2DAMP: P and R dof), especially P and R dof.
My template is stored at the following location,
/ligo/home/rahul.kumar/Desktop/xml_files/ETMX_R0_Testing.xml
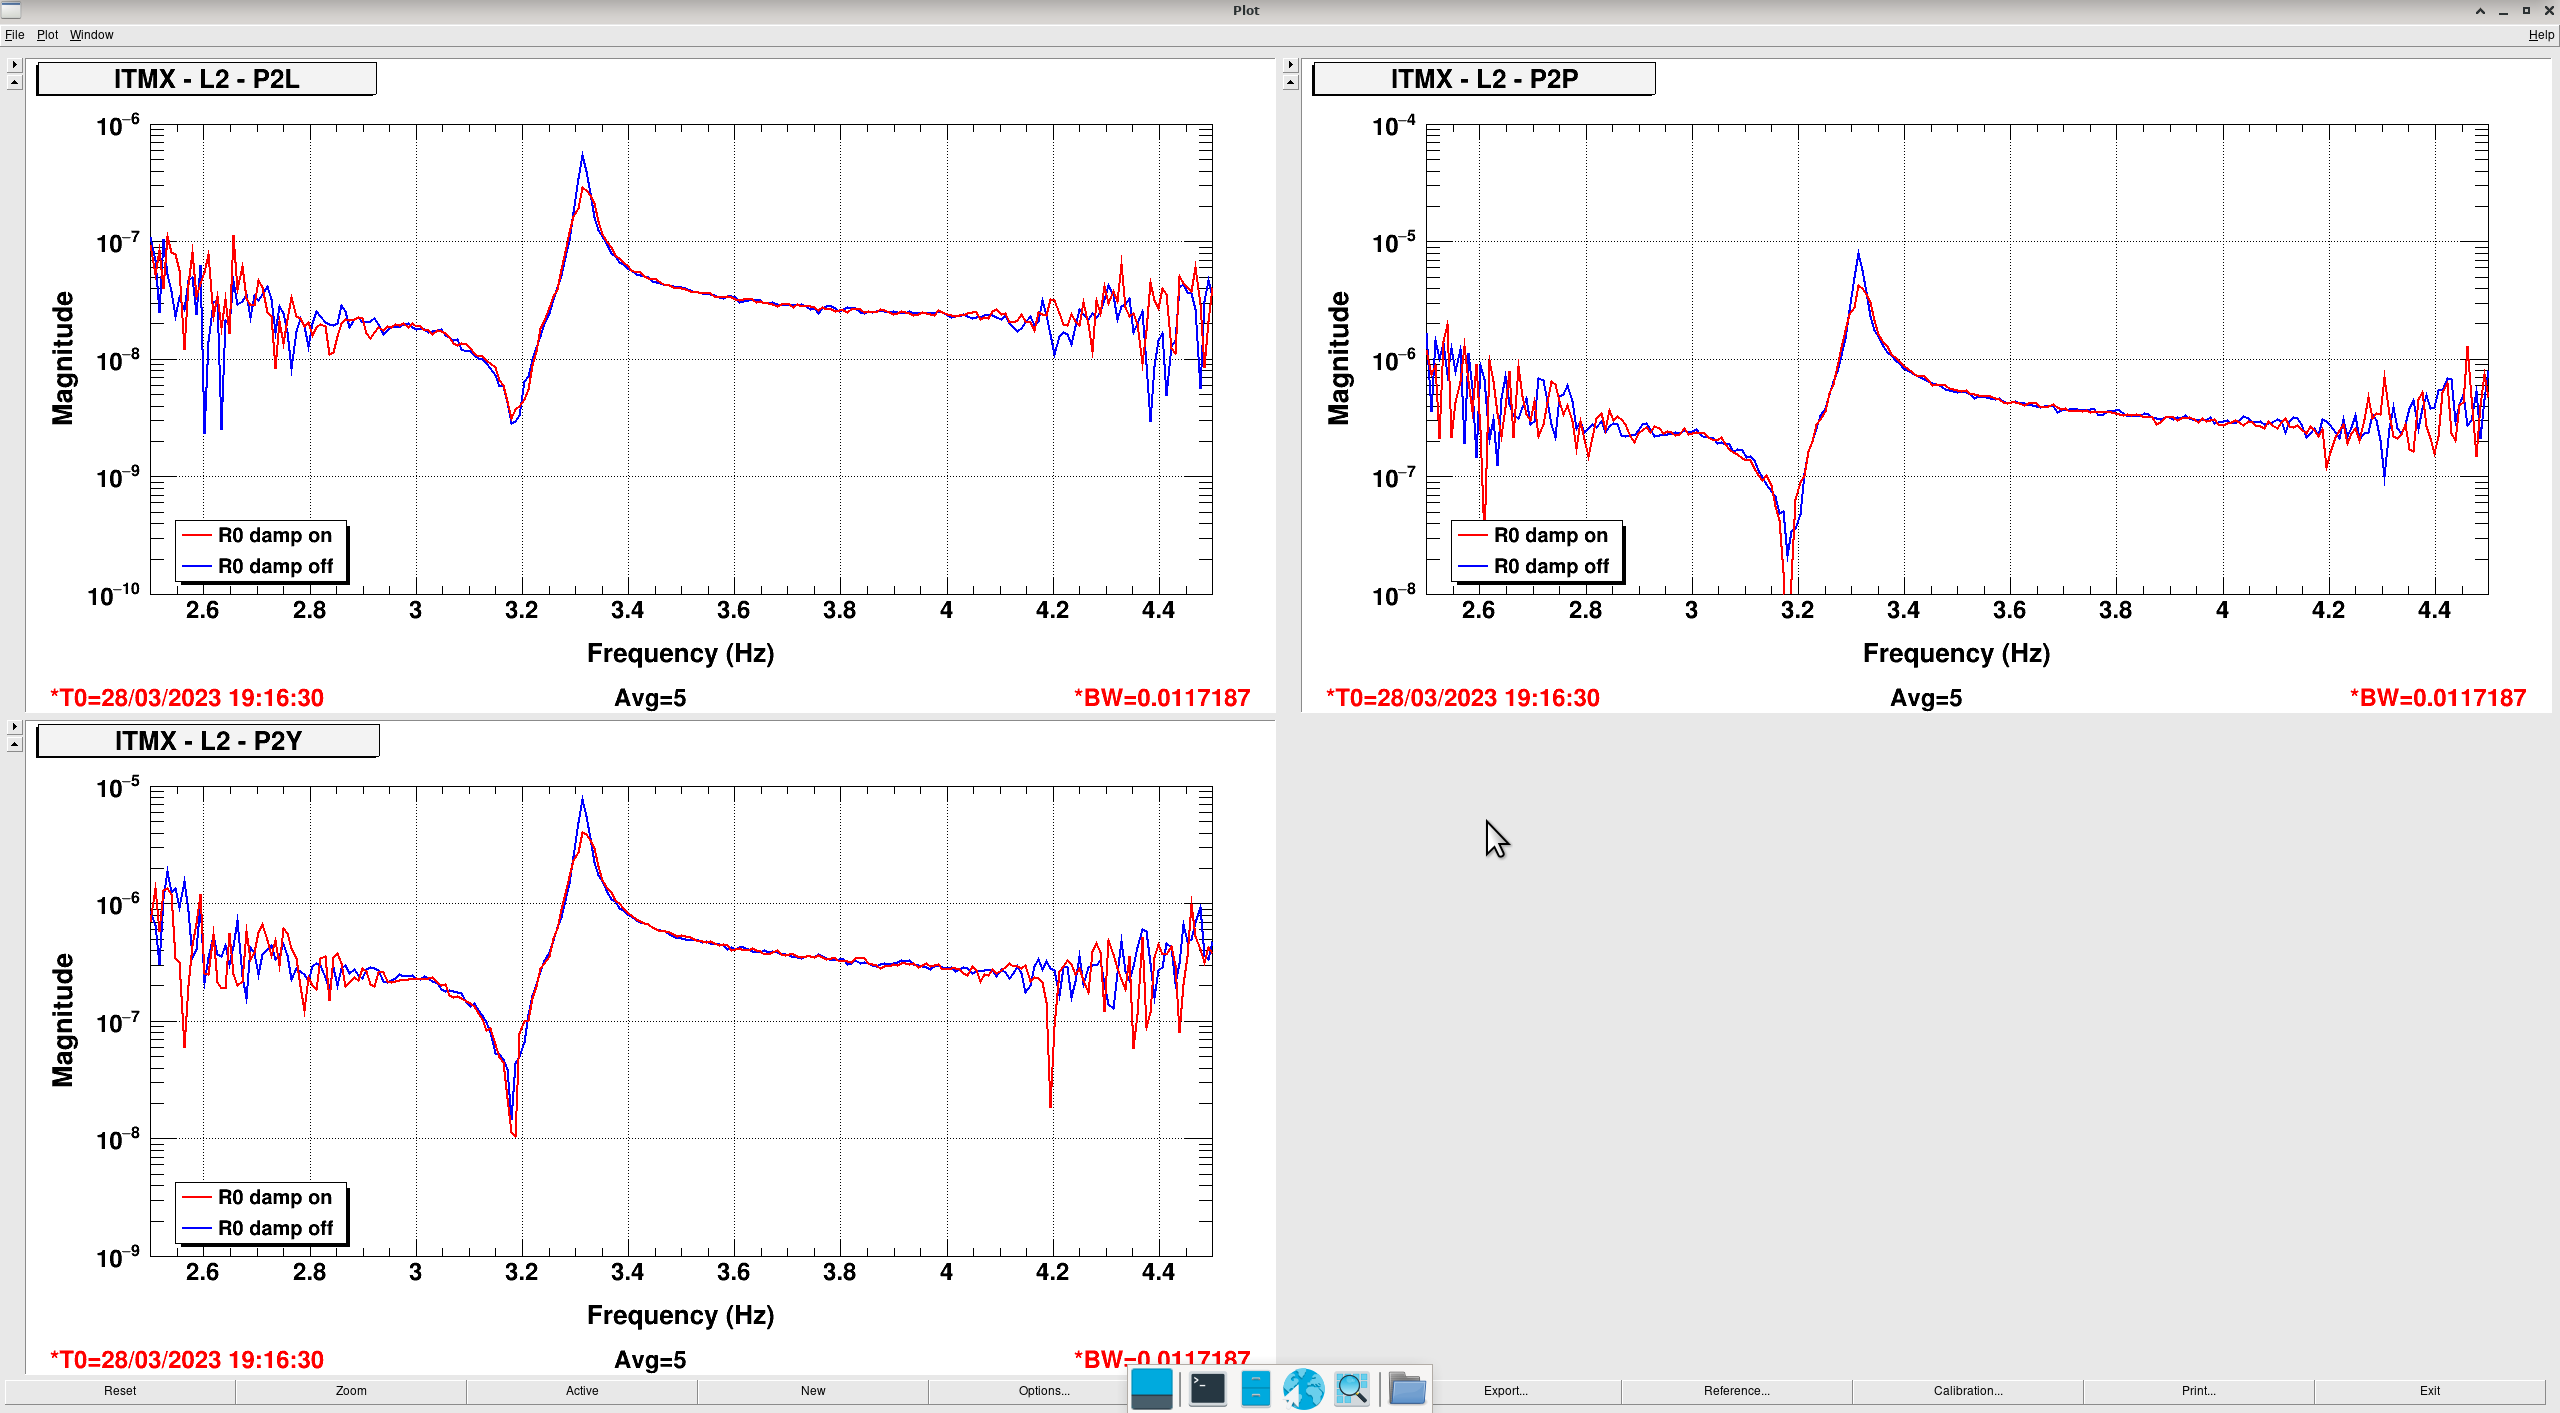
To complement this alog, attached are the transfer functions measured by the L2 stage osems for given a pitch excitation, comparing R0 damping on vs off, for the 4 quads and the 3 witness dofs (L, P, Y). Since the P excitation channel is not recorded, I used the MASTER OUT from the LL osem as the DQ excitation reference. The three subplots on each graphs show the L2_WIT_{L,P,Y}/LL_MASTER_OUT_DQ TF.
Results:
ITMs: fig1 and fig2
As Elena points out, ITMs R0 damping works fine at 3.31Hz see . Gain can be increased if necessary.
ETMs: fig3, and fig4
For the ETMs, there is some reduction at 3.18Hz, but the loop is also injecting 3.4Hz in the L/Y dof. I would argue that we should turn R0 damping off, until retuned at the correct frequency (3.18Hz), as it may be adding some unecessary noise while chasing the real 3.4Hz culprit.
L2 PIT excitation times (03/28, all UTC):
| ITMX | ITMY | ETMX | ETMY | |
| damping off | 19:02->19:15 | 19:04->19:15 | 19:26->19:29:40 | 19:35:48->19:38:38 |
| damping on | 19:16:30->19:26:30 | 19:18:30->19:28:30 | 19:43:43->19:46:34 | 19:43:24->19:46:10 |