louis.dartez@LIGO.ORG - posted 01:11, Thursday 30 March 2023 - last comment - 11:39, Friday 31 March 2023(68267)
pyDARM-generated calibration status
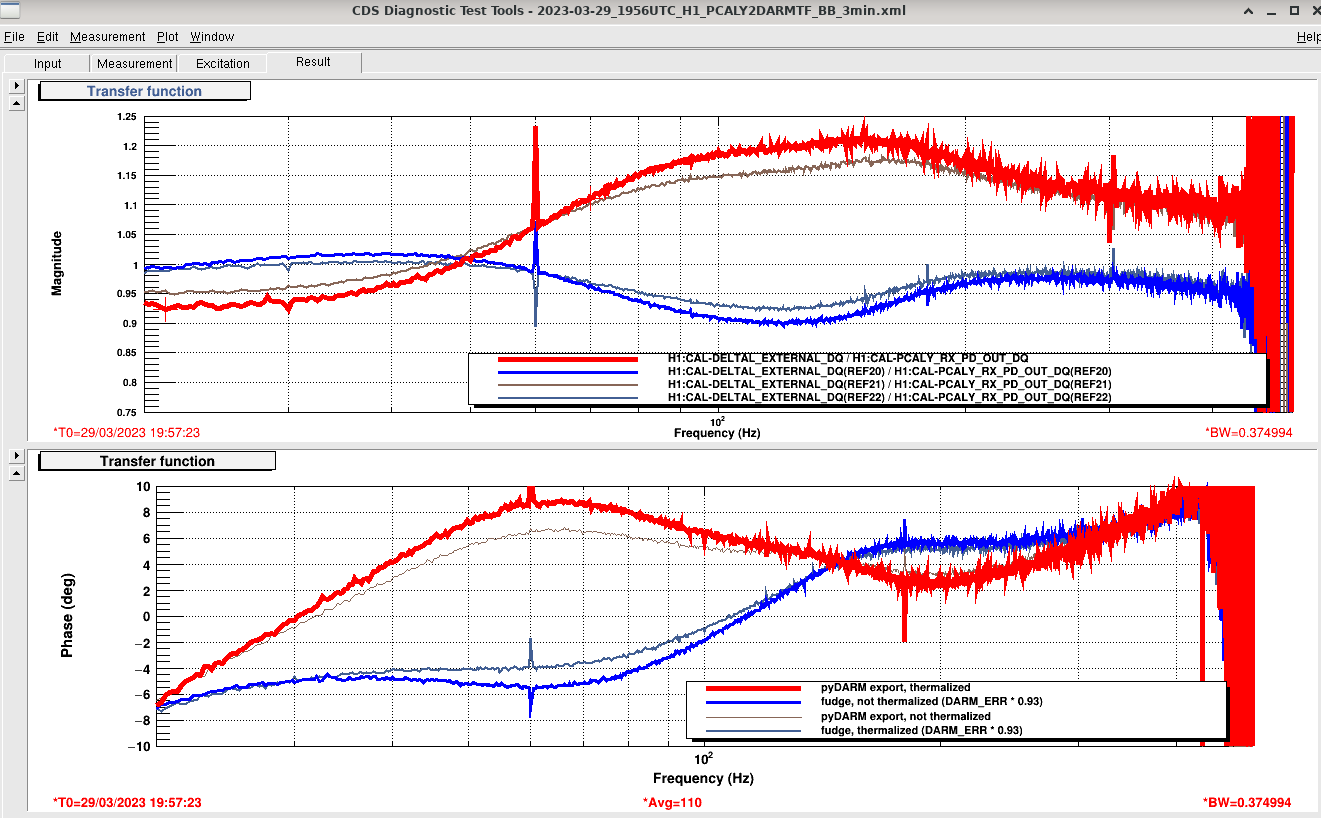
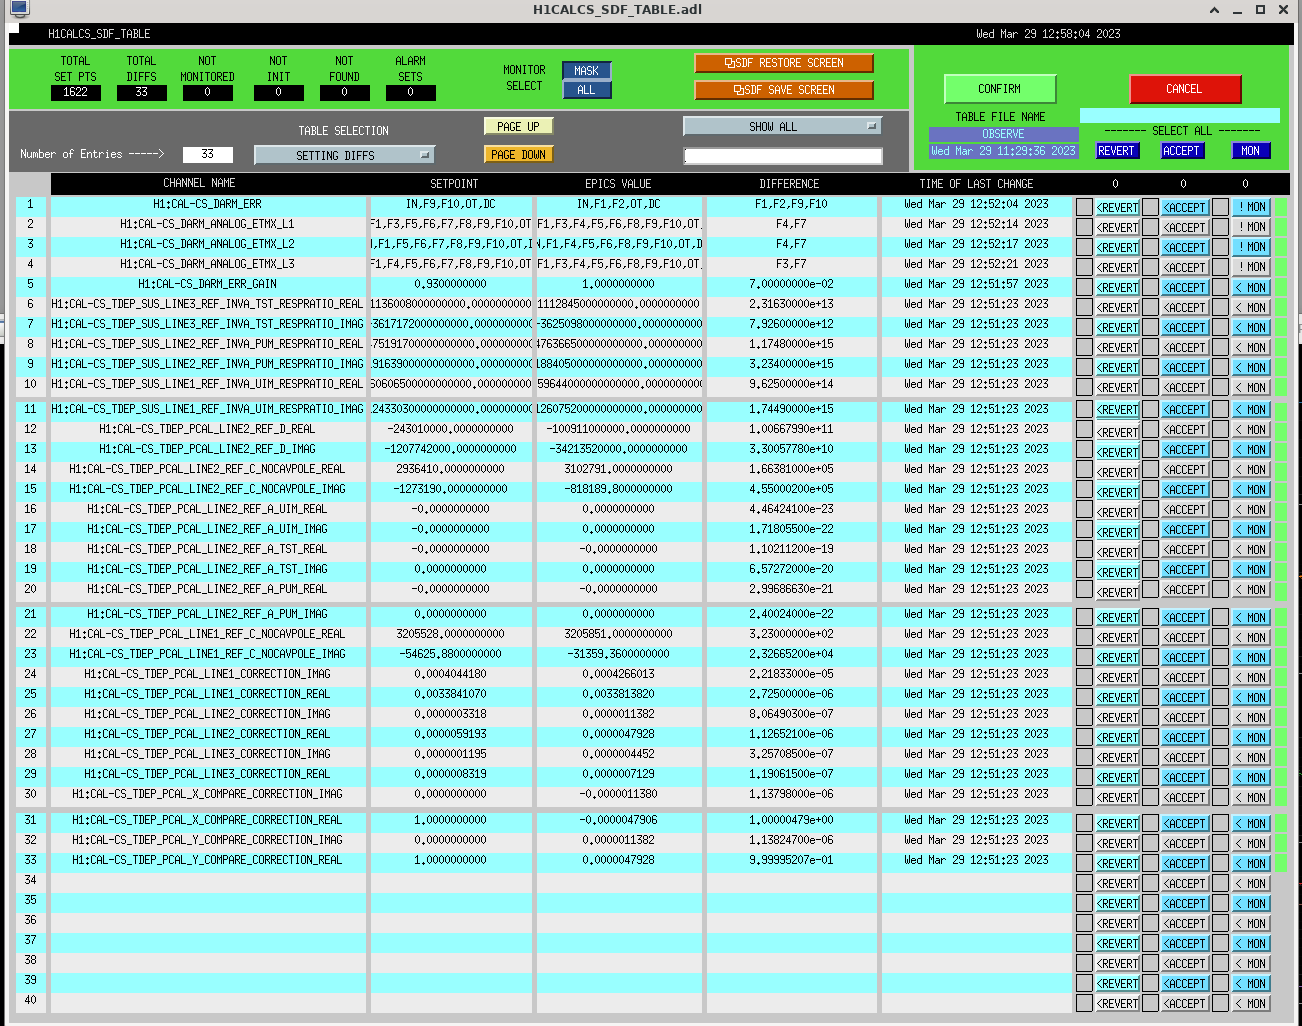
J. Kissel, L. Dartez We took advantage of having a thermalized IFO this morning to grab a sweep of the sensing function and try pushing a new pyDARM-generated calibration to the CAL-CS. There is an issue with the calibration parameters that I've been exporting to the front end using pyDARM's export functionality. It's not clear yet whether the problem(s) lies with the calculations that pyDARM is performing or whether it's introduced when inverse sensing or actuation foton filters are generated. I'm looking into this. Hopefully we'll know more and will fix this very soon. For the status of the systematic error as pushed by pyDARM vs. the current best configuration take a look at the attached pcal2darm dtt screenshot. The screenshot shows four traces. The blue traces (Ref20 and Ref22) show the systematic error with Dan's fudge atH1:CAL-CS_DARM_ERR_GAINin place. Ref22 and Ref20 were taken with the IFO in a thermalized and unthermalized state, respectively. The pyDARM-exported calibration configuration, with >15% error between 1 kHz and 2 kHz, is shown on the red and brown (Ref21) traces. Since the fudged version is effectively better across the board, I reverted the settings generated with pyDARM after testing. As a future debugging reference I am attaching a screenshot of the EPICS records changed by pyDARM's export.pyDARM report
I am also attaching the pyDARM report (H1_calibration_report_20230329T175416Z.pdf)that I generated to review the sensing function measurement (page 1). Page 1 shows two bode plots comparing the sensing function against the pyDARM model. The left bode shows the sensing function taken by pyDARM (green), the model of the sensing function taken from the free parameters encoded in the pyDARM model parameter set (blue), and the model of the sensing function taken from the free parameters produced by the MCMC fit (orange). The bode plot on the right shows the sensing function divided by each of two models in their corresponding color. There's evidence of a SRCL detuning at ~9 Hz that isn't properly fit for. This will certainly contribute to the systematic error below 20 Hz by an appreciable amount. The report PDF includes various other useful plots including a history of the sensing function and actuation stages. There's a lot to be said about much of what's there. I'm leaving that to a future alog.pyDARM commands
There will be a better write up for this soon, but for now I will share the pyDARM commands that I used to take cal measurements and process them. The pyDARM command line utility has been installed on all workstations and is accessible by anyone with control room access via the defaultcdsconda environment. To take a sensing function measurement I ranpydarm measure --run-headless sens pcal. This takes a DARM OLG measurement followed by a PCAL2DARM sweep headlessly. N.B. right now there will be a lot of terminal output that one can monitor for real time progress. It's difficult to parse and needs to be cleaned up, but it's stable. This mode was put in place to allow for calibration measurements to be run headlessly via a simple terminal without the need for real-time human attention (i.e. in the middle of the night). The resultant data will be placed in/ligo/groups/cal/data/H1/measurements/, organized by measurement type. The data is stored as a stripped DTT template. N.B. at present these files, which have been stripped of their plotting settings, references, and calibration TFs, will not appear sensible when opened by DTT. The data is valid when loaded via Python or other methods. This compatibility will be restored soon as part of the pre-ER15/O4 prep. To process the measurement, run the MCMC fits, and create a measurement pyDARM report runpydarm report. This will create a new report directory in/ligo/groups/cal/data/H1/reports/. The report id, which doubles as the report's directory name, is provided upon completion of the report generation. The attached H1_calibration_report_20230329T175416Z.pdf is one such report that I generated after this morning's measurements. On the workstations this file is located at/ligo/groups/cal/data/H1/reports/20230329T175416Z/H1_calibration_report_20230329T175416Z.pdf.
Images attached to this report
Non-image files attached to this report

Comments related to this report
I note that you can also access the report Louis is referring to by running
pydarm report -r 20230329T175416Zfrom the command line. You can also list all the reports with:
pydarm ls -r