jeffrey.kissel@LIGO.ORG - posted 17:16, Monday 03 April 2023 - last comment - 17:26, Monday 03 April 2023(68377)
Measured OMC DCPD Transimpedance Response While in Nominal Low Noise (w/ 10 mA): Response Is Not Different than When DCPDs are Dark. *Phew*
J. Kissel, K. Izumi
One of the remaining things to check off the calibration group worry list regarding the new OMC DCPD transimpedance amplifiers (TIA): "does the ~25 Hz complex pole pair response change between when the DCPDs are dark vs. when they have 10 mA of photocurrent?" After measuring the response the TIA during nominal low noise using the remote excitation system, I'm happy to report that (to the precision I was able to measure), the response does not appear to be different from the 2023-03-10 data set which informed the 2023-03-21 compensation filters.
The IFO configuration at the start and throughout the measurement:
- 60 W input power, and been there for ~2 hours at the start of these measurements,
- measured while team TCS/ASC is moving spot positions but the photo current is servoed to stay at 10 mA
- SQZ system is OFF
- I ramped over DARM sensing entirely to one DCPD (say, DCPD A), then turned on the remote excitation relay and drove the other (in that case, DCPD B).
Attached are the following results with the out-of-loop DCPDs in two different configurations:
(1) 2023-04-03_H1_TIAOnlyWhOFF_OMCA_S2100832_S2300003_DCPDAandB_RemoteTextChainEXC.png
With all digital frequency response compensation OFF (NewV2A, New AW, and A2mA), as well as the analog whitening OFF, such that only the drive electronics (flat up to ~500 Hz), the sensing anti-aliasing filters (flat up to ~500 Hz), and the analog TIA response are included. Here, we expect to see the < 500 Hz response of the TIA, and we see there's no legible difference between the reference traces (taken with NO light), and the live traces (taken in nominal low noise with 10 [mA] of light). I say "no legible difference" because the plot spans a couple of orders of magnitude, and we're look for ~1 level precision on our statements.
I would normally export from DTT and divide the two "offline," but I can do the equivalent thing more quickly:
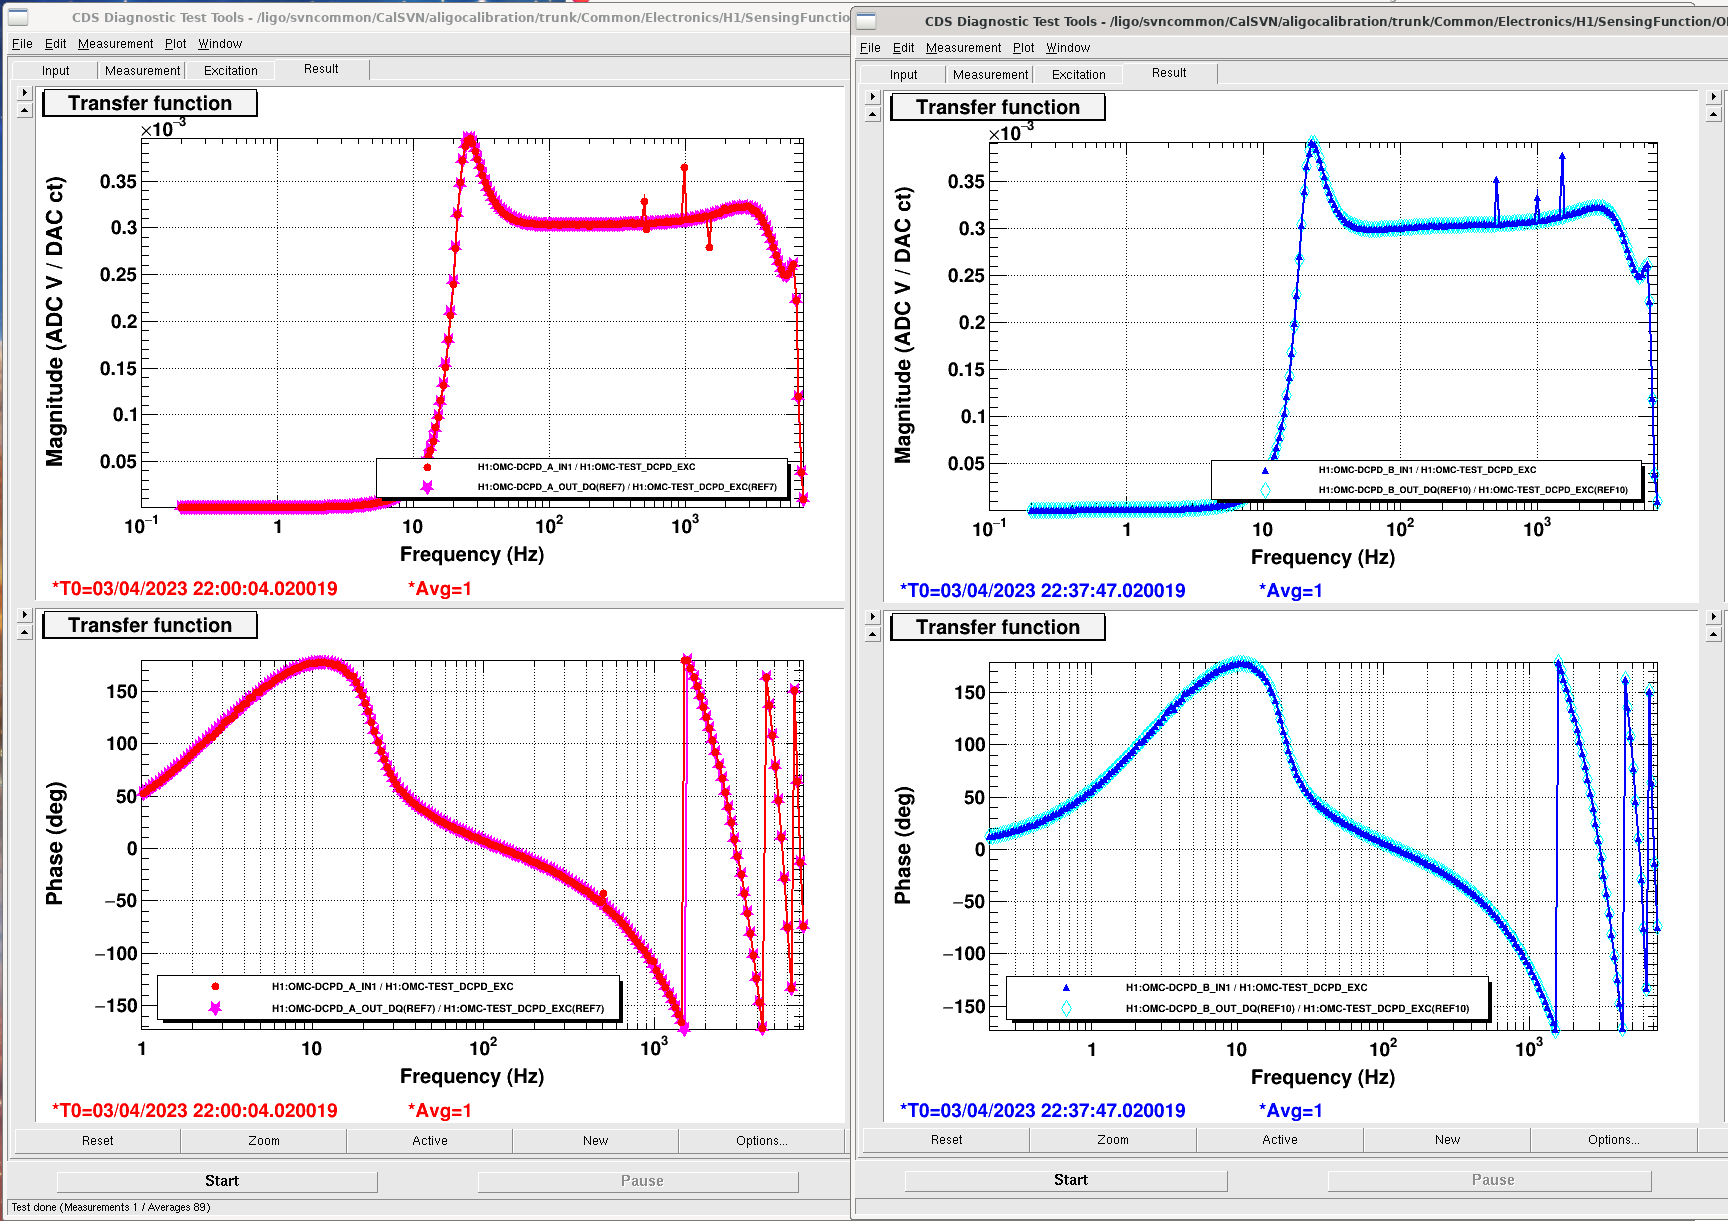
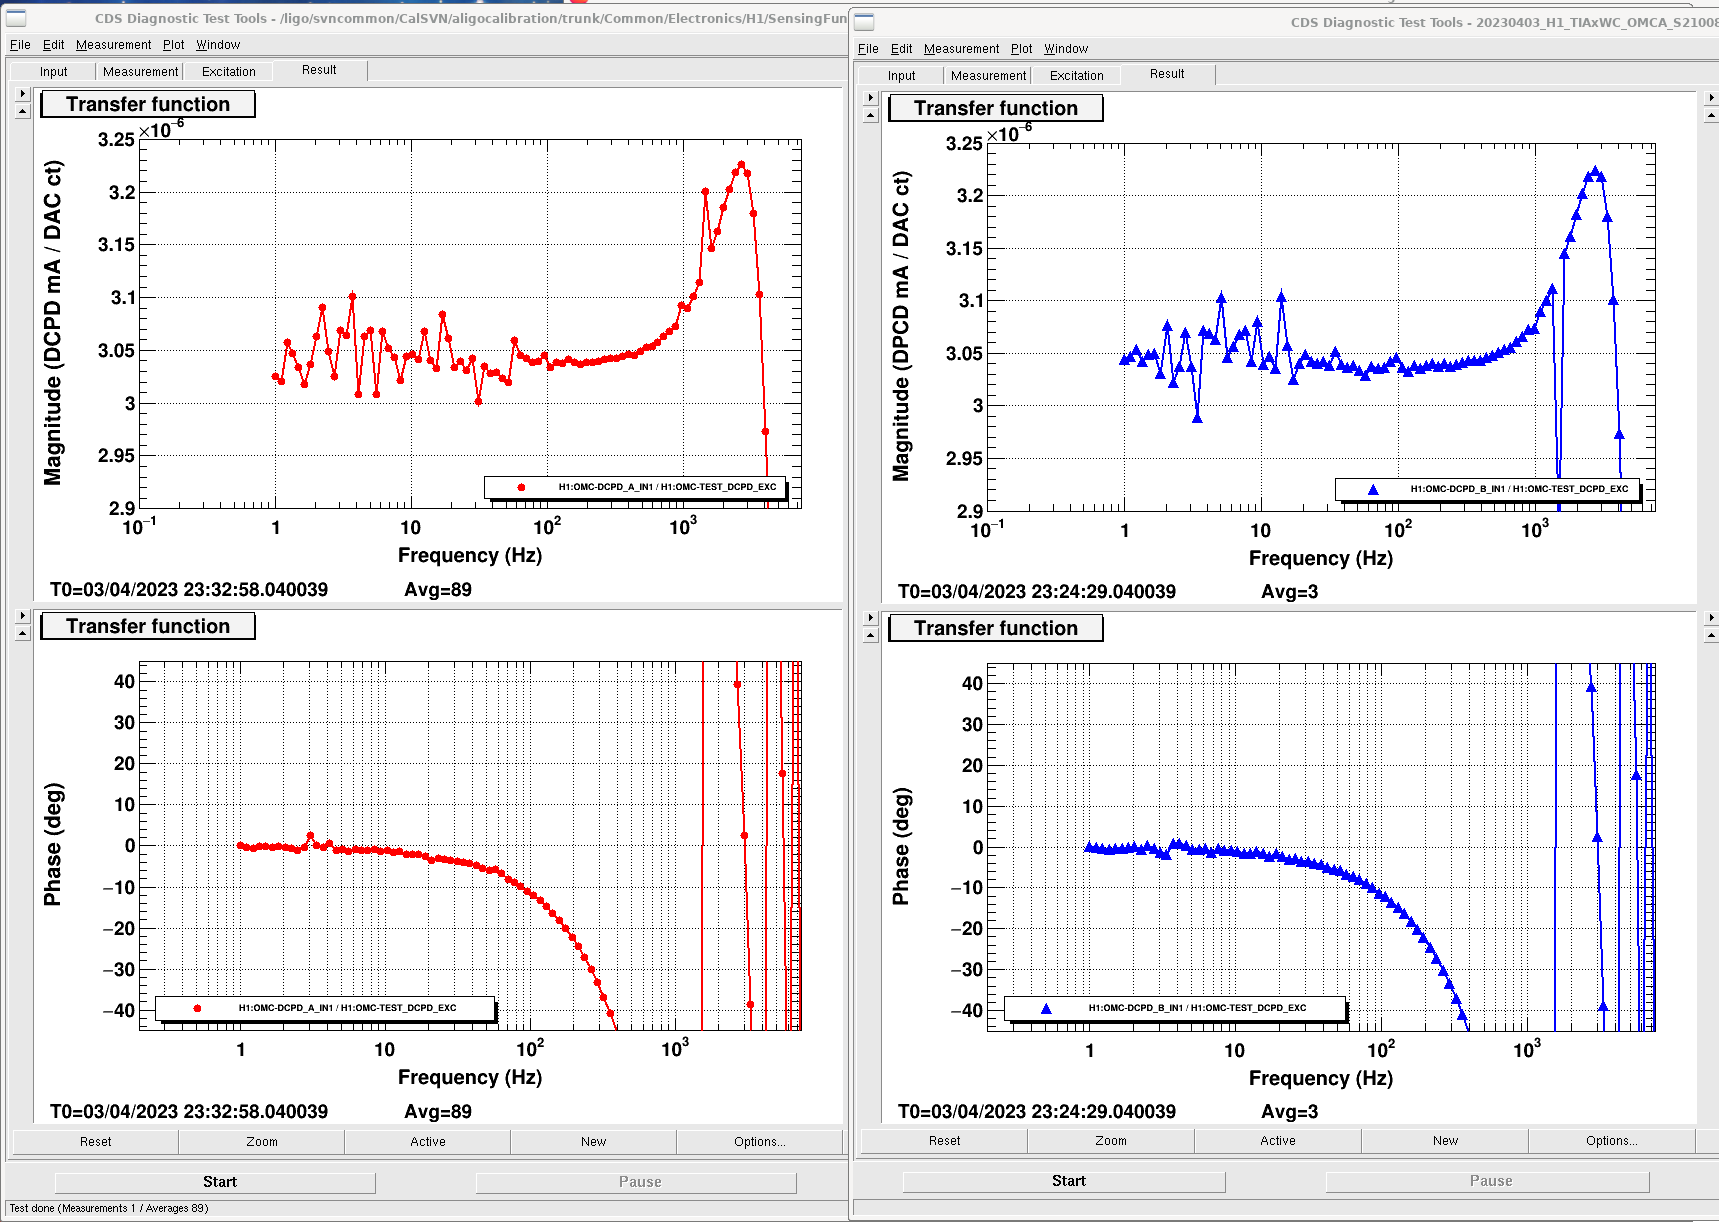
(2) 2023-04-03_H1_TIAxWC_20230321CompON_OMCA_S2100832_S2300003_DCPDAandB_RemoteTextChainEXC.png
In the nominal configuration, with the TIA and Whitening ON, and the 2023-03-21 compensation ON. Thus, this is a comparison between the reference, 2023-03-10 data (taken with NO light), and today's data with 10 mA of light. With the compensation ON, all low frequency response (or at least what was fit from the 2023-03-10 data) has been divided out, so we expect perfectly flat below ~500 Hz. And now, we can make the statement that there's no change in response quantitatively, since the data shows that this product of current data and 2023-03-21 compensation is "noisy flat," where the noise is at the (3.10e-6 - 3.05e-6) / 3.05e-6 = 0.016 = 1.6% level. The lack of phase features reinforce this "the compensation is good" probably to even higher precision.
*phew* one less thing to worry about!
Images attached to this report
Comments related to this report
The data templates for these measurements live here:
/ligo/svncommon/CalSVN/aligocalibration/trunk/Common/Electronics/H1/SensingFunction/OMCA/Data/
    Whitening and Compensation OFF
    20230403_H1_TIAOnlyWhOFF_OMCA_S2100832_S2300003_DCPDA_RemoteTestChainEXC.xml
    20230403_H1_TIAOnlyWhOFF_OMCA_S2100832_S2300003_DCPDB_RemoteTestChainEXC.xml

    Whitening and Compensation ON
    20230403_H1_TIAxWC_OMCA_S2100832_S2300003_DCPDA_RemoteTestChainEXC.xml
    20230403_H1_TIAxWC_OMCA_S2100832_S2300003_DCPDB_RemoteTestChainEXC.xml

Note, for the former two data sets, I grabbed the entire 251 point frequency vector from 0.2 to 7444 Hz. This is the same as the previous 2023-03-21 data set against which I wanted to divide directly without the hassle / confusion of interpolation, and -- because I wasn't *super* confident that that the excitation wouldn't kill the lock stretch at the start, and thus was nervous about the excitation amplitude while in nominal low noise -- I added a 5.0 sec ramp time on the *template*, which (I've since found out) supersedes the control of integration cycle, integration time, and averages *for each data point.* So, even though the number of averages per point was only 3 and the integration time was only 0.1 sec, each high frequency data point still took ~5-6 seconds to come in. Yuck! ~20-30 minutes later...

Thus, for the latter two data sets , I took only 89 data points from 1.0 to 7444 Hz, and reduced the template ramp time to 1.0 seconds.

This should be sufficient for future quick checks to prove that this test is not just anecdotally true once in time.