craig.cahillane@LIGO.ORG - posted 13:25, Tuesday 04 April 2023 (68401)
Arm power from mod depth up down test results on April 4, 2023
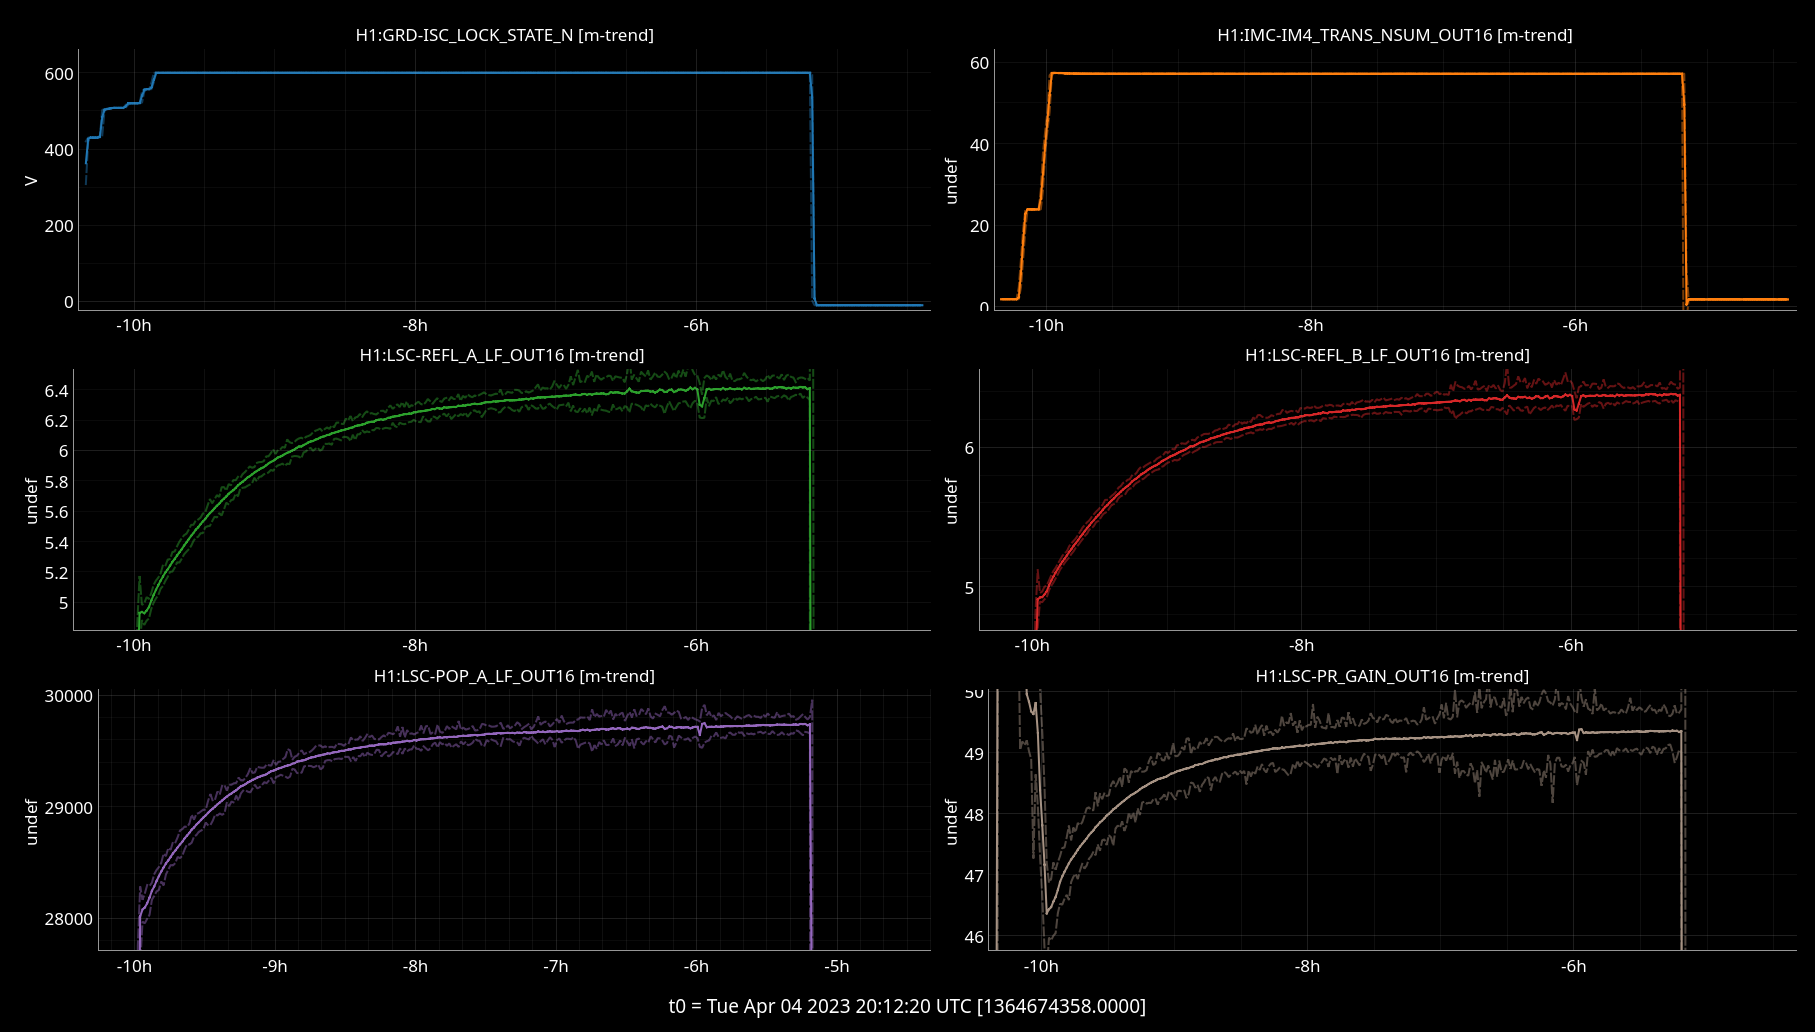
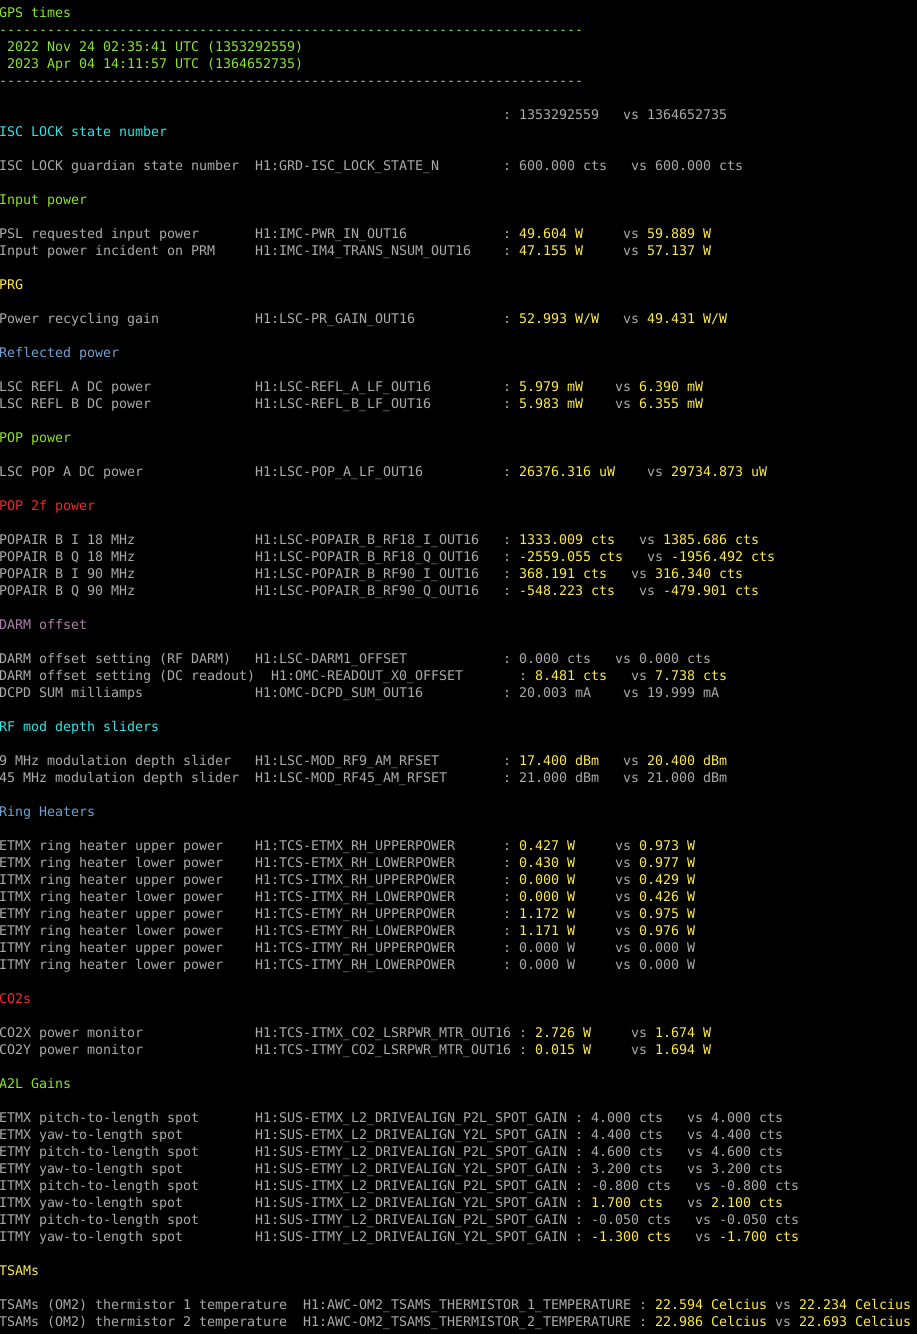
This morning I repeated the mod depth up down test from Nov 2022, (alogs alog 66015) and the analysis (alog alog 66432). Lots of things have changed between April 2023 and November 2022, including the input power, PRG, ring heaters, C02s, and the ITMX and ITMY yaw spot positions. See PNG 2 for the output of thermal_state_capture at the end for the comparison between April 2023 and Nov 2022. Most recently, the reflected power on the LSC REFL PDs went down from around 8.4 to 6.4 mW after the most recent ETM ring heater increases on March 28. Thermalization also has a major effect on reflected power every lock, with LSC REFL A power going from 4.9 mW to 6.4 mW in the lock analyzed here (see PNG 1)Analysis
The IFO carrier reflection is 6.0 % according to LSC REFL A and B. The arm power inferred from this reflection is 365 kW. The arm round trip loss (assuming no PRM losses) is 67 ppm. See PDF 2. This was found using the same analysis as alog 66432, with the following parameters:lsc_refl_a = 6.390e-3 # W lsc_refl_b = 6.355e-3 # W carrier_in_refl = 0.889 input_power = 57.137 # W carrier_in_input = 0.972 input_to_lsc_refl_pd_efficiency = 0.00168 # from alog 63510Mod Depth Calibration
The ratios are calculated assuming our old calibrations of the mod depth in rad/V (alog 62883) are still 0.218 / dbm_to_volts(23.0) for 9 MHz, and 0.278 / dbm_to_volts(26.8) for 45 MHz. 23.0 and 26.8 are the RF slider values in dBm, and are converted to voltage.Power ratios
Here are the power ratios at each port (PDF 1).
| Channels | 9 MHz | 45 MHz | Carrier |
|---|---|---|---|
| H1:IMC-IM4_TRANS_NSUM_OUT16 | 0.013 | 0.015 | 0.972 |
| H1:LSC-REFL_A_LF_OUT16 | 0.056 | 0.055 | 0.889 |
| H1:LSC-REFL_B_LF_OUT16 | 0.055 | 0.051 | 0.894 |
| H1:LSC-POP_A_LF_OUT16 | 0.019 | 0.010 | 0.971 |
| H1:ASC-POP_A_NSUM_OUT16 | 0.019 | 0.010 | 0.971 |
| H1:ASC-POP_B_NSUM_OUT16 | 0.019 | 0.010 | 0.971 |
| H1:ASC-AS_C_NSUM_OUT16 | 0.148 | 0.573 | 0.279 |
| H1:ASC-OMC_A_NSUM_OUT16 | 0.147 | 0.623 | 0.230 |
| H1:ASC-OMC_B_NSUM_OUT16 | 0.148 | 0.699 | 0.152 |
| H1:ASC-X_TR_A_NSUM_OUT16 | 0.005 | 0.007 | 0.988 |
| H1:ASC-X_TR_B_NSUM_OUT16 | 0.005 | 0.007 | 0.988 |
| H1:ASC-Y_TR_A_NSUM_OUT16 | 0.005 | 0.008 | 0.987 |
| H1:ASC-Y_TR_B_NSUM_OUT16 | 0.005 | 0.008 | 0.987 |
Images attached to this report
Non-image files attached to this report
