Eleonora, Xinghui
0. OFI suspension diagonalization attempt
The OFI suspension OSEM matrices turned out to be not diagonalized. We realized this while trying to perform noise injections in the longitudinal (L) and transverse (T) directions in order to study the effect of scattered light.
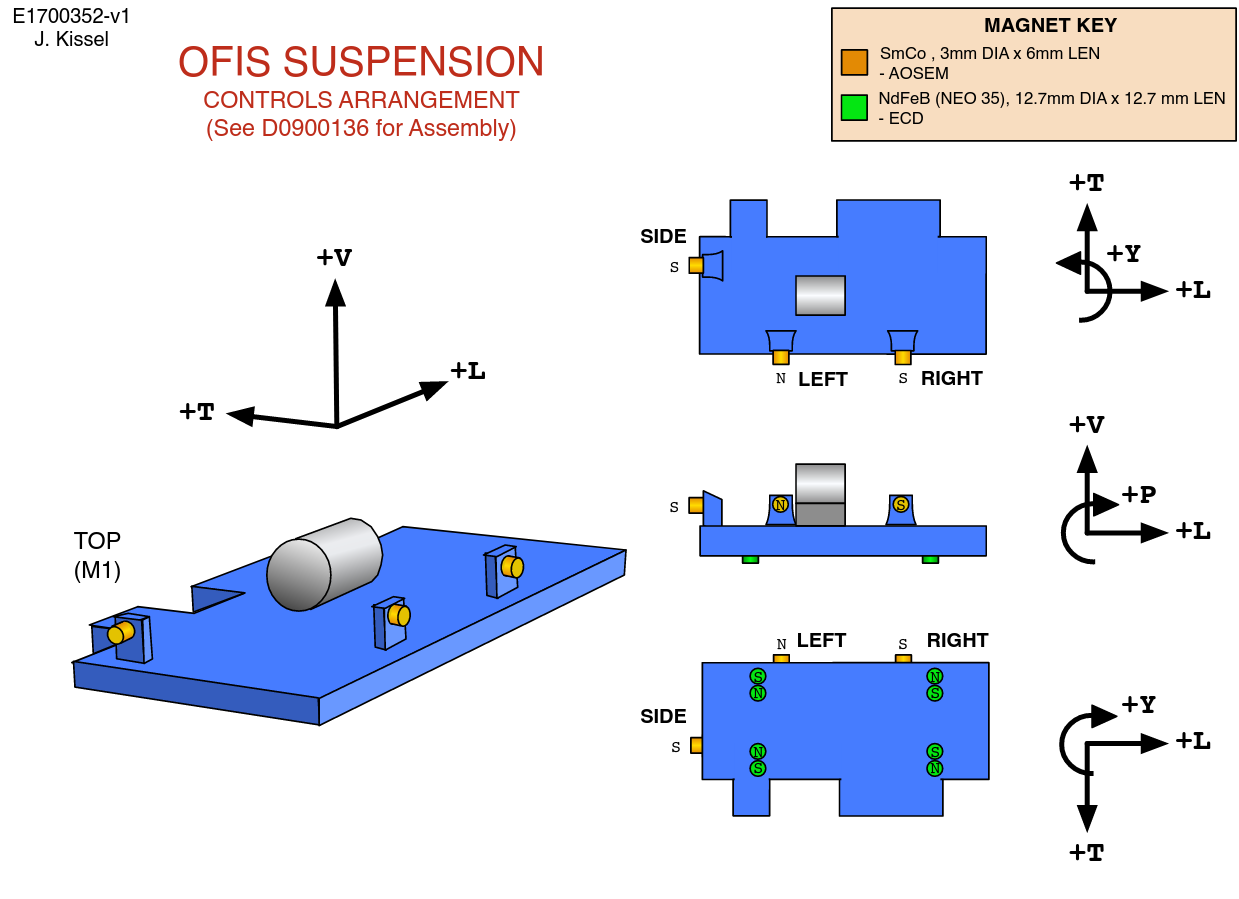
Refer to Fig. 1 for a schematic of the OFI axis and sensor definitions. The OFI is outfitted with three OSEMs: SD (side), LF (left) and RT (right). Linear combinations of these three OSEMs are used to drive and read out L,T and Y (Yaw, not used here). The transformation for driving L, T and Y is saved in the EUL2OSEM matrix, whereas the transformation to read-out in L,T and Y basis is saved in the OSEM2EUL matrix.
We sent noise to the OFI suspension coils at a frequency = 0.65Hz. This is true for the whole entry, unless explicitly mentioned.
By sending a current in L, we coupled in T by 20%. By sending a current in T, we excited L 5 times more than T.
We tried:
- to change the gains in the driving filters in L, T, Y to reduce the coupling by checking at the ndscope signals (H1:SUS-OFI_M1_DAMP_{L,T,Y}_INMON)
- to update the sensing matrix by computing a new matrix based on geometrical considerations
however, finding a configuration that acted on L only, didn't yield a decoupled T. Instead, driving T in this configuration resulted in read-out signals with equal amplitudes in L and T. We concluded that the computed L and T directions did not correspond to the true L and T directions.
Therefore, we decided to check more in detail the input/output. We set the sensing matrix (OSEM2EULER) in a way that we were directly reading the 3 coils LF (left), RT (right), SD (side) instead of L, T, Y: [ 1 0 0;
0 1 0;
0 0 1 ].
Then, we tried to drive only in the tranverse direction by sending an excitation to H1:SUS-OFI_M1_TEST_T_EXC in order to check the balancing between LF and RT wrt the COM and decouple them from L.
We set the driving matrix (EULER2OSEM) to be [ 0 -1 0;
0 1 0;
0 0 1 ] .
The minus sign is due to the fact that the magnets of the OSEMs have inverted poles (see Fig. 1). By changing the gain on the driver filters (H1: OFI M1 COIL OUTPUT FILTERS) we didn't improve the decoupling, so we left all the gains to 1.
The LF, RT, SD signals should be already calibrated in um.
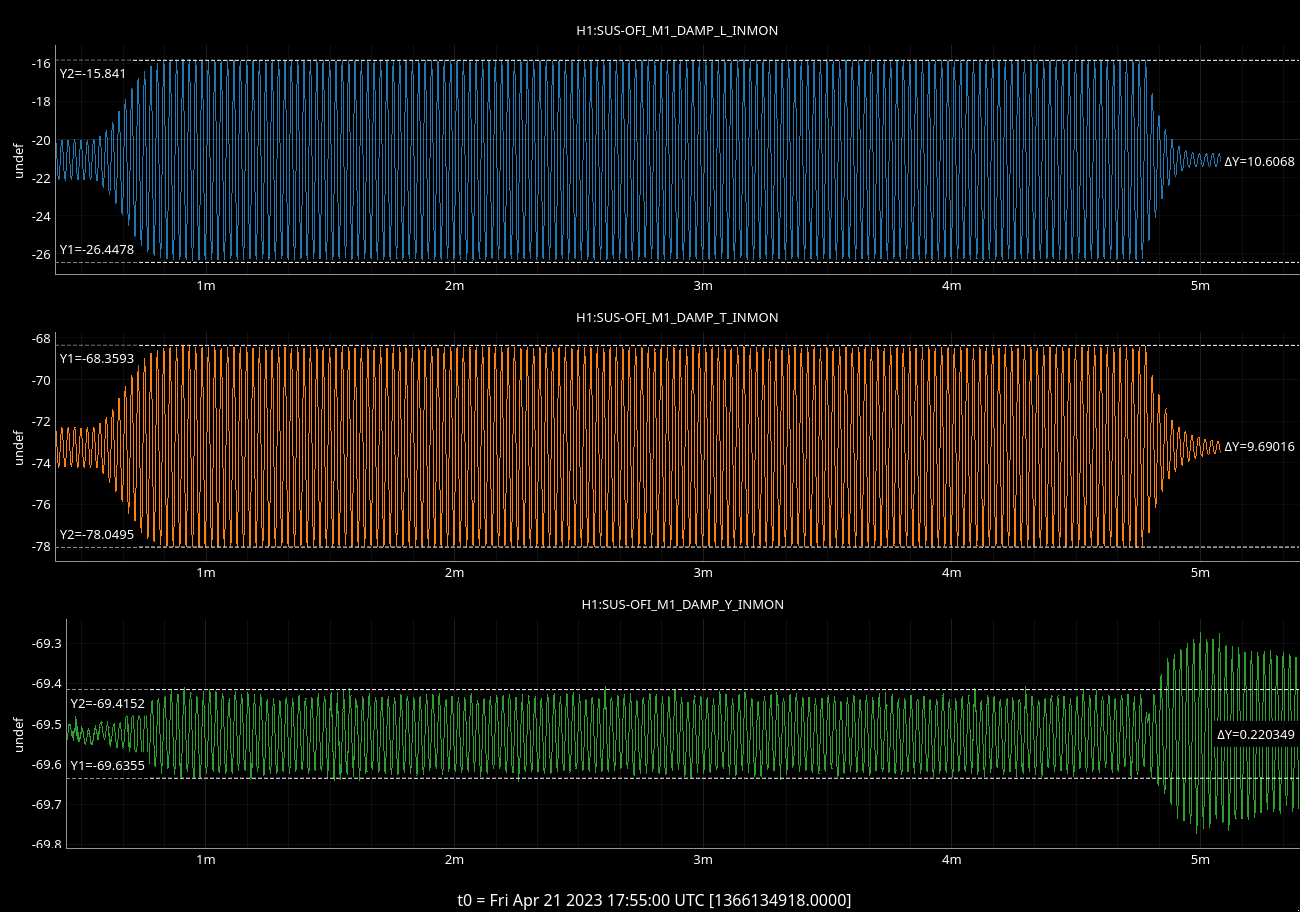
We measured first the residual motion sensed by the OSEMs without injecting noise: LF = 0.06 um, RT = 0.06 um, SD = 0.03 um).
Then we measured the residual coupling by sending a transverse signal with a gain of 5000: LF = 10.6 um, RT = 9.6 um, SD = 0.2 um. LF and RT are 10% coupled, while SD is couple 2% with LF and RT, which is good enough for our measurements.
In the following, we report 3 different OFI transverse shaking measurements.
1. OFI T shaking with SQZ (injection gain 5000)
During our diagonalization attempts, we noticed (thanks also to the commissioning team) an excess of noise between 6 and 15 Hz that we believe to be scattered light coming from the squeezing port.
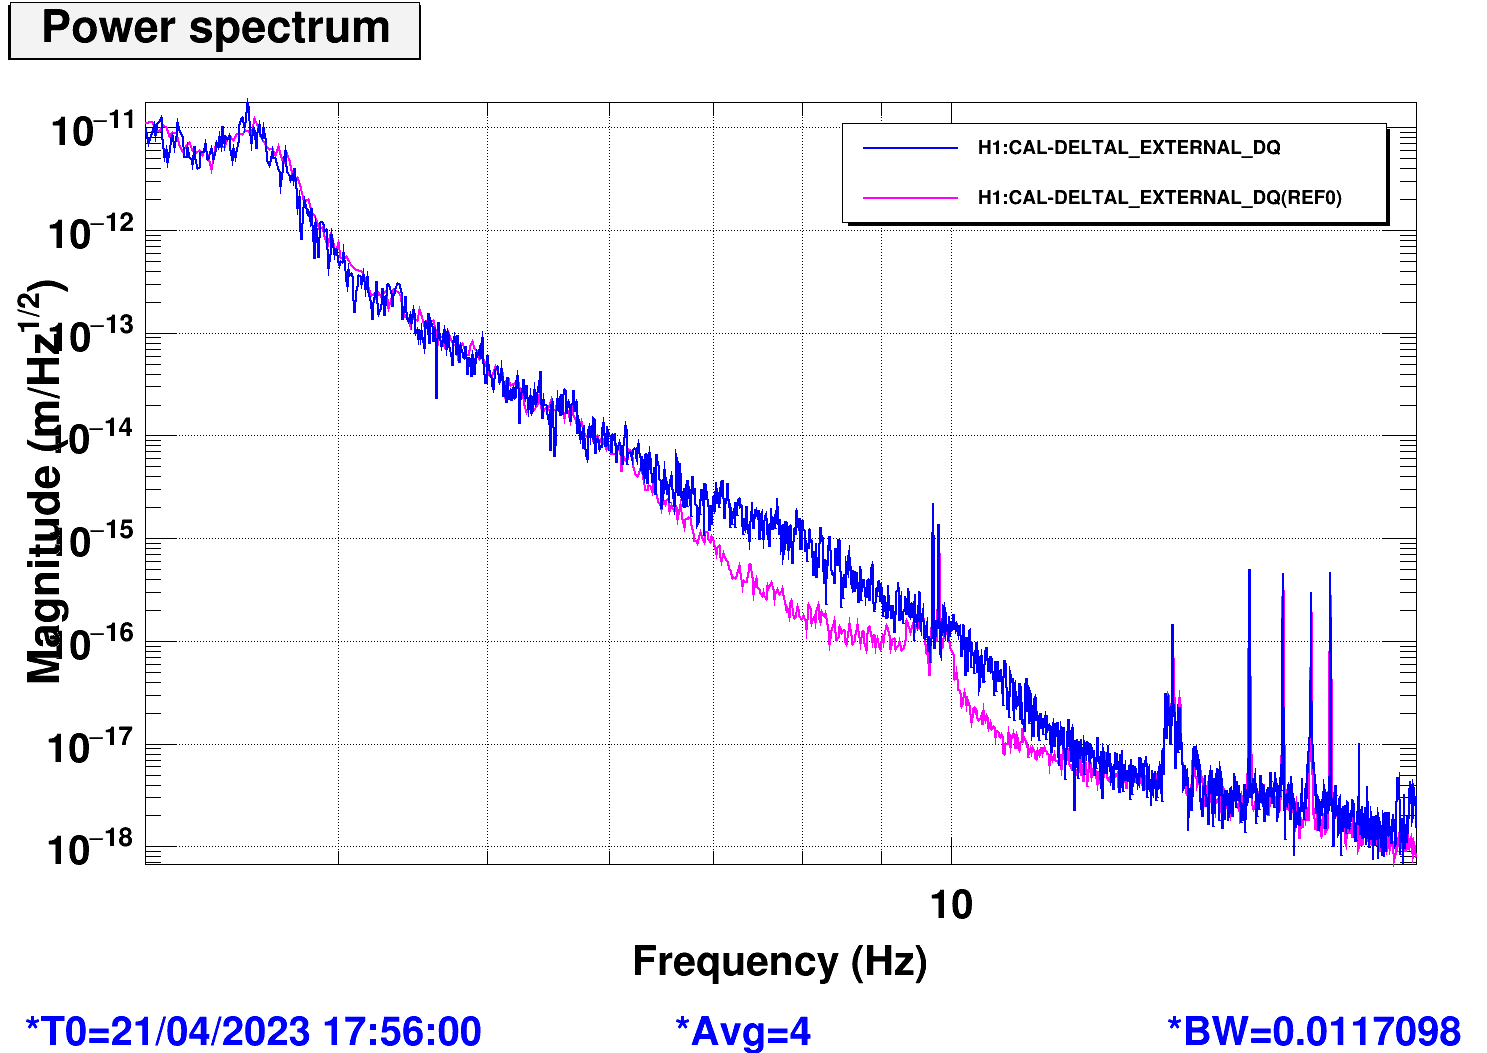
- The first evidence was between 17h55 UTC and 17h58 UTC, injecting noise on T with a gain of 5000. In Fig. 2, the signal read by ndscope (NB the plot channel names are INCORRECT due to the change of OSEM2EULER matrix mentioned in (0)) are shown. The effect of the scattering noise on DARM is shown in Fig. 3.
-
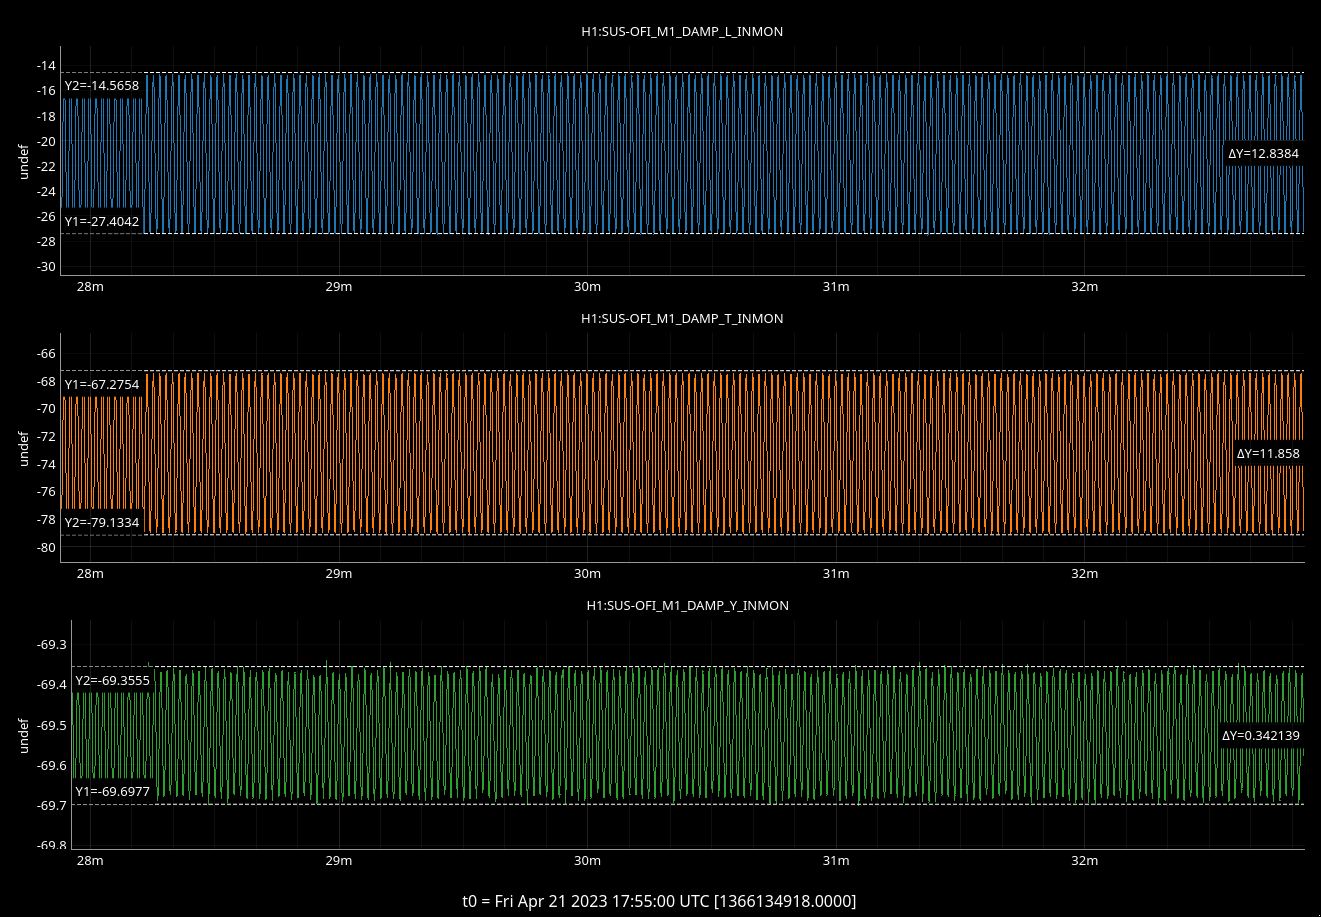
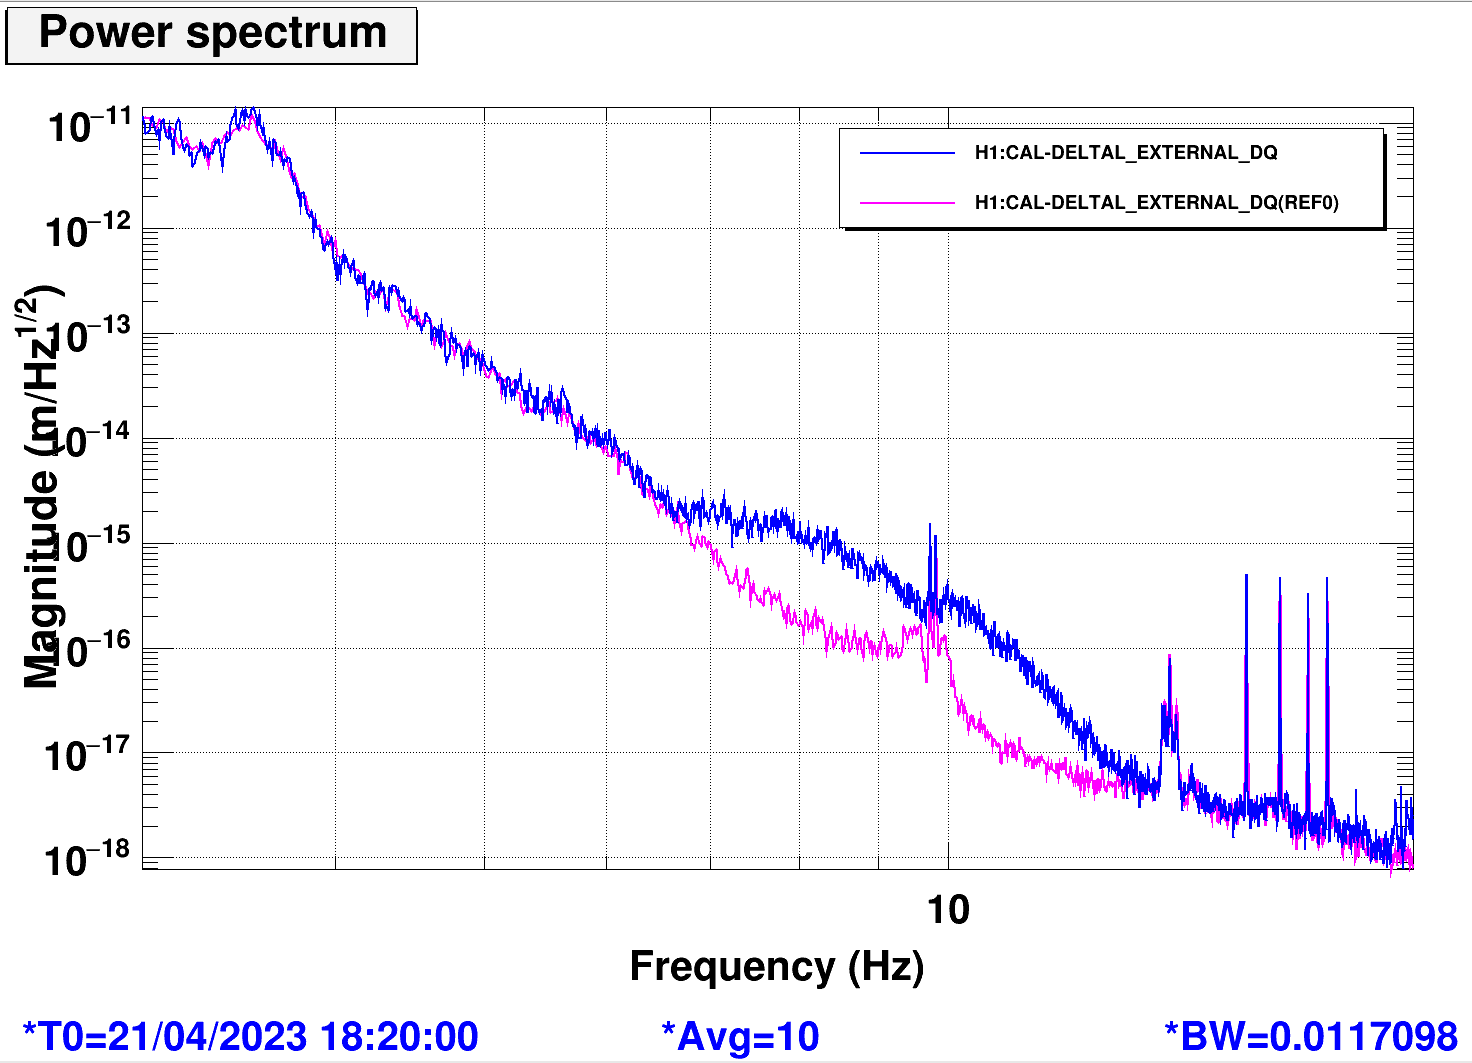
The second evidence was between 18h20 UTC and 18h30 UTC, injecting noise on T with a gain of 5000 and unbalancing the driver gains (gain_LF = -0.9, gain_RT = 1.5) to have a bigger amplitude: LF = 13.7 um, RT = 12.7 um, SD = 0.2 um. In Fig. 4 the signal read by ndscope (NB the plot channel names are INCORRECT due to the change of OSEM2EULER matrix mentioned in (0)) are shown. The effect of the scattering noise on DARM is shown in Fig. 5.
2. OFI shaking without SQZ (injection gain 15000)
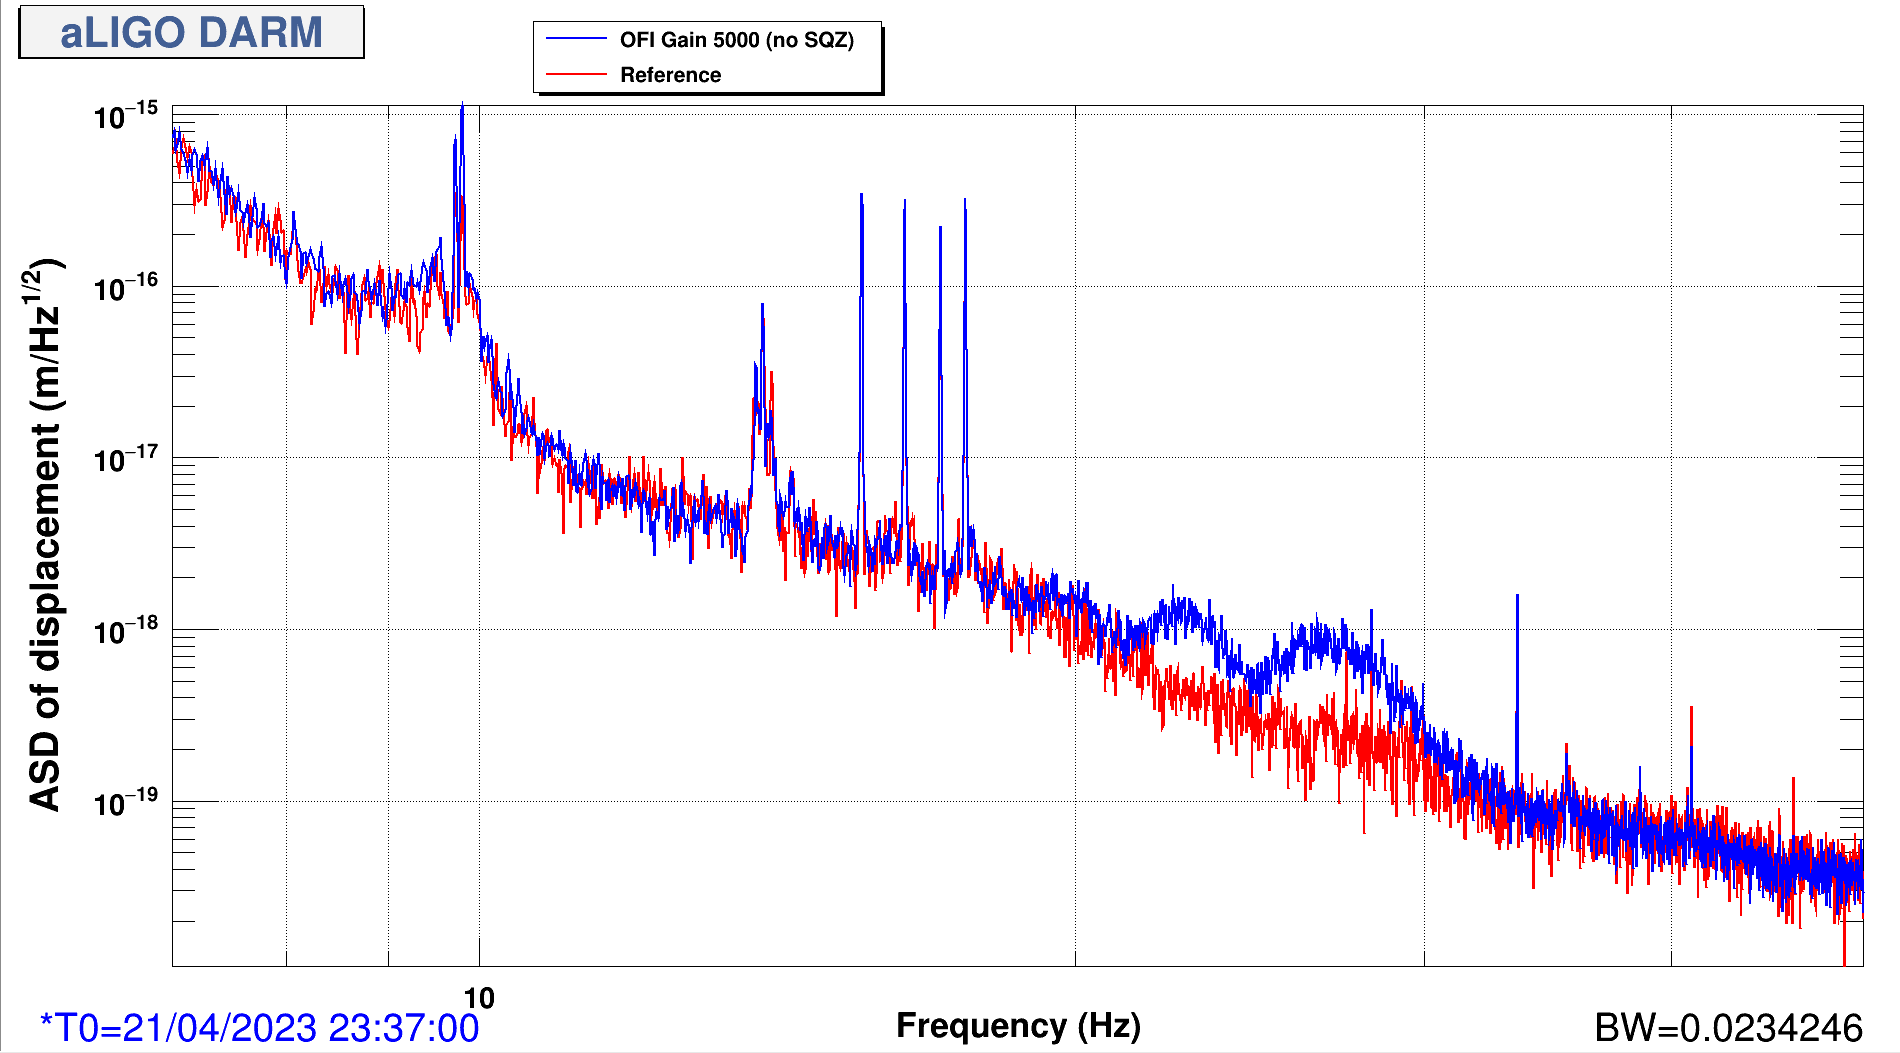
We did the same injection with a higher gain and saw a different response on DARM, which came out from the fact that SQZ was NOT injected in the interferometer.
We injected T noise with a gain of 15000, with balanced driving gains, corresponding to a motion of LF = 31 um, RT = 29 um, SD = 0.55 um.
The noise injection lasted from 23h37 UTC to 23h48 UTC.
Without squeezing injection, we don't see the same scattered light effect as with SQZ, but we introduce some noise between 20 and 30 Hz as shown in Fig. 6.
3. OFI shaking with SQZ with different injection gains
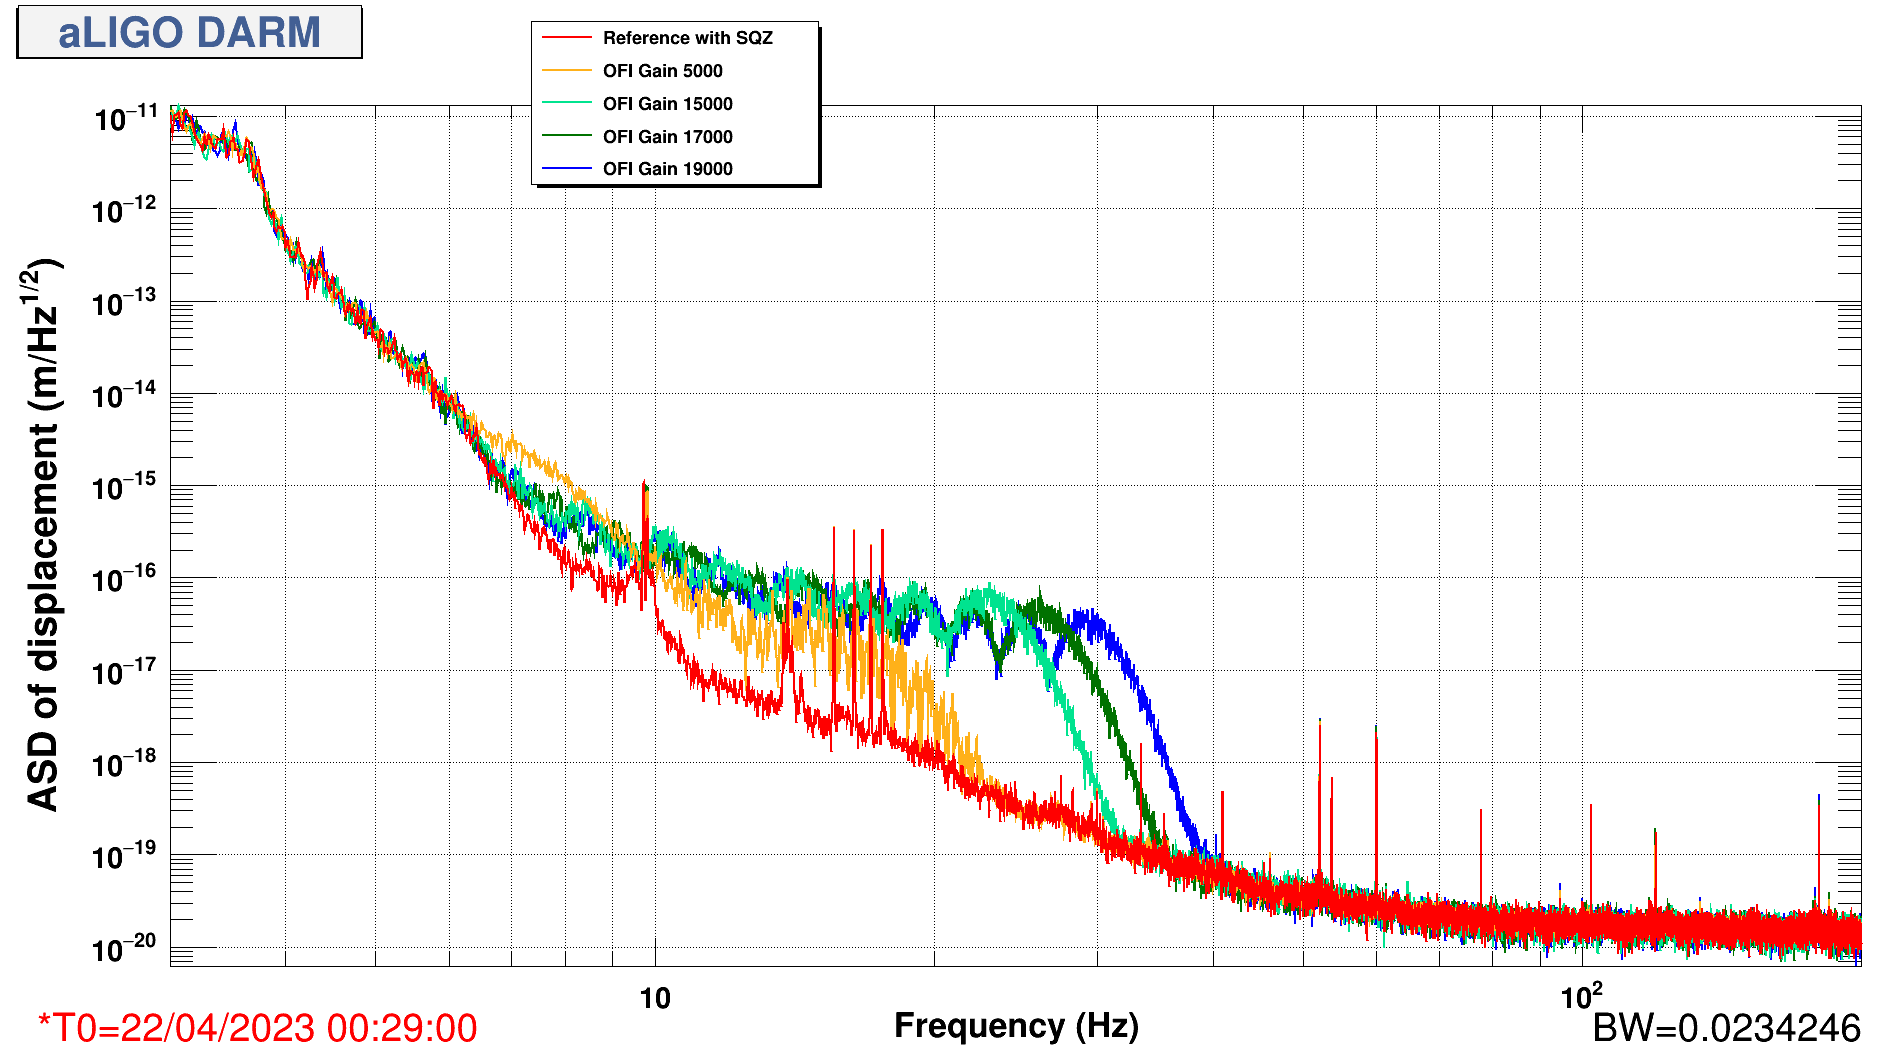
We performed this measurement for G = 5000, 15000, 17000 and 19000. The suspension was saturating for G = 20000. The results are shown in Fig. 7.
- G = 5000, corresponding to a motion in LF = 10.6 um, RT = 9.6 um and SD = 0.2 um ( yellow curve ), between 0h47m40 UTC and 0h57m40 UTC (22nd April 2023)
- G = 15000, corresponding to a motion in LF = 31 um, RT = 29 um and SD = 0.5 um ( mint curve ), between 1h01m20 UTC and 1h13m10 UTC (22nd April 2023)
- G = 17000, corresponding to a motion in LF = 35.5 um, RT = 32.5 um and SD = 0.6 um ( green curve ), between 1h13m15 UTC and 1h24m00 UTC (22nd April 2023)
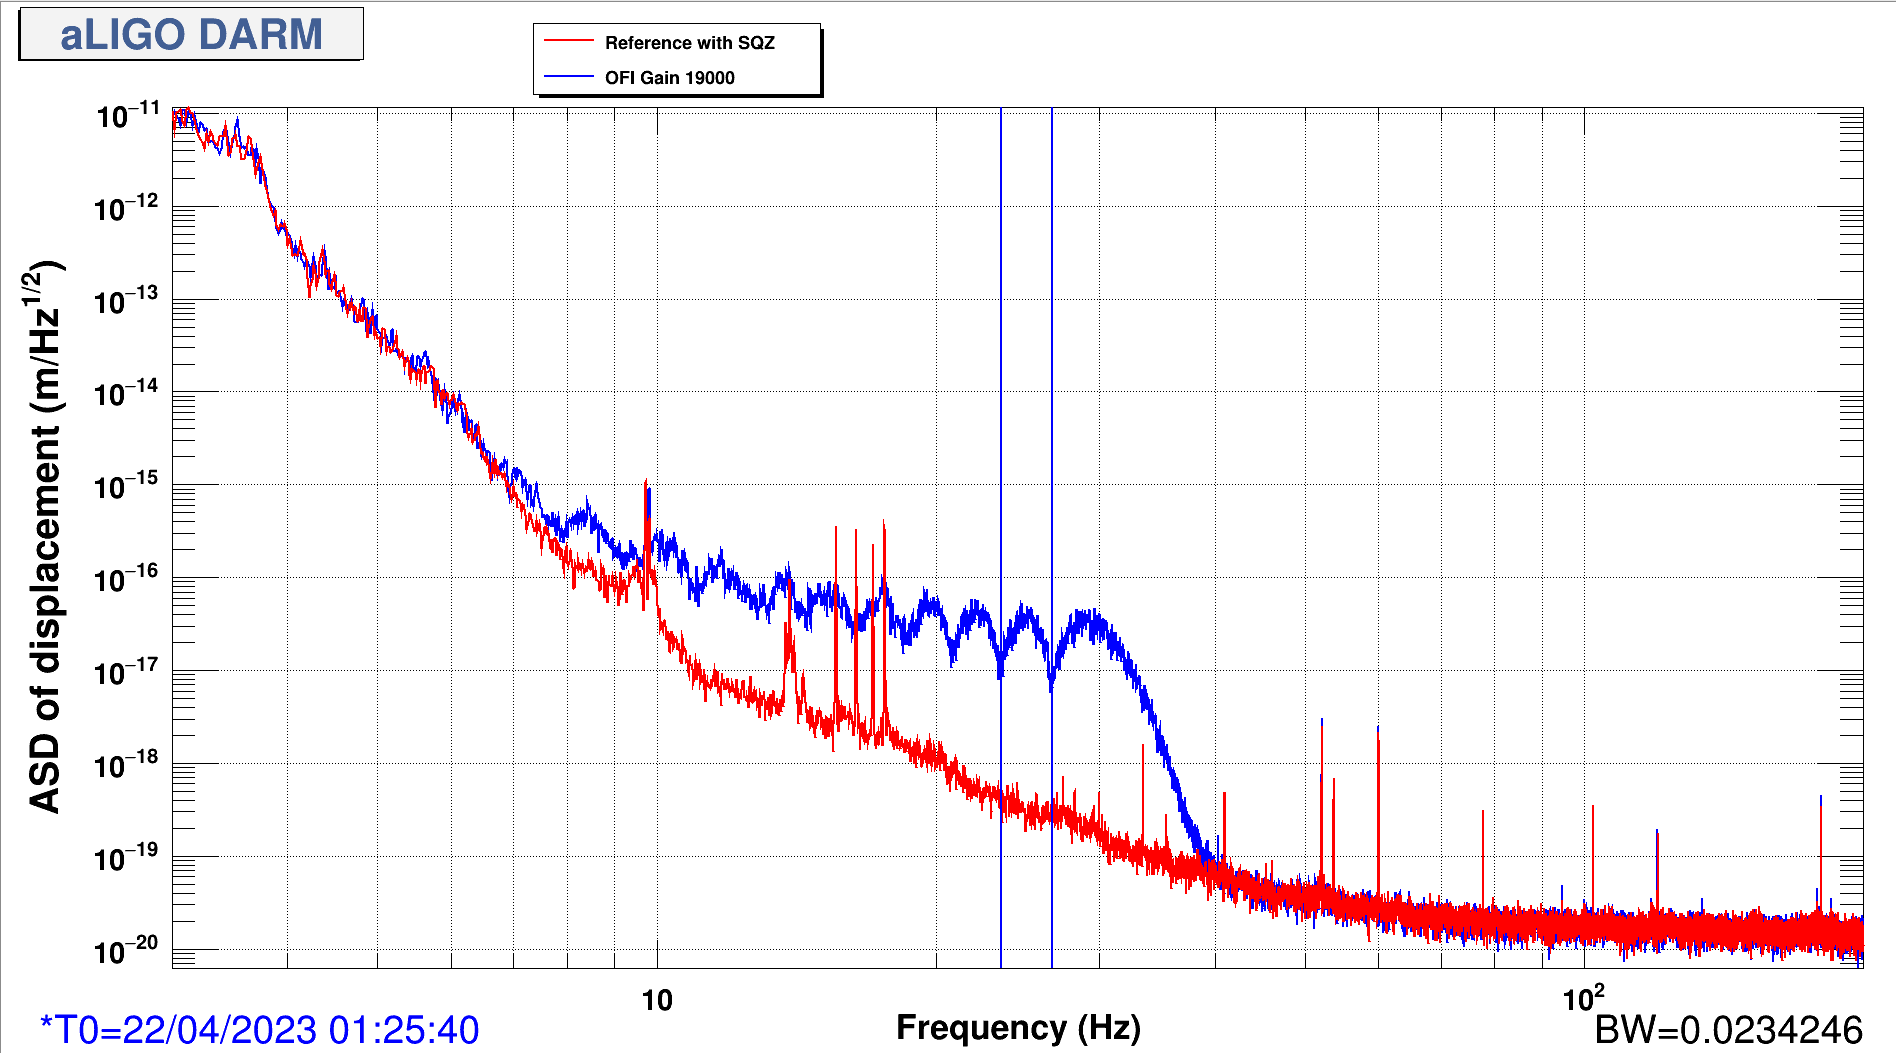
- G = 19000, corresponding to a motion in LF = 39.7 um, RT = 36.6 um and SD = 0.7 um ( blue curve ), between 1h25m40 UTC and 1h35m40 UTC (22nd April 2023)
The scattering shelves are very evident and the cutoff frequencies scale with the scatterer velocity as expected. Moreover, we notice some structures with 3.2 Hz spacing in the plateau region of the shelves, as shown in Fig. 8.
We will analyze the data to extract the amount of recoupled scattered light coming from the squeezing port into DARM.