jeffrey.kissel@LIGO.ORG - posted 12:34, Wednesday 03 May 2023 - last comment - 12:34, Wednesday 03 May 2023(69285)
Front-end Computed Live Systematic Error Now Fully Functional; Looks good, but needs cross-checking and validation
J. Kissel
After all the infrastructure work over the past two weeks (see list below), we've finalized the live computation of the systematic error in calibration in the front-end.
We've still got a lot of work to do in terms of validation, but you can see results here:
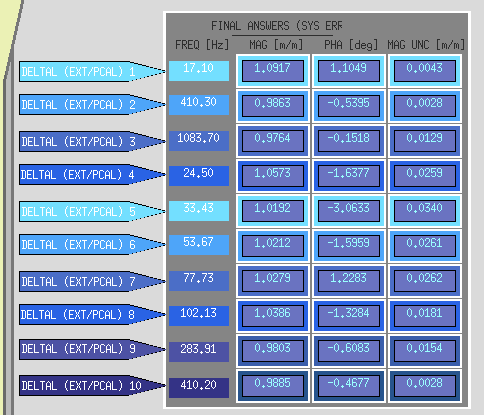
- MEDM Screen Snippet -- this shows the numbers that are conveniently shown on the CAL CS TDEP screen (sitemap > CAL CS > DARM calib > pink "CAL LINE MONITORS" block)
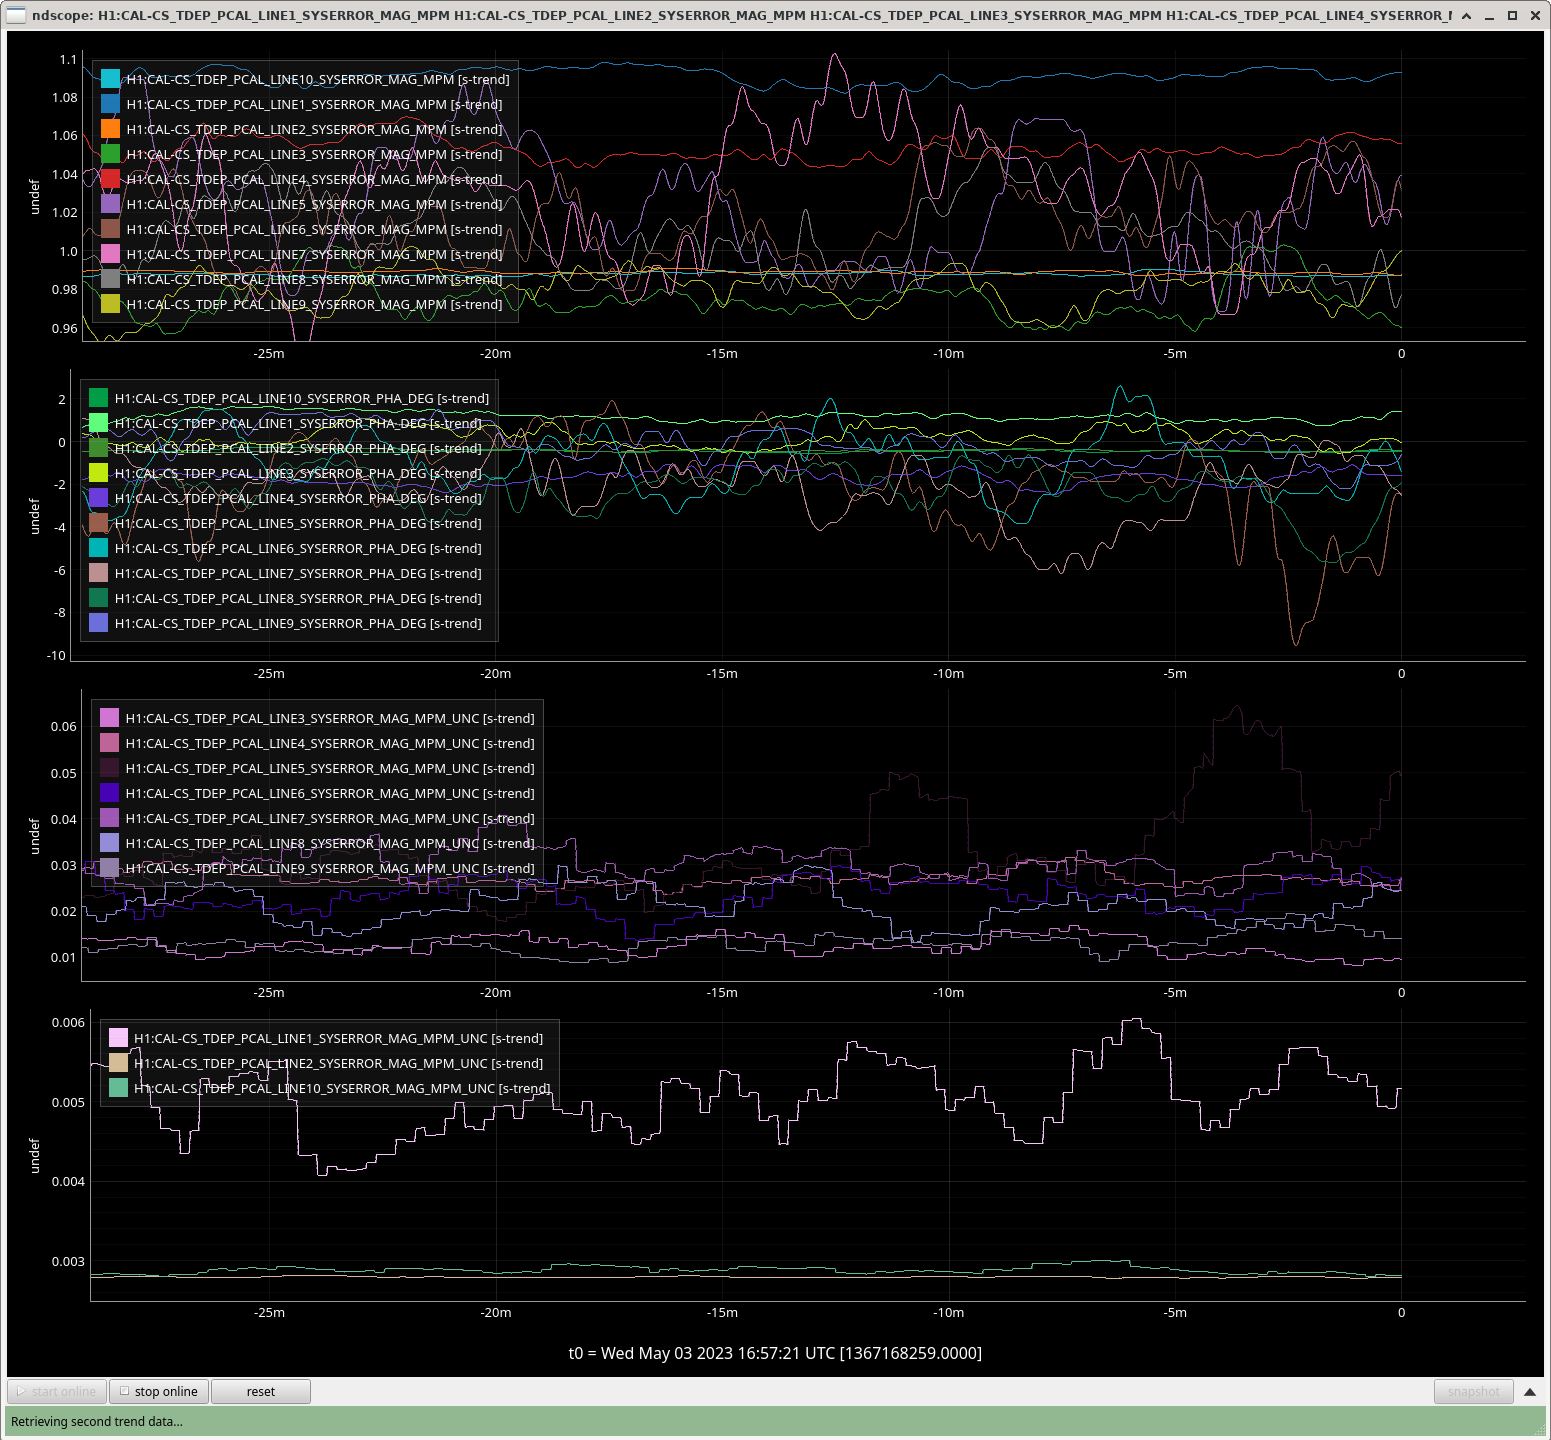
- ndscope trend -- this shows the trend of these numbers of a ~30 minute time window around ~17:00 UTC.
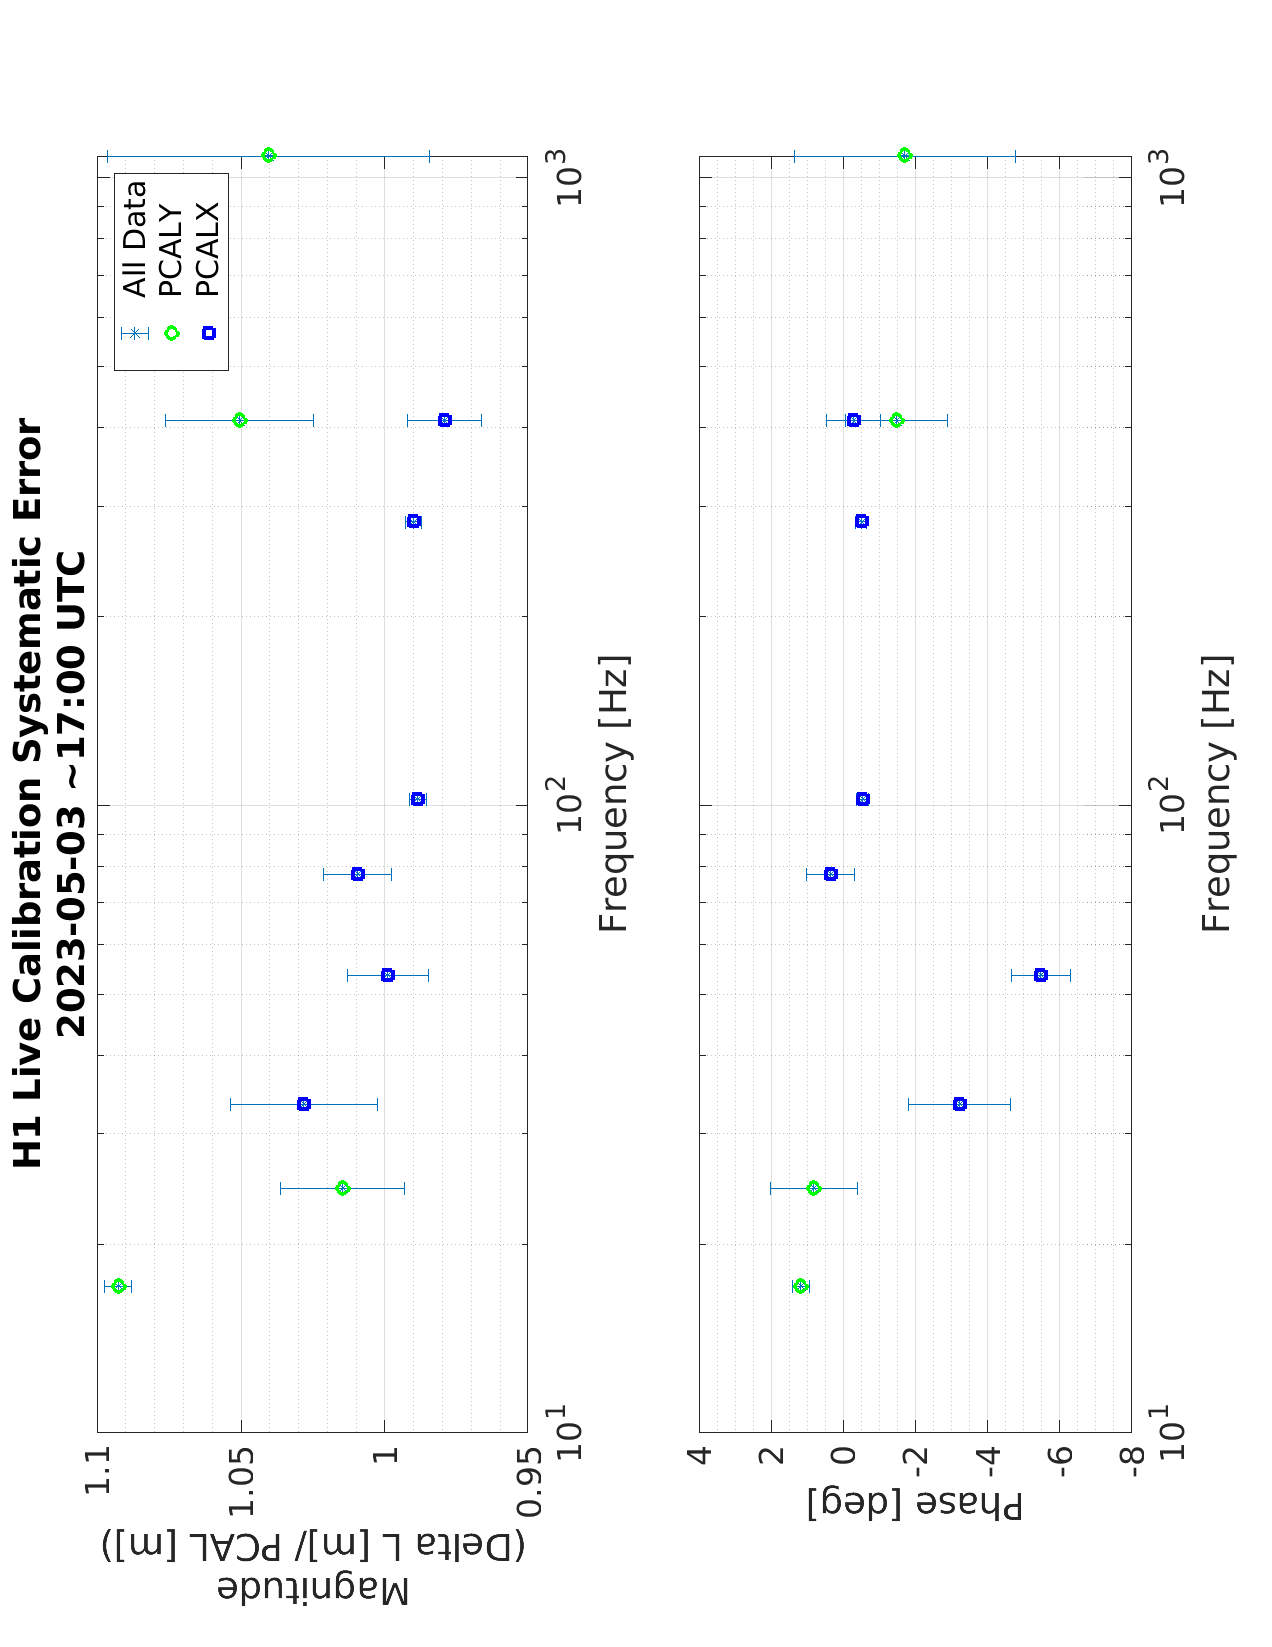
- png and pdf of one snap-shot in time (i.e. informed by one 2-minute answer of the "calibration systematic error" calculated on a ~2 minute cadence), but shown as the traditional bode plot.
Here, we define the "calibration" as H1:CAL-DELTAL_EXTERNAL * (GDS / CALCS) corrections, i.e. the "DARM loop transfer function values at calibration line" (GDS/CALCS) correction at each calibration frequency for H1:CAL-DELTAL_EXTERNAL are
(GDS/CALCS) = (1/C_CORR) * ( (1 + G) / (1 + G * - angle(C_CORR * A_CORR) / (A_CORR * C_CORR)) )
as defined in T1900169. Similarly, the PCAL channels, H1:CAL-CS_TDEP_REF_PCAL_DQ (which is currently PCALY RX PD), and PCAL X RX PD (which unfortunately NOT stored as an independent test point, or stored in the frames) are corrected at each calibration line frequency as
(PCAL [m]) / (PCAL_CALCS) = (arm sign) * (1/f^2) * (analog 65 kHz AA) * (digital 65kHz - 16kHz AA) * (corner-to-end, one 16 kHz clock cycle advance)
Some other important notes:
- the front-end *does not* use or need a whitening filter, the front-end (GDS/CALCS) correction does *not* need to account for the whitening filter that's applied to H1:CAL-DELTAL_EXTERNAL before creating H1:CAL-DELTAL_EXTERNAL_DQ.
- this systematic error measurement does not need to be corrected for time-dependent correction factors -- its measuring their impact live. The (GDS/CALCS) correction is only weakly dependent on TDCFs (see LHO:66062), so all the correction factors to the front-end computed answers are time-independent.
- The uncertainty for each of these data points is the quadrature sum of
:: 0.28% 1-sigma, or 0.0028 radians [relative uncertainty], from G2300471 -- the "fundamental" uncertainty in our model of how much displacement PCAL causes, as it currently stands, and
:: the measurement-, coherence-based, sqrt( (1-C) / (2 N C)) uncertainty.
As such, the loud lines (e.g. 17.1, 410.2, and 410.3 Hz) are limited by the PCAL model's uncertainty, and the quieter lines are limited by the measurement noise. These should be the only uncertainties in this measurement -- drive the known PCAL displacement, and see what you measure out of DELTAL_EXTERNAL * (GDS/CALCS). *Maybe* you could argue that the (GDS/CALCS) corrections have some uncertainty, we'll have to think about that.
- Here, in the bode plot, note that I've displayed DELTA L [m] / PCAL [m] -- which is the inverse of what we typically show when we show the modeled systematic error, PCAL [m] / DELTA L [m].
The list of "lost of work to do":
- (potentially) tune the amplitude of PCAL lines (especially the PCALX) in order to get "satisfactory" uncertainty on the estimate of the systematic error. (Note, that also means figuring out what "satisfactory" *is*.)
- Put this on the same plot as a "traditionally measured, offline processed" broad-band and swept-sine measurement of the same thing at a time *near* this calculation, e.g. those from LHO:66079.
- Put this on the same plot as the "traditional *modeled* estimate of the systematic error," which is derived from MCMC fits, GPR fits of the residual, and time-dependent correction factors.
- Figure out a nice way use animated plots to display a "3 dimensional" bode plot of these answer as a function of time
- Compare against GDS processed values of the same thing (still working on figure out ways to store that answer for comparison).
And in the grand scheme of things, once this is validated, and we're confident in the uncertainty of the measured systematic error, *then* we can figure out how to alarm on these values when something significant changes in the calibration.
[1] Front-end code changes last Tuesday, LHO:68961, and yesterday LHO:69226
[2] MEDM screen updates to the graphical user interface for improved clarity and usage LHO:68999 and LHO:69263
[3] Understanding and populating the EPICs records that are "DARM loop model parameter values at calibration line frequencies" LHO:69061 and LHO:69159
[4] Understanding, LHO:69175, then synchronizing the demod low-pass corner frequencies with the FFT LENGTH and Number of Averages used to compute the measurement-, coherence-based uncertainty LHO:69265.
Images attached to this report
Non-image files attached to this report

Comments related to this report
Here're the channels to grab these answers for yourself. They're all EPICs channels, sampled at 16 Hz, since the answer piped into them are funamentally measuring a rolling average with a cadence of ~2 minutes (13 averages of 10 second FFTs).

Generically, the channels look like this:
    H1:CAL-CS_TDEP_PCAL_${DEMOD}_${TERM}
where the "${TERM}" is the frequency, mag error, mag error's uncertainty, phase error, phase error's uncertainty, as listed below:

         ${DEMOD}      ${TERM=FREQ}              ${TERM=MAG}             ${TERM=MAG_UNC}           ${TERM=PHA}               ${TERM=PHA}                Planned to be Present in O4?
17.1     LINE1     _COMPARISON_OSC_FREQ       _SYSERROR_MAG_MPM       _SYSERROR_MAG_MPM_UNC      _SYSERROR_PHA_DEG        _SYSERROR_PHA_DEG_UNC                   YES
24.5     LINE4              |                         |                          |                      |                           |                              NO
33.43    LINE5              |                         |                          |                      |                           |                             YES
53.67    LINE6              |                         |                          |                      |                           |                             YES
77.73    LINE7              |                         |                          |                      |                           |                              |
102.13   LINE8              |                         |                          |                      |                           |                              |
283.91   LINE9              |                         |                          |                      |                           |                              |
410.2    LINE10             |                         |                          |                      |                           |                              |
410.3    LINE2              |                         |                          |                      |                           |                              |
1083.7   LINE3              V                         V                          V                      V                           V                              V


So, for example, for the 410.3 Hz line, the channels are
    H1:CAL-CS_TDEP_PCAL_LINE2_COMPARISON_OSC_FREQ
    H1:CAL-CS_TDEP_PCAL_LINE2_SYSERROR_MAG_MPM
    H1:CAL-CS_TDEP_PCAL_LINE2_SYSERROR_MAG_MPM_UNC
    H1:CAL-CS_TDEP_PCAL_LINE2_SYSERROR_PHA_DEG
    H1:CAL-CS_TDEP_PCAL_LINE2_SYSERROR_PHA_DEG_UNC

I will call out that the DEMOD line numbers (LINE1, LINE2, LINE3, etc.) are *not* organized by frequency like the list above -- so BE CAREFUL when you're writing code to look at these answers that you sort your frequency vector before pushing to a bode plot.