jeffrey.kissel@LIGO.ORG - posted 17:01, Thursday 18 May 2023 (69736)
Calibration Line Changes -- Increased amplitudes of PCALX Systematic Error Lines
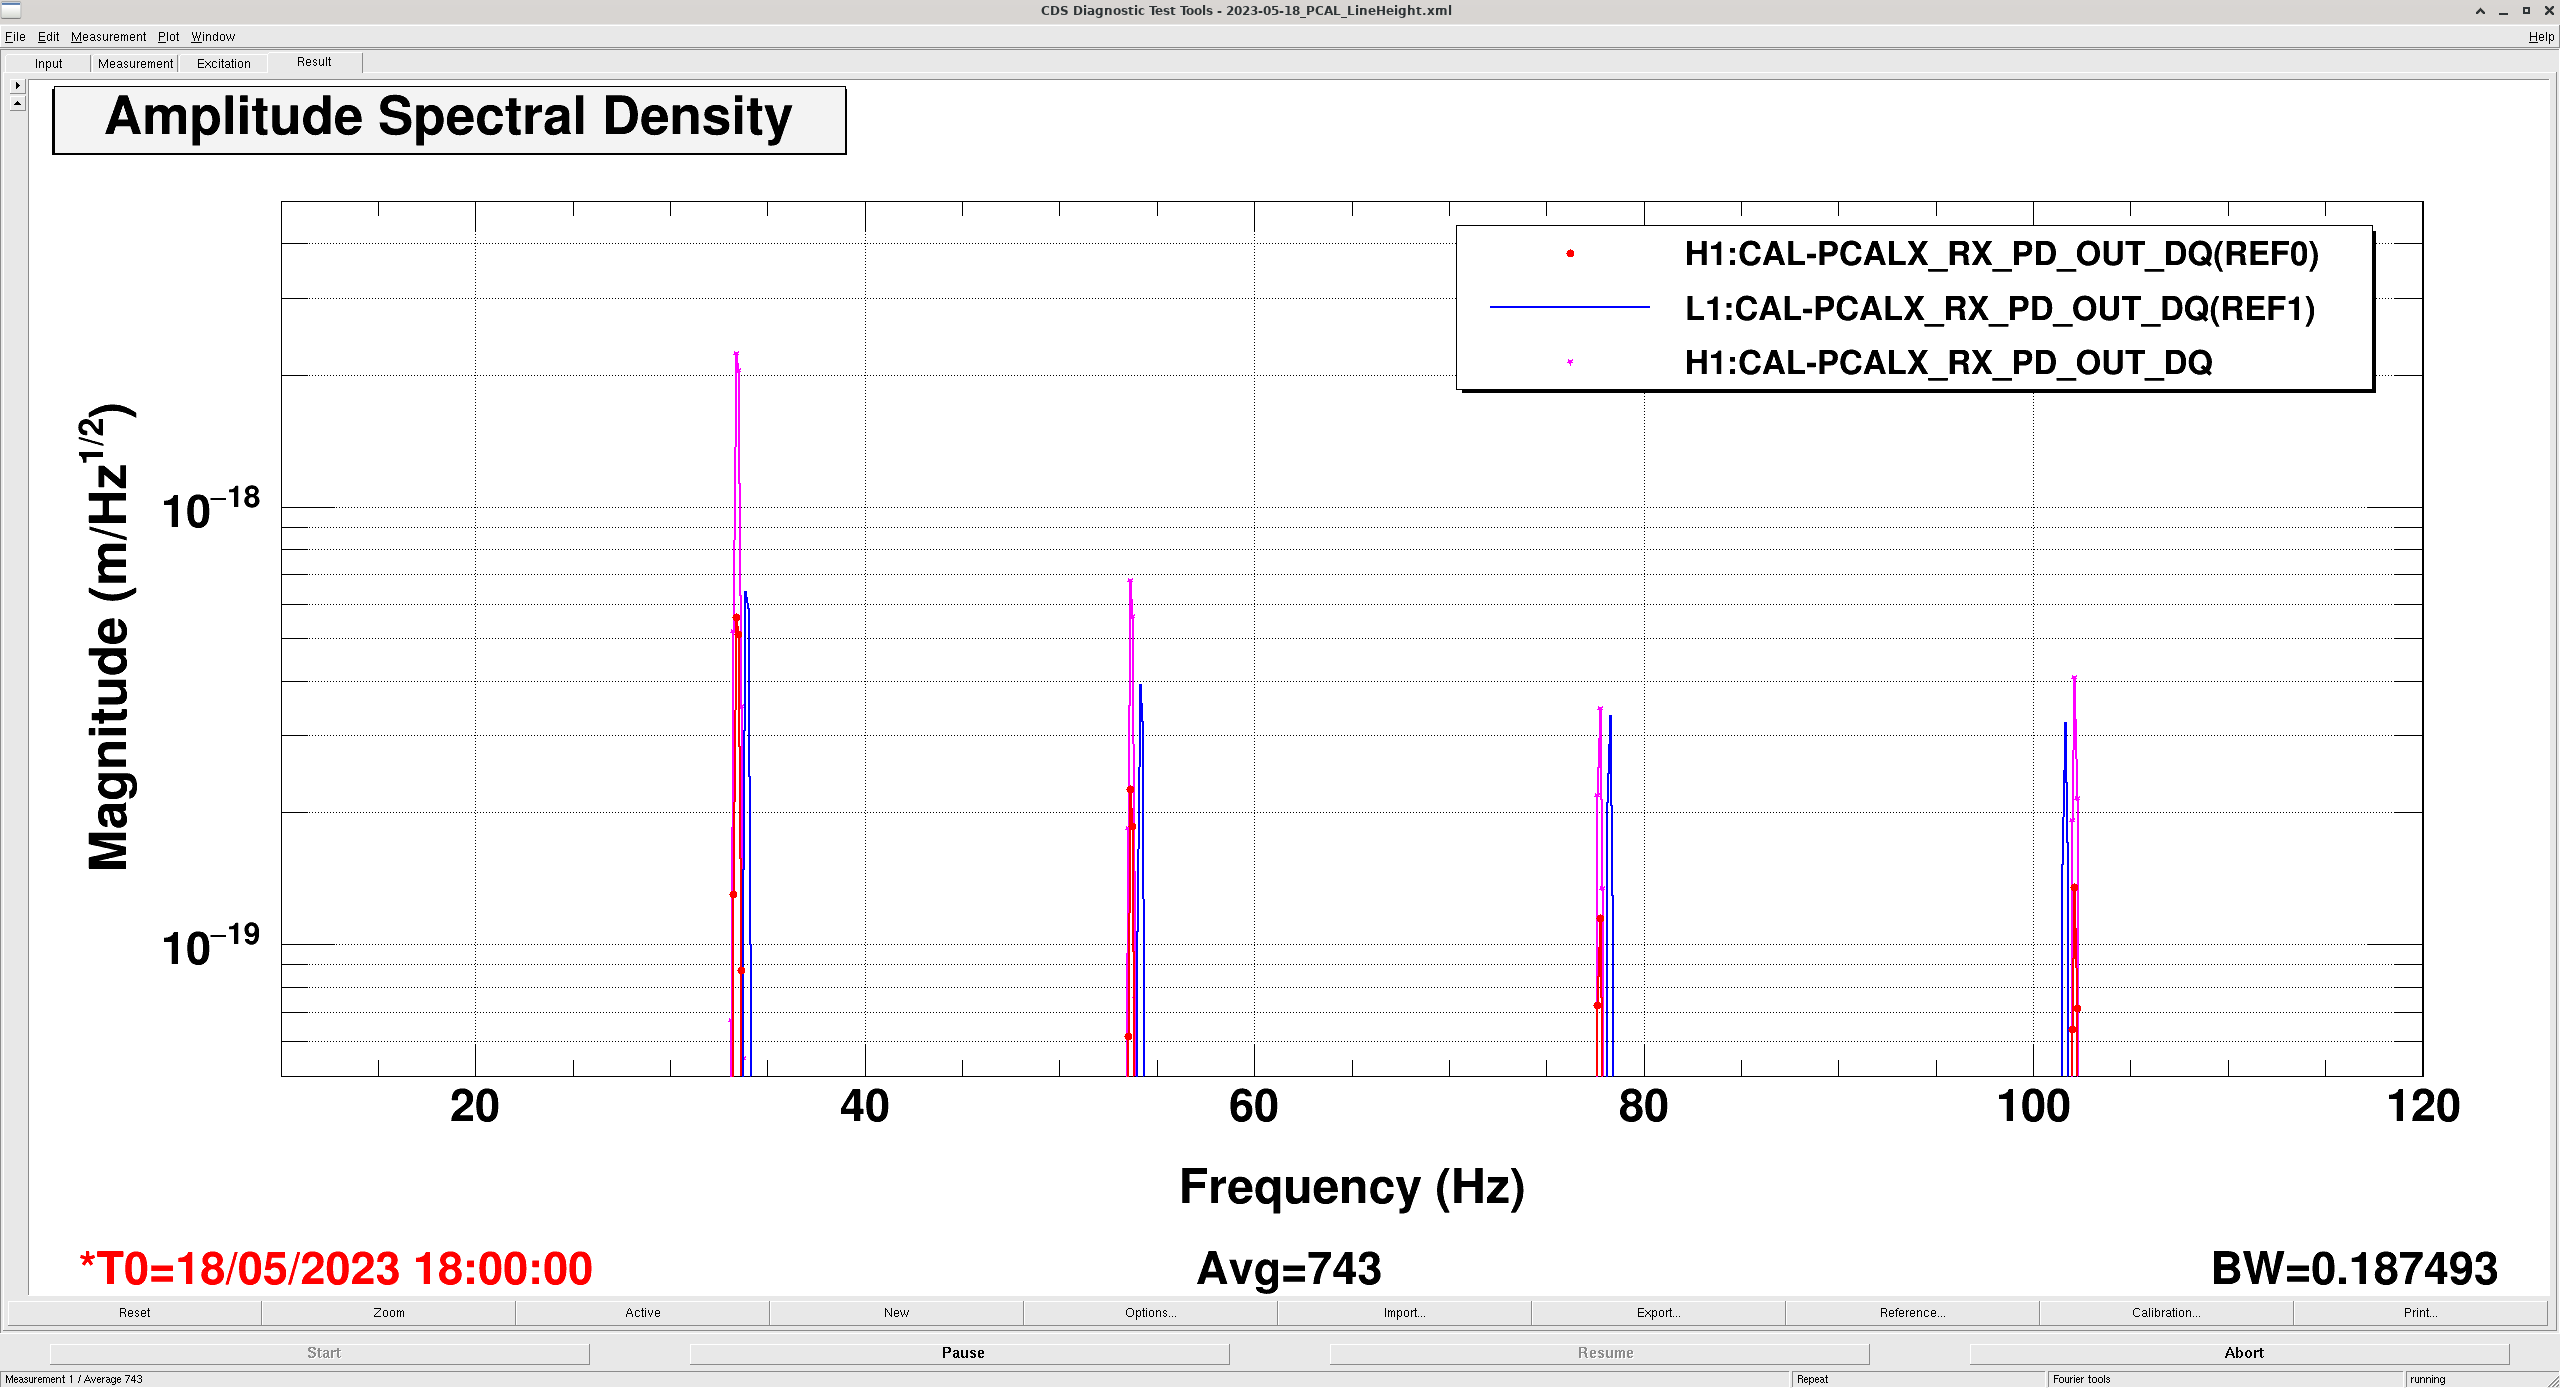
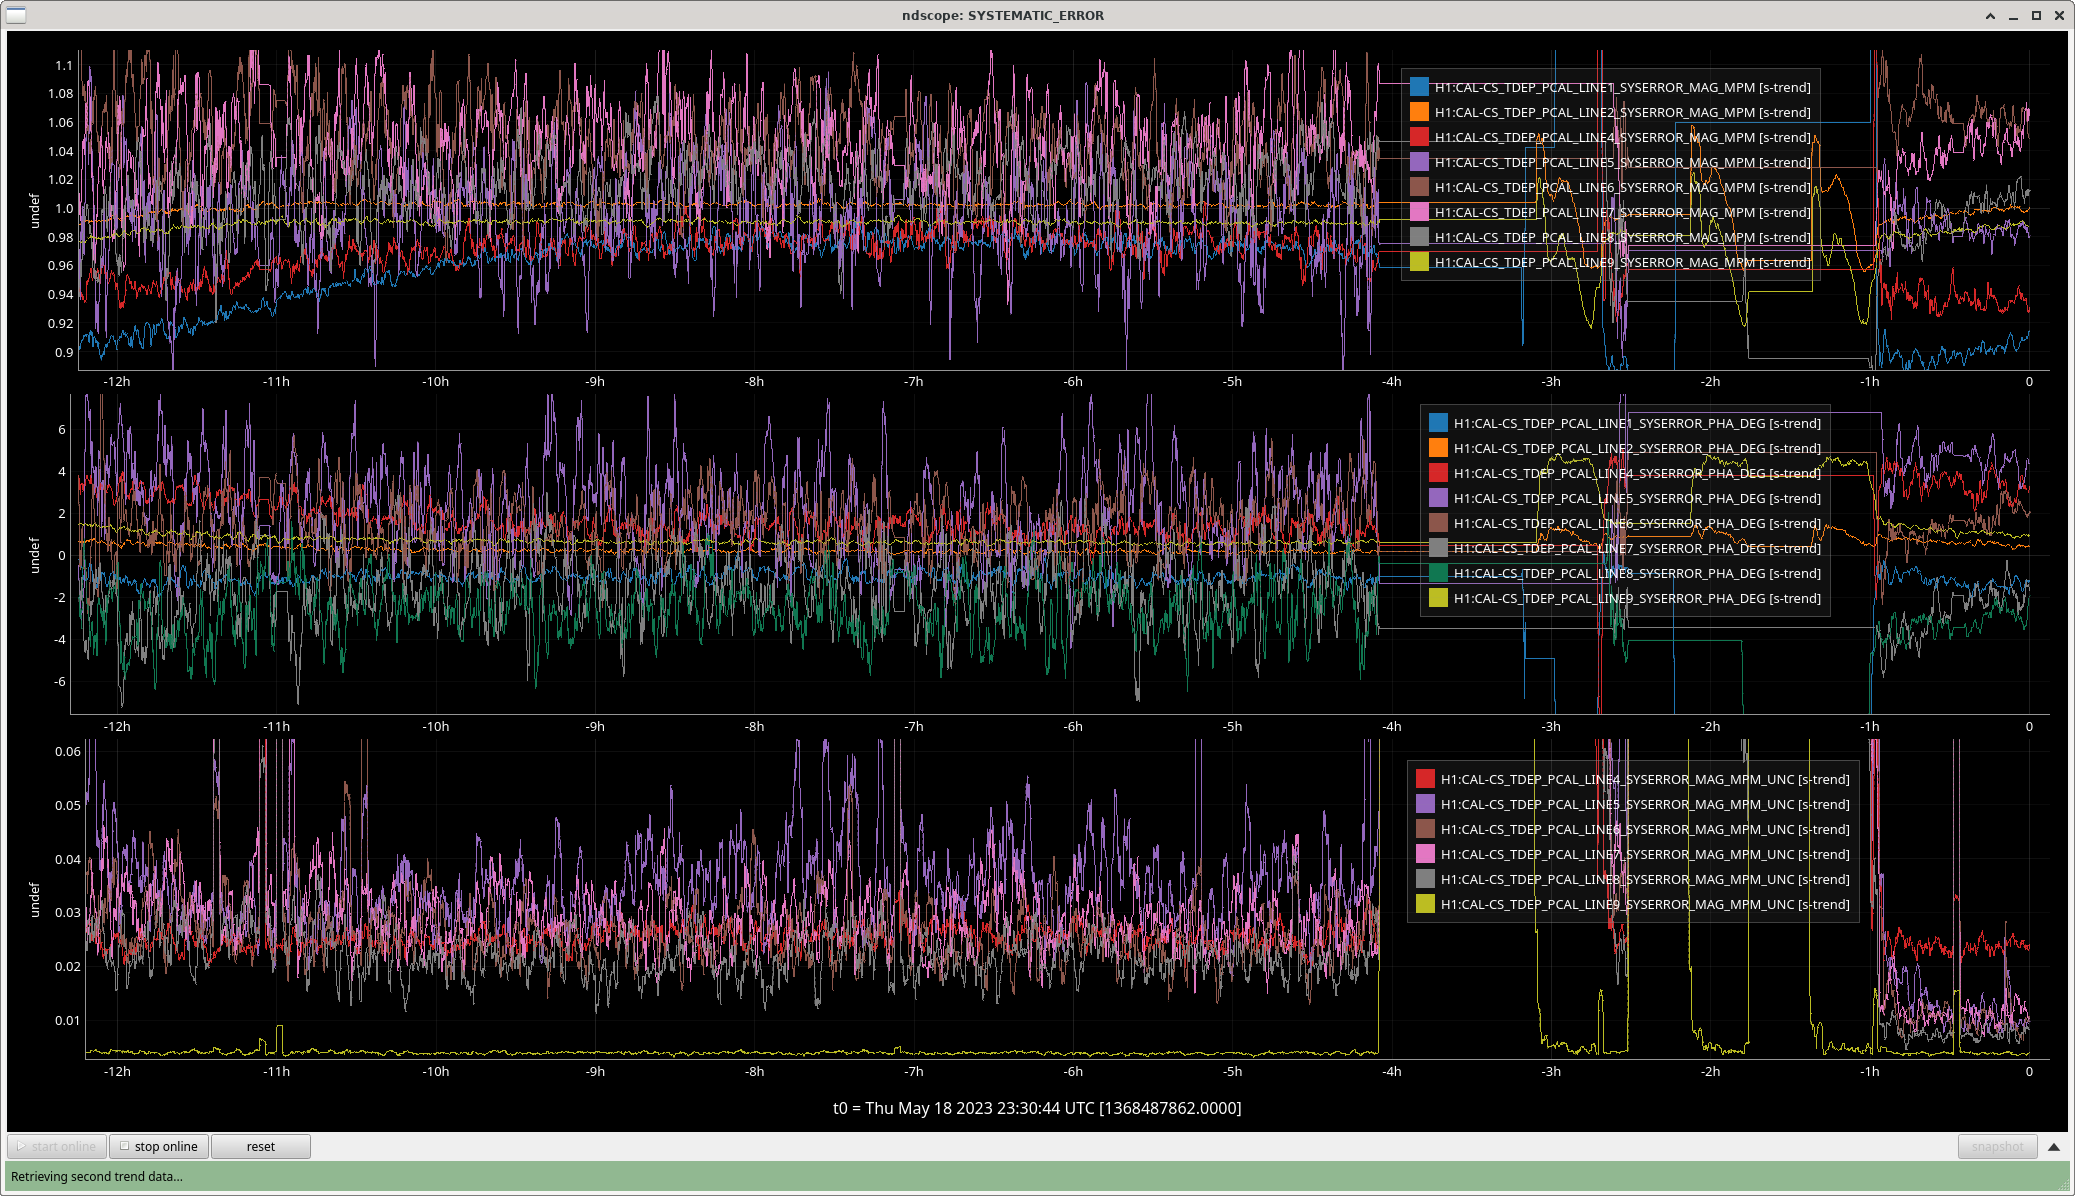
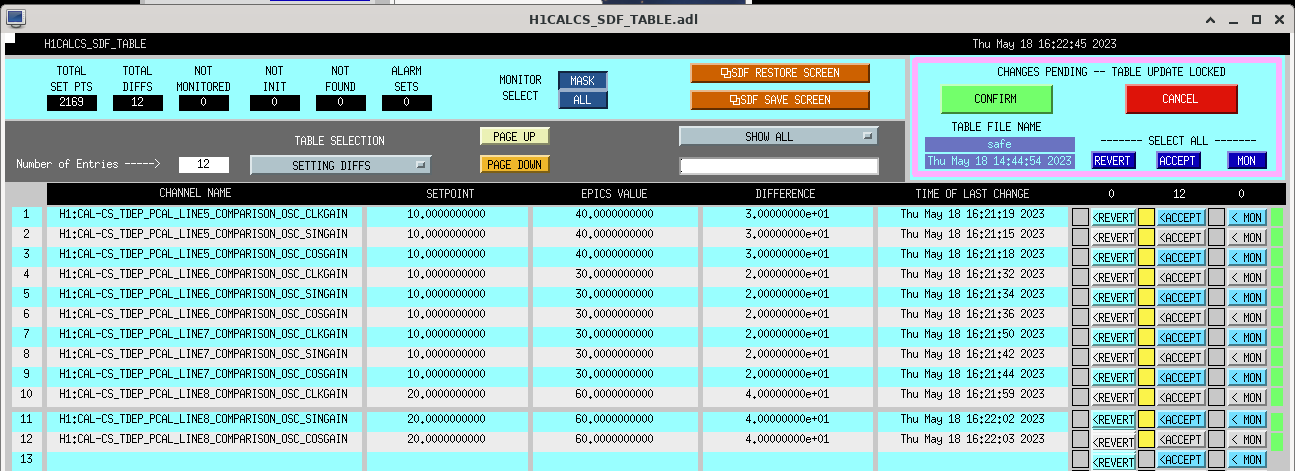
J. Kissel

We're finally to the point where we are able to review the results of the online measures of the systematic error (the new-to-O4 PCALX lines at the below listed frequencies), and we're finding that we need more SNR, (increased coherence, decreased uncertainty).

Recall, we first set these heights blindly in July 2022 (LHO:64214), but live front-end processing of the data didn't appear until May 03 2023 (LHO:69285) -- from which the data is stored "in the frames" via EPICs channels, which means we can look at, and trend the results and compare against other IFO channels with all the usual tools.
This week, we've begun reviewing those results as the *modeled* systematic error (ldas-jobs.ligo-wa.caltech.edu/~cal/) starts to become trust worthy (post yesterday's calibration pipeline update; LHO:69696), and we're trying to validate the "grafana" live processing of these lines (calibration-monitoring).

I've increased three of the four the line height amplitudes by a factor of 3 and one by 4, as indicated below:

PCAL                    CAL-CS DEMOD    Frequency    Amplitude     Amplitude    Ratio
OSC Number              Number          (Hz)         New (ct)      Old (ct)     (New/Old)
  PCALX_PCALOSC4        LINE5           33.34        40     10           4.0x
  PCALX_PCALOSC5        LINE6           53.67        30     10           3.0x
  PCALX_PCALOSC6        LINE7           77.73        30     10           3.0x
  PCALX_PCALOSC7        LINE8          102.13        60     20           3.0x

These changes have been in place as of the NOMINAL_LOW_NOISE segment that started on 2023-05-18 22:30 UTC.

Attachments:
2023-05-18_PCALX_LineHeight_Increase.png
    This shows the change in amplitude of these four lines.
        - RED -- the new H1 amplitudes
        - BLUE -- the corresponding L1 amplitudes (they have better noise at the lower frequency end, so they don't need to drive as hard to achieve the same SNR, or coherence, or uncertainty)
        - MAGENTA -- the old H1 amplitudes

2023-05-18_PCALX_LineHeight_Increase_12hourtrend.png
    This shows how the measurement of the systematic error, and its corresponding uncertainty has improved.
    The lowest panel shows that the uncertainty on the above mentioned DEMOD output has decreased from 4-5% to 1-1.5%. as expected.
    One can see by the magnitude (top) and phase (middle) plots that one can much more clearly read off the value of the trend of the systematic error.

2023-05-18_PCALX_LineHeight_Increase_SDFAccept.png
    This shows that not only have I SDF accepted the values of the new SINGAIN in the PCALX SDF system (not shown), I've also matched the amplitude increase DEMOD LO gains in the CALCS model (shown).

Here's the latest list of calibration lines:
Freq (Hz)   Actuator               Purpose                      Channel that defines Freq             Changes Since Last Update (LHO:69555)
15.6        ETMX UIM (L1) SUS      \kappa_UIM excitation        H1:SUS-ETMY_L1_CAL_LINE_FREQ          No change
16.4        ETMX PUM (L2) SUS      \kappa_PUM excitation        H1:SUS-ETMY_L2_CAL_LINE_FREQ          No change
17.1        PCALY                  actuator kappa reference     H1:CAL-PCALY_PCALOSC1_OSC_FREQ        No change
17.6        ETMX TST (L3) SUS      \kappa_TST excitation        H1:SUS-ETMY_L3_CAL_LINE_FREQ          No change
33.43       PCALX                  Systematic error lines       H1:CAL-PCALX_PCALOSC4_OSC_FREQ        Amplitude Change; THIS ALOG
53.67         |                        |                        H1:CAL-PCALX_PCALOSC5_OSC_FREQ        Amplitude Change; THIS ALOG
77.73         |                        |                        H1:CAL-PCALX_PCALOSC6_OSC_FREQ        Amplitude Change; THIS ALOG
102.13        |                        |                        H1:CAL-PCALX_PCALOSC7_OSC_FREQ        Amplitude Change; THIS ALOG
283.91        V                        V                        H1:CAL-PCALX_PCALOSC8_OSC_FREQ        No change
284.01      PCALY                  PCALXY comparison            H1:CAL-PCALY_PCALOSC4_OSC_FREQ        No Change
410.3       PCALY                  f_cc and kappa_C             H1:CAL-PCALY_PCALOSC2_OSC_FREQ        No Change
1083.7      PCALY                  f_cc and kappa_C monitor     H1:CAL-PCALY_PCALOSC3_OSC_FREQ        No Change
n*500+1.3   PCALX                  Systematic error lines       H1:CAL-PCALX_PCALOSC1_OSC_FREQ        No Change (n=[2,3,4,5,6,7,8])
Images attached to this report