The low frequency (<50 Hz) strain sensitivity is worse now than it was a few months ago. One of the questions we had was whether this was due to the increase of input power from 60 to 75 W. The quick answer is:
the 20-50 Hz noise got worse both when the power was increased from 60 to 75 W and when the DARM offset was increased from 20 to 40 mA
To try and answer this question:
- selected times during the past couple of months when the range was higher than 130 Mpc for at least 10 minutes
- for each of those times, computed the DARM spectrum, using either CAL-DELTAL_EXTERNAL_DQ
- computed the average noise level in the 20 to 50 Hz region (by averaging the log of the PSD, so to be less sensitive to lines)
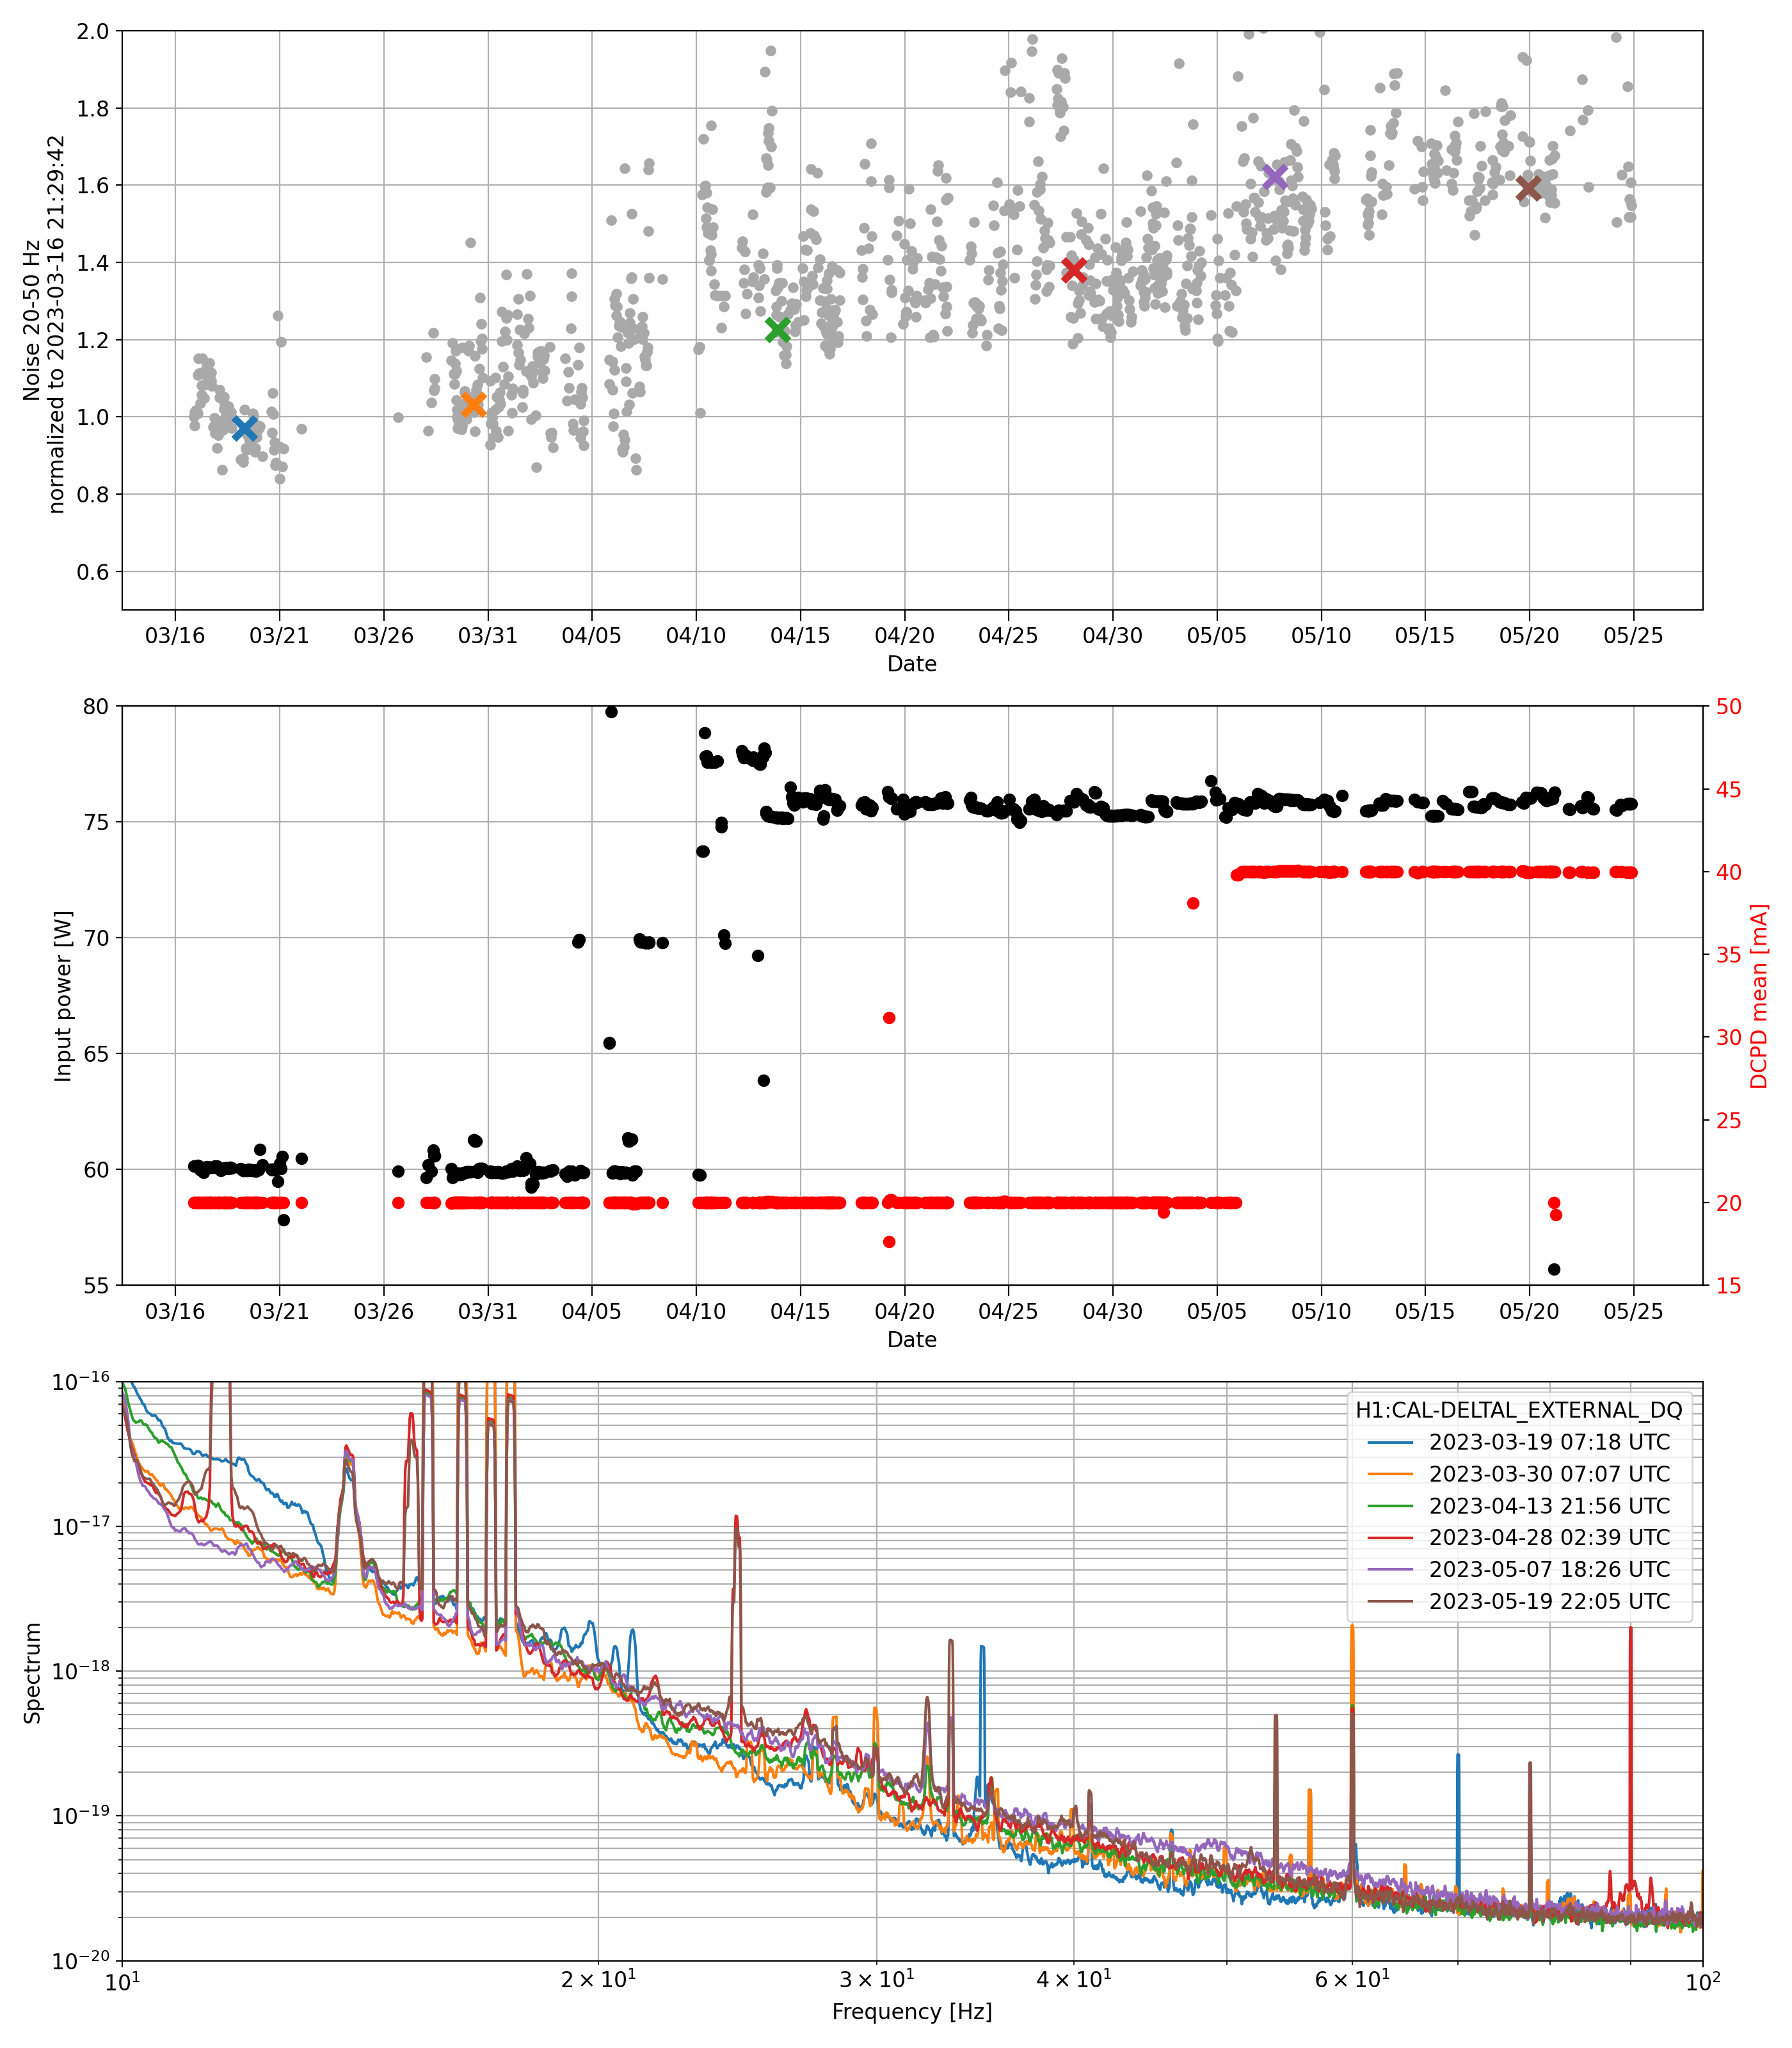
The plot attached below shows in the top panel how the noise in the 20-50 Hz region got worse over time: it shows the average noise in the band, normalized to the beignning of the analysis, in March. There are two clear discrete steps when the noise got significantly worse. The second panel shows (in two twin y axis) the input power in black and the DCPD power in red. There are two clear times when the noise got worse: when the power was increased from 60 to 75 W and when the DARM offset was increased from 20 to 40 mA.
The colored X's in the second panel correspond to the DARM spectra shown in the bottom panel, same color.
The results shown here are obtained looking at CAL-DELTAL_EXTERNAL_DQ, but very similar results can be obtained with OMC-DCPD_SUM_OUT_DQ, compensating for the calibration line amplitudes to account for changes in the optical gain.
Gabriele also made plots comparing the noise with relevant sqz metrics, I've annotated some trends I see from the various frequency bands here. He's compared the noise reduction between 20-50Hz, 100-200 Hz, and 1-2kHz, with the filter cavity detuning, generated sqz level, and the squeezer blrms. These are parameters I think could meaningfully change the noise in clear ways, there are more parameters we could compare (e.g. psams, sqz angle, srcl detuning, etc..), but a start. Note he has plotted all SQZ BLRMS for all bands ; but the sqz blrms are band selective, so it's a bit confusing comparing them all.
Trends that we noticed when compared with squeezing, in line with his earlier comments, are:
20 - 50 Hz, probably technical noise. Sees higher noise w/higher IFO power, and higher dcpd mA. When I looked at this before (e.g. summary here), this is consistent with my impression that this extra low-freq noise is added technical noise. (normally blrms 1)
100 - 200 Hz, unclear if this is quantum or classical. Not consistent/clear trends with generated sqz level, or fc detuning (though maybe?), or IFO power. Probably some extra technical noise here from the jump to 40mA, as seen on both elevated sqz blrms and worse noise. (normally blrms 2-3)
1-2 kHz, more squeezing and lower power seemed better for high frequency kHz noise. At 60W power, improvement probably related to lower ifo technical noise, also consistent that injecting more squeezing reduces noise more. (normally blrms 4-5)

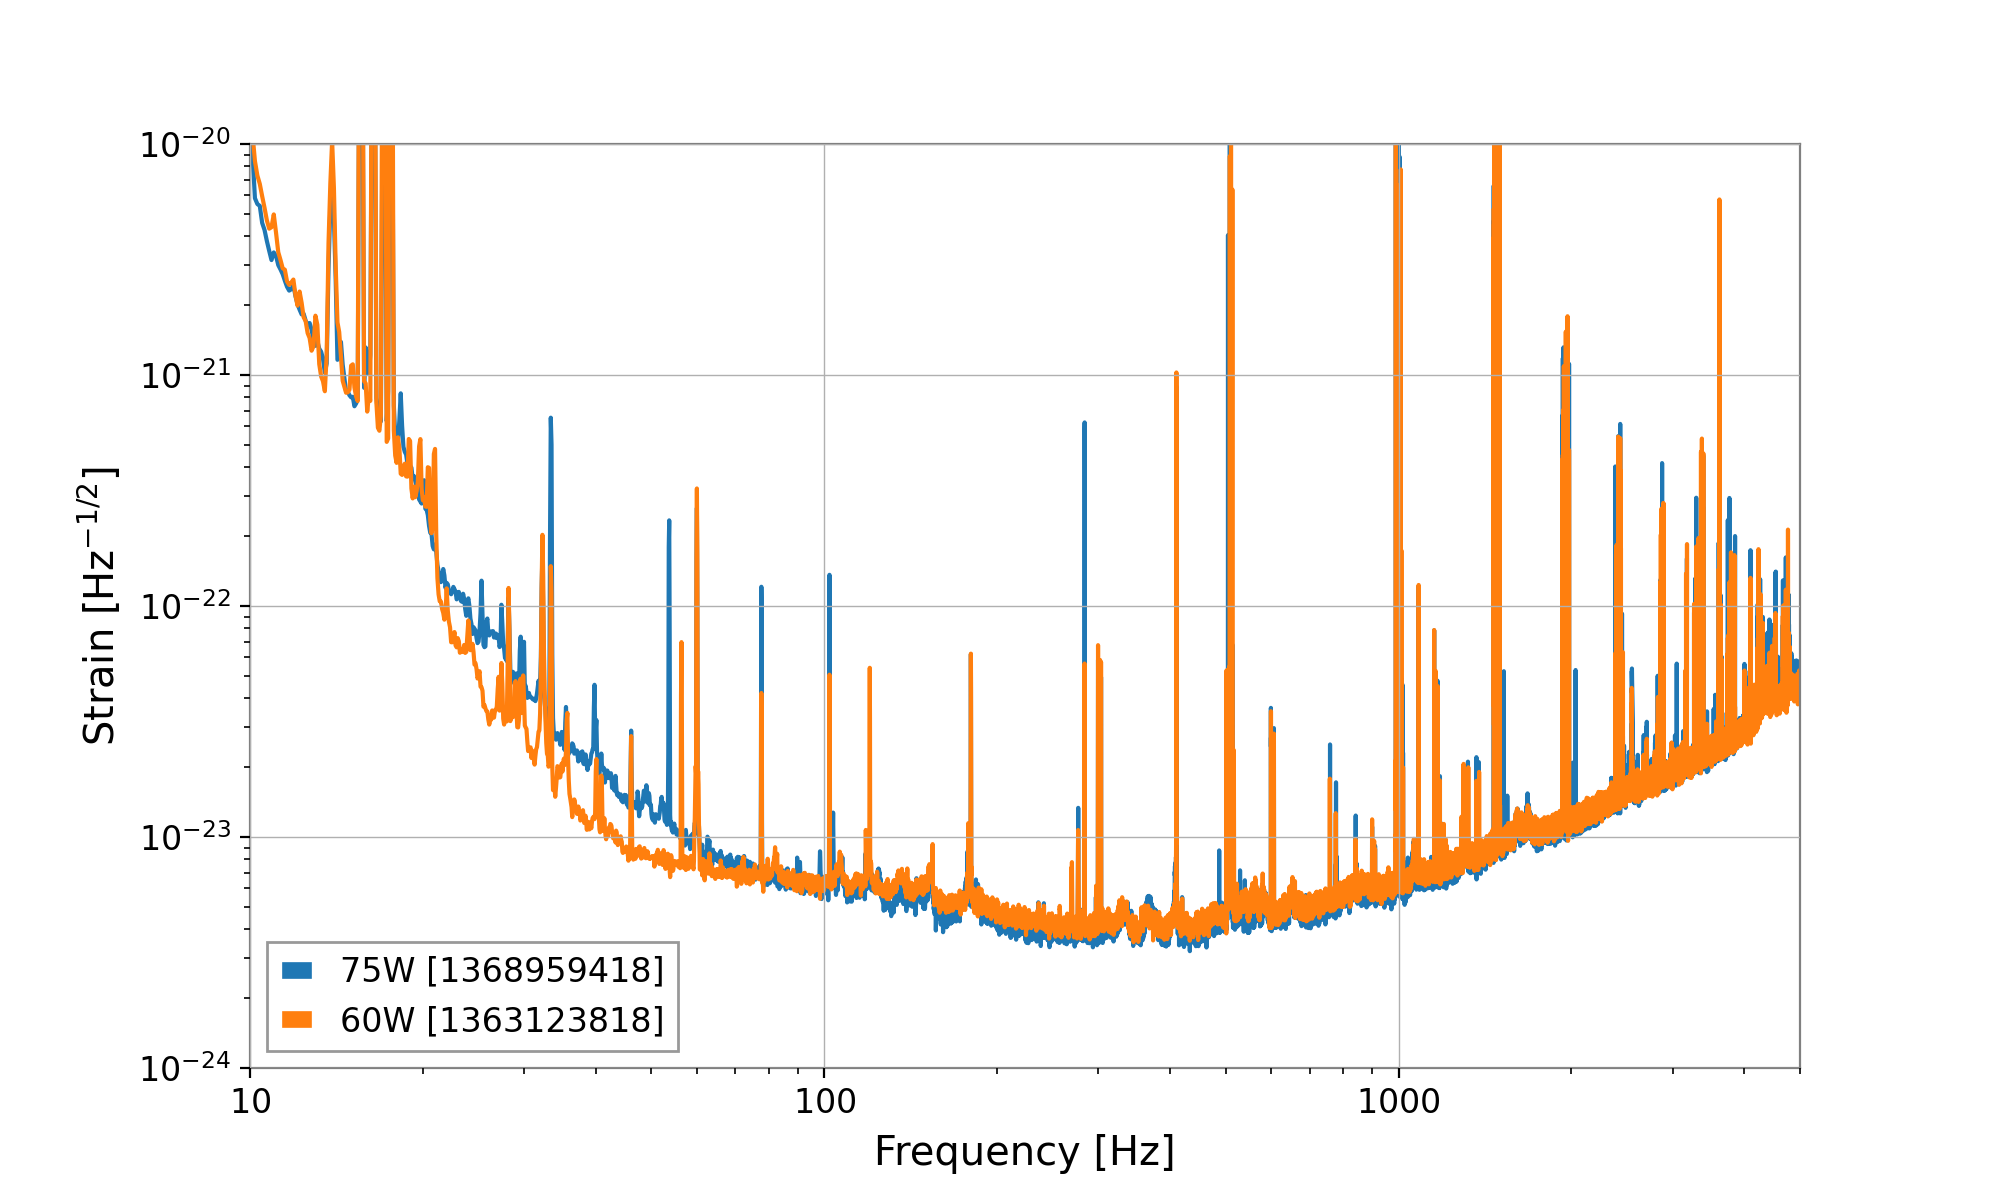
At the same time, there was some improvement in the noise between 100 and 200 Hz, but it seems very loosely correlated with the increased power: I would argue that the noise between 100 and 200 Hz improved gradually before the power increase.
There is almost no difference in the noise between 1 and 2 kHz

