jeffrey.kissel@LIGO.ORG - posted 15:19, Friday 09 June 2023 - last comment - 13:58, Monday 12 June 2023(70306)
Comparing Differential HAM2-HAM3 Motion vs. Local Motion
J. Kissel, S. Koehlenbeck, B. Lantz

Sina and I are putting together material to help motivate an SPI installation some time in the future (see most recent material in G2300655 and G2300846), and one of the open questions is whether we can demonstrate (via model, or extrapolated measurement) that the P & Y input to, say, PR3 would be better after linking the platforms together in PITCH & YAW than the local table PITCH (RY) & YAW (RZ).

This aLOG shows the first attempt at demonstrating this with data, sticking with PR3, and thus the HAM2 - HAM3 ISI system.

Executive Summary: This initial look shows great promise for an SPI's ability to improve HAM2 and HAM3 platform motion across the 0.01 to 10 Hz frequency band -- differential X (longitudinal), as well as differential Y and Z converted to pitch and yaw motion, is factors of 2 to 200 better than local X (longitudinal), RY (pitch), and RZ (yaw).


The key concepts here are
    - As it's *always* worth repeating, the input to the suspension point is different from table motion, and the optic motion is different that optic motion, *especially* when it comes to cross-coupling between degrees of freedom, like suspension point Longitudinal and optic Pitch, or platform X / RZ vs. optic Yaw. Even within the ISI, there's a good amount of cross coupling between RX/RY tilt DOFs and Y/X translation degrees of freedom, so using the SPI to improve ISI RY could improve ISI Y, which benefits PR3 suspoint L, with benefits PR3 optic P. So the motivation for an SPI, via looking at only one diagonal DOF at once will never make a clear argument for "we need an SPI!" So, we're doing an incomplete job if we look at only one DOF at once and say "improvements in this one DOF will clearing improve that one DOF." We'll only really know the true quantified benefit once we install one and see. But it's still interesting to look at the data in this way to get a feel for if it makes sense to even try.

    - The SPI may be used for different frequency regions for different purposes. PR3, for example, may not be limited by residual seismic motion at some frequencies for some degrees of freedom. We just need to be conscious of this when make sweeping statements like "PR3 is completely dominated by OSEM noise, you won't see any improvement unless we improve the local sensors on the top mass of PR3 -- so why should we spend energy on an SPI?" because that sweeping statement is true at 10 Hz, but not true below ~3 Hz, and an improvement below 3 Hz might be benefit to the IFO in subtle ways like "we can reduce the bandwidth of the ASC loops, which means the ASC sensor noise doesn't couple into DARM at 10-15 Hz."

    - In modern parlance, when we say an "SPI" we really mean a 3 DOF collection of sensors rather than "just" a 1 DOF seismic platform interferometer:
        :: SPI L :: a longitudinal sensor -- the interferometer part, which uses an asymmetric michelson IFO (short arm stays local to the launching platform, and the long arm spans the 16 m distance between the two platforms) to determine the relative distance between the platforms.
        :: SPI P :: an "optical lever" like pitch sensor measuring differential pitch of the platform (expected to be dominated by the difference between local Zs rather than local pitch RYs)
        :: SPI Y :: an "optical lever" like yaw sensor, measuring differential yaw of the platform (expected to me dominated by the difference between local Ys, rather than differential yaw RZs)

    - Fundamentally, why an SPI wins in P and Y is the lever arm of sensing. The local sensing of pitch (RX / RY) or yaw (RZ) is the difference or sum of inertial sensors across the width of the table, a lever arm of ~1 [m]. One the other hand, if we can tie pitch/RY or yaw/RZ one platform (say HAM2) to the other (HAM3), but using the lever arm *between* the platforms -- L = ~16 [m] -- and this is *better* than the local interial sensing, we improve both local platform's motion by something like sqrt(2) / L. The details of of the improvement depend on a lot of things, and we'll get there, but at least conceptually, this is the promised improvement.

    - Another point to emphasize is that *we don't yet know the optimal controls topology and/or frequency region that these 3 DOFs will be used.* Depending on the results, it may be interesting to compare the local inertial sensors to the SPI sensors, or the local CPS to the SPI sensors. What frequency region we blend in the SPI vs. the local platform's inertial and displacement sensor array is still unclear. So the plots below compare both against the SPI. You'll see that the differential signals are better in some frequency regions and worse in others. This is all still to be understood and schemed upon, so my commentary below should be treated as "first impressions."

    - Remember that depending on the frequency band, the CPS or GS13s are "in loop," forming the error signal for the feedback loops, which have UGFs of around 30 Hz. I indicate a "CPS Rolloff Frequency" with vertical lines on all the plots -- where the vertical line is set at the frequency above which the CPS contribution to the super sensor is less than 1.0. (Note, this is different from what has traditionally been referred to as "the blend frequency," which is instead a center point of equal contributions of GS13 and CPS. Because
        - gain peaking is involved at that "blend frequency" cross-over point,
        - that gain peaking can be large and/or span across a lot of frequency space,
        - GS13 blend filters are not easy to plot because of the embedded inertial sensor calibration and
        - AFAIK, no one's plotted them in their easy-to-digest complementary form recently,
    I chose the more straight-forward, easily findable, "when does the CPS contribution to the feedback loop start to roll off" frequency. These frequencies are close, of course, but not the same.)

    - I'm concocting "differential motion" between the HAM3 and HAM2 platforms by coherently subtracting one platform's DOF from the other platform's corresponding DOF. Since the data is recorded and synchronized by the CDS system, one simply needs to download the two platform's data over the same time period and subtract one time series from the other and it's a "differential motion coherent subtraction."

    - Of course, sensor noise is always of concern when doing differential measurements. As best I can, I use the estimates of the GS13 and CPS sensor noise from our old friend SEI_sensor_noise.m (T0900450), and I
        (a) Assume every colocated sensor of a given type has identical noise
        (b) Scale them to the appropriate cartesian degree of freedom, assuming all sensors are incoherent, by taking the quadrature sum of the given sensor type's input matrix from
            /ligo/svncommon/SeiSVN/seismic/HAM-ISI/Common/Basis_Change_Matrices/aLIGO_HAM_ISI_2_3.mat
        (c) Look at the results, find where the *Z* DOF is limited by sensor noise the real data, and scale every type's sensor noise in (a) by a single scalar fudge factor to match the real data
        (d) For differential sensor noise between the 2 platforms, I then multiply that DOF's sensor noise by a factor of sqrt(2).


What motivating data I'll show and why
    (I) SPI Longitudinal (the "interferometer" part of the SPI) would measure the differential distance between the HAM2 and HAM3 in X. So, to motivate the benefit of SPI L we'll compare an individual platform's X motion against the differential X, (HAM3 X - HAM2 X).

    (II) SPI Pitch (one "optical lever" part of the SPI) would primarily measure the differential Z (vertical) motion between HAM2 and HAM3 in Z. So, to motivate the benefit of SPI P we'll compare an individual platform's RY motion against the differential X, (HAM3 Z - HAM2 Z) *divided by the lever arm between the platforms, L.*

    (III) SPI Yaw (the other "optical lever" part of the SPI) would primarily measure the differntial Y (transverse) motion between HAM2 and HAM3. So, to motivate the benefit of the SPI Y, we'll compare an individual platform's RZ motion against the differential Y (HAM3 Y - HAM2 Y) *divided by the lever arm between platforms, L.*


OK, Now to the data.
For starter's I grabbed *one* 3 hours of data starting at -- last night, 2023-06-09 at 09:30 UTC (02:30a PDT, GPS 1370338218). The wind is low (< 10 mph), the microseism is around 0.1 [um/s], no earthquakes, and the IFO is locked, observing, in nominal low noise busy detecting gravitational waves. Note, that the RZ loops include Jim's new-and-improve blend filters that improve the local RZ performance by factors of 5 to 10 between 2 - 20 HZ.

LOCALX_vs_DIFFX shows the performance metric comparisons for SPI L.
    - The differential GS13 signal is about the same as the HAM3 local sensor for most of the frequency band. There's *some* areas below 0.5 Hz where the differential X GS13 would be better, but out of the nominal frequency region where the GS13 is used in loop.
    - Below 7 Hz, the differential CPS is better than the local CPS by factor ranging from 2 to 20.
    - Below the "CPS rolloff frequency" for this DOF, 0.34 Hz, and SPI measuring this same differential motion (without being limited by its own sensor noise) would improve things over each local CPS by a factors of 2 to 5.

Promising!

LOCALRY_vs_DIFFZoverL shows the performance metric comparisons for SPI P.
    - Here, we see a HUGE difference in performance between the local sensors and platform-to-platform differential sensors.
    - Assuming that the SPI optical lever has sensor noise below this level of rotation, would should be able to get a huge amount of improvement, and we'd have our pick of which sensor to use where, since both local CPS RY and GS13 RY sensors are MUCH worse than differential Z.
    - The only place where the differential motion is comparable (note -- comparable, not worse!) is in the ~10 Hz region where differential HEPI pier motion between the two platforms is, well, different.

*Very* promising!

LOCALRZ_vs_DIFFYoverL
    - Similar to the SPI P plots there's lots of frequency regions where SPI Y, informed by differential HAM3 - HAM2 Y would be better than local RZ. However, this DOF is probably the most confusing, because we know that each local table Y is limited in the 0.07 to 5 Hz region by local RX tilt (from local RX sensor noise across the ~1 [m] lever arm). So differential Y is limited by RX tilt, where differential Z is not in anyway limited by tilt. So we don't expect to get *as much* benefit out of an SPI Y, but we'd definitely still get some if the chambers are left as is. However, we also know that the ISI local RX sensor noise can be improved by installing better CPS sensors, like we've done for the HAM7 HAM8 systems. So, the story is a little longer here, but still...

*Very* promising!

Next on the to-do list:
    (1) Gather HAM3-HAM2 data at different environmental times, to see whether any of the above conclusions from this one data set change.
    (2) Compare this differential GS13 and CPS data against Sina's projections for sensor noise
    (3) Use this (and other data we gather) data to try to concoct a control strategy
    (4) Use that control strategy to estimate the improved platform and suspension performance in various scenarios including
        (i) If we also improve the HAM-ISIs to use fine vertical CPS sensors
        (i) If we also improve PR3's top mass sensing noise
    (5) Present this kind of progress to the systems group
Non-image files attached to this report

Comments related to this report
A few more plots that show the sanity checks I made that went into the plots presented above:
    - HAM23_SPIMotivation_Z_CPS_ts.pdf Demonstrating that differential HAM3 Z - HAM2 Z is just the two time series subtracted, and there's no funny business going on in the time series data I used during this 3 hour time stretch.

    - HAM23_SPIMotivation_Z_GS13CPS_noise_and_cal_check.pdf Demonstrating that the calibration of the data all makes sense, as well as the projections and fudge factors of ~0.5 and 1.2 on the sensor noise are legit.

    - HAM23_SPIMotivation_Z_vs_DIFFZ_GS13.pdf showing GS13 inertial motion alone for both HAM2 and HAM3 compared to sensor noises.

    - HAM23_SPIMotivation_Z_vs_DIFFZ_CPS.pdf showing CPS ground-to-platform relative motion alone for both HAM2 and HAM3 compared to sensor noises.
Non-image files attached to this comment
The raw data for this aLOG has been downloaded and saved to
    /ligo/svncommon/SeiSVN/seismic/Common/Data/
        2023-06-09_0930UTC_HAM23_timeseries.mat

The script to make the plots from that data lives in
    /ligo/svncommon/SeiSVN/seismic/Common/SPI/Scripts/
        plot_spi_motivation_20230609.m
A quick screenshot to show where I got the "CPS Rolloff Frequency" for each of the blend filters

For the X, Y, and Z blend filter, which are all the "comp_250" filter, the CPS rolloff frequency is 0.34 Hz.
For the RX and RY blend filters, which are the "many_notches" filter, the CPS rolloff frequency is 0.60 Hz.
For the new RZ blend filter, called the "fc_yaw_filt_lp", the CPS rolloff frequency is at 0.34 Hz.

As a bonus, included in the screenshot is a reminder of what the CPS2CART and GS132CART matrices look like for sensor noise projection.
Images attached to this comment

Quick comment on the Noise projection plot
SEI_sensor_noise includes the local to cartesian-basis noise correction factors (added in 2021)
see SEI log 1786, or the help the SEI_sensor_noise
For Example.
>> freq = logspace(-1,2, 1000);
>> cps_noise_1mm = SEI_sensor_noise('ADE_1mm', freq);
>> proj = SEI_sensor_noise('projections');
>> stg1_cps_x_noise = proj.bsc.stg1.cps.x * cps_noise_1mm;
Regarding the influence of CPS DIFF on these results
J. Kissel, A. Pele, J. Warner
Arnaud reminded that CPS DIFF exists -- and asks the legit question "is CPS DIFF on, confusing your results and conclusions?"
In short: Yes, (HAM3-HAM2) CPS diff is ON, and influencing platform motion between 1.5 mHz and 0.48 Hz.
I then got a kitchen download from Jim, which I now convey here backed up with plots and MEDM screen screenshots. In general, CPS DIFF is really tough to find. You can find the "overview" that starts with
sitemap > ISI SENSCOR CONFIG > (upper right corner) Yellow Button "ISI DIFF" > CPS DIFF MTRX
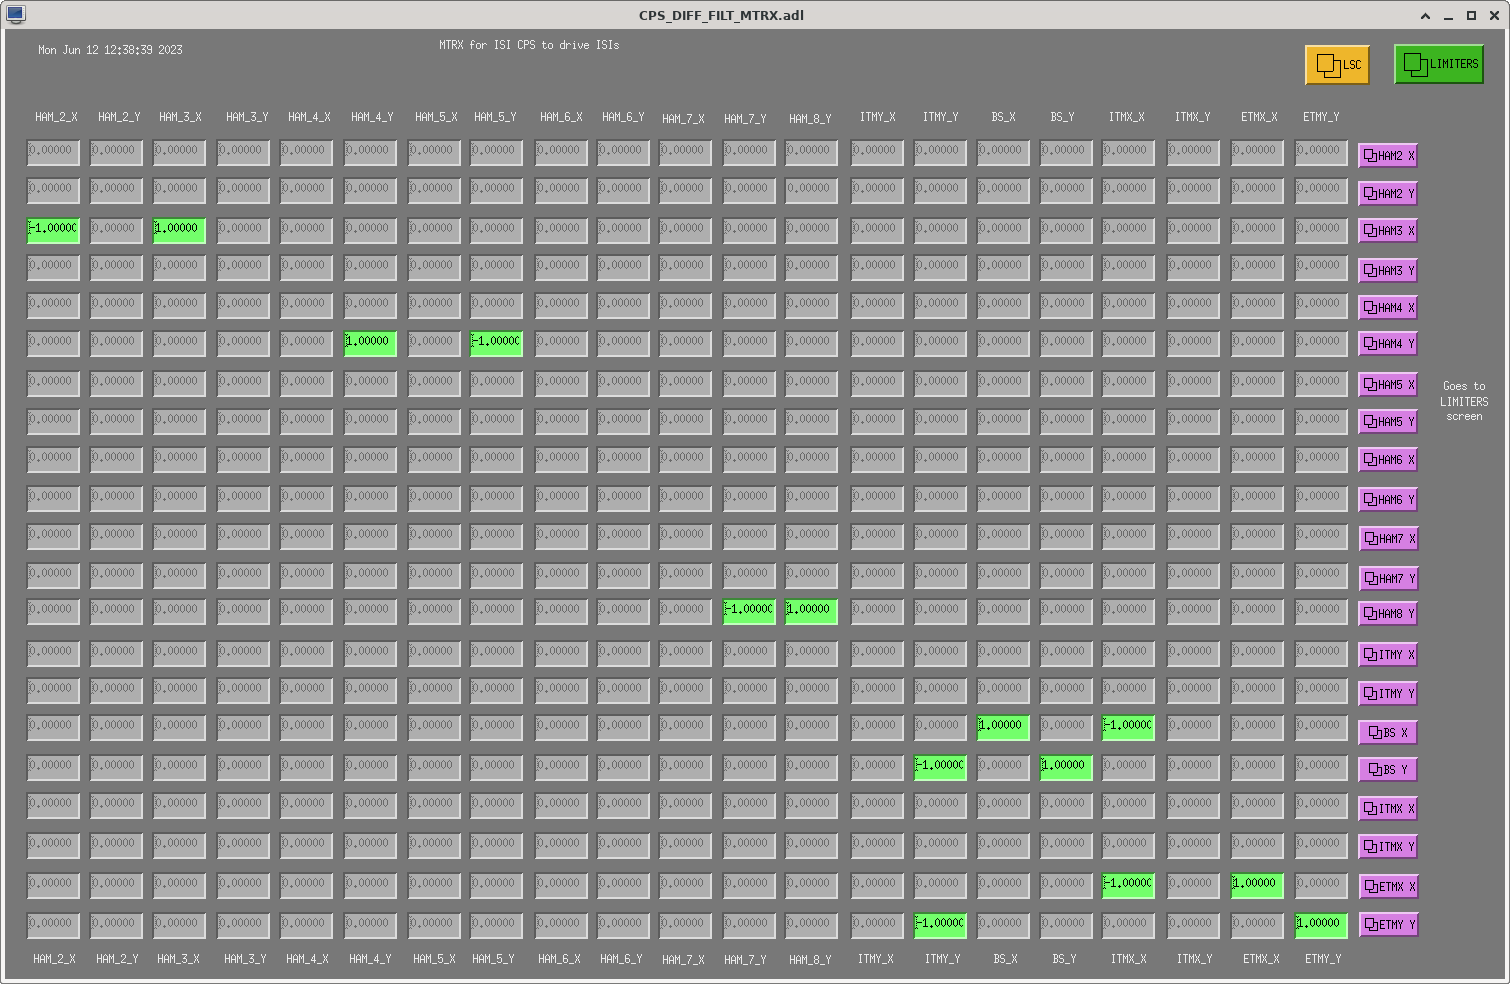
This brings up the "start" of CPS DIFF -- the 2023-06-12_ISICPSDIFF.png screen, which ingests calibrated local CPS signals (prior to their corner-station sensor correction from the ITMY T240 in the biergarten), and "simply" subtracts them. One can see that for the corner station HAMs, there are only the two pairs subtracted and only in the IFO's longitudinal direction: (HAM3 - HAM2) X and (HAM4 - HAM5) Y.
In these cases, HAM3 is the "leader" and HAM2 is the "follower," and similarly, HAM4 is the leader, and HAM5 is follower.
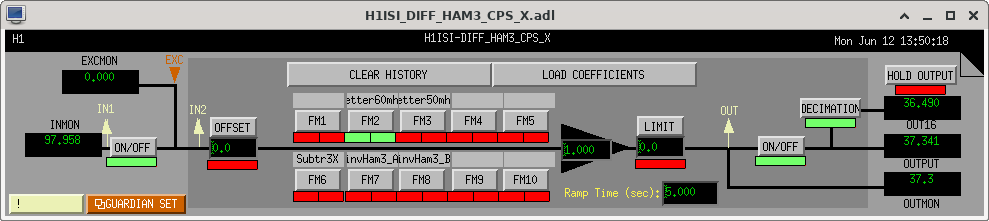
Following the HAM3-HAM2 signal, that differential CPS signal is then fed into a single filter bank, H1:ISI-DIFF_HAM3_CPSX (see screenshot).
That filter module in use in that HAM3 bank is "better60mHz," which is a band-pass
- "active" (magnitude greater than 10%) between 0.0015 - 0.48 Hz,
- "focused" (magnitude greater than 90%) 0.022 - 0.088 Hz.
- "centered" (phase is 0 deg) on 0.034 Hz
See the response of this filter in 2023-06-12_ISICPSDIFF_HAM3-HAM2_better60mHz_Filter.png.
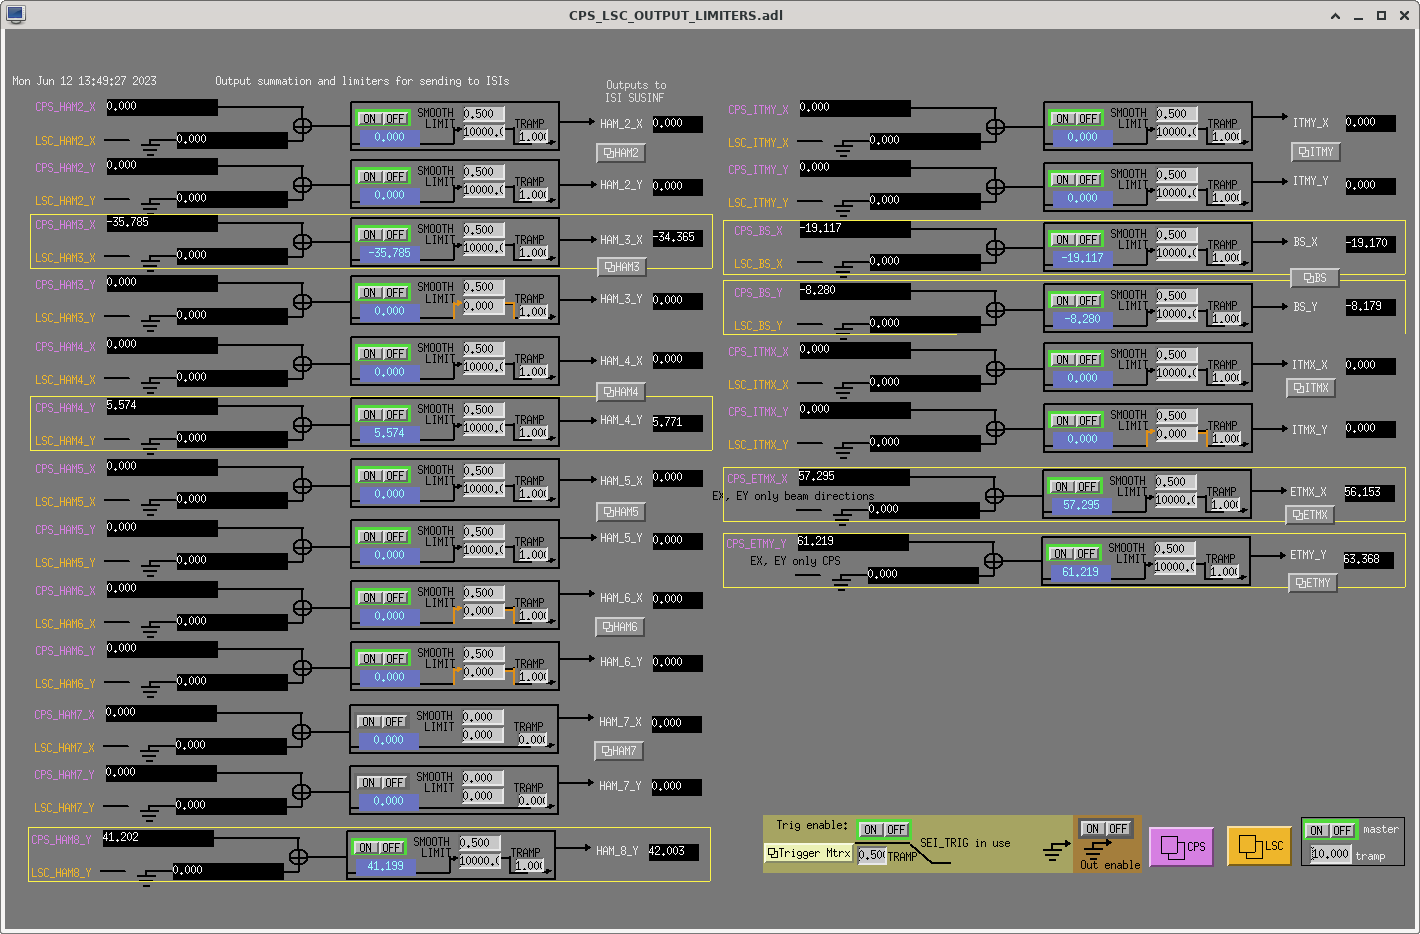
The output of that filter bank output is feed into a "soft limiter" that limits the signal to less than 10000 [nm] = 10 [um]. (see 2023-06-12_ISICPSDIFF_SmoothLimiter.png)
The typical counts coming out of our band-limiter is low 10s [nm] oscillating around 0 [nm], which maximum minute of the trends being at most 100-150 [nm], so *plenty* of head room. So, in short, the soft limiter it's doing anything.
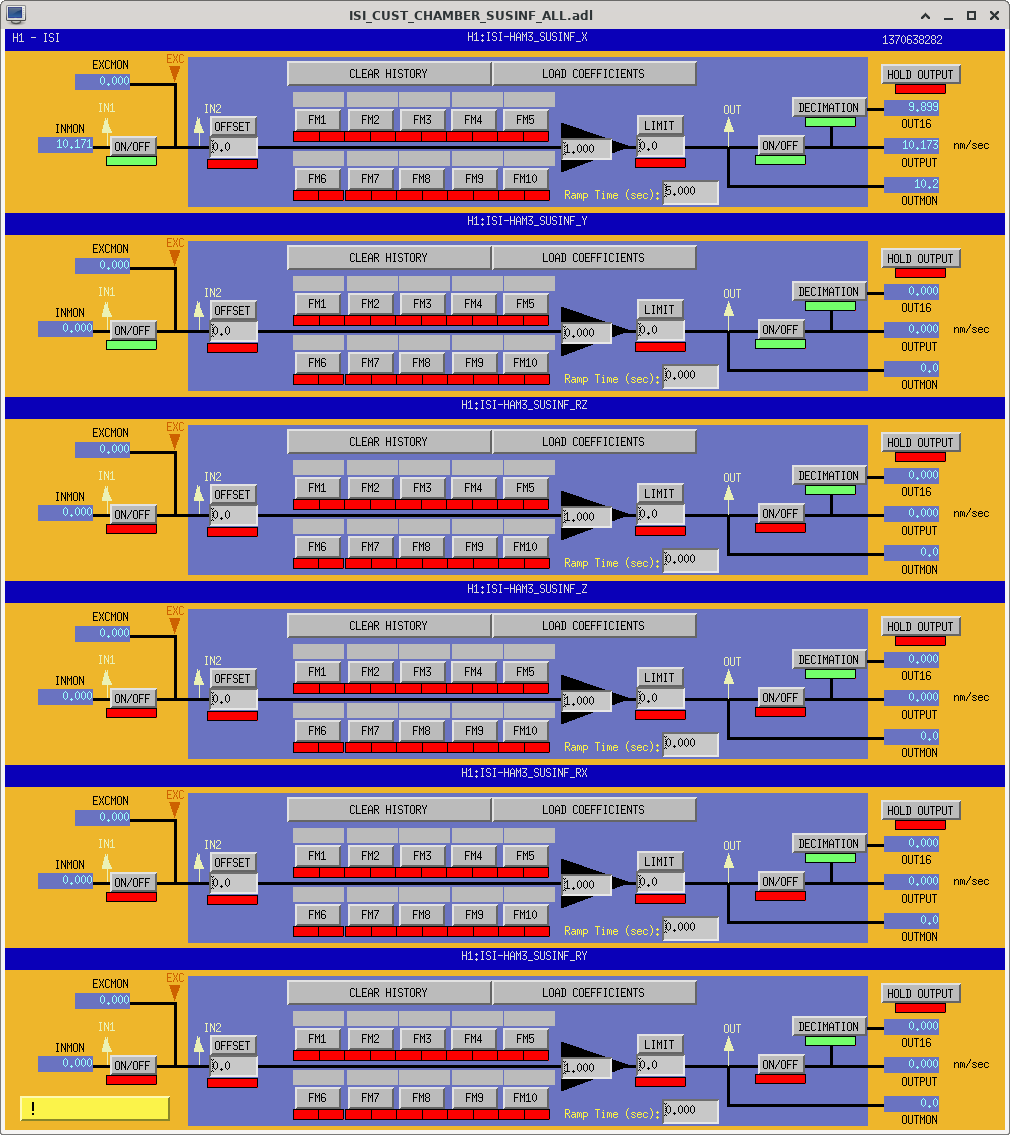
The output of the soft limiter goes into the "leader" ISI's SUSINF "suspension input filter" H1:ISI-HAM3_SUSINF_X bank (see 2023-06-12_ISIHAM3_SUSINF.png), which again is the longitudinal direction of the IFO across HAM3-HAM2.
Finally, this output is summed into the *output* of the blend filters, i.e. the super sensor error signal for the X DOF's isolation filters.
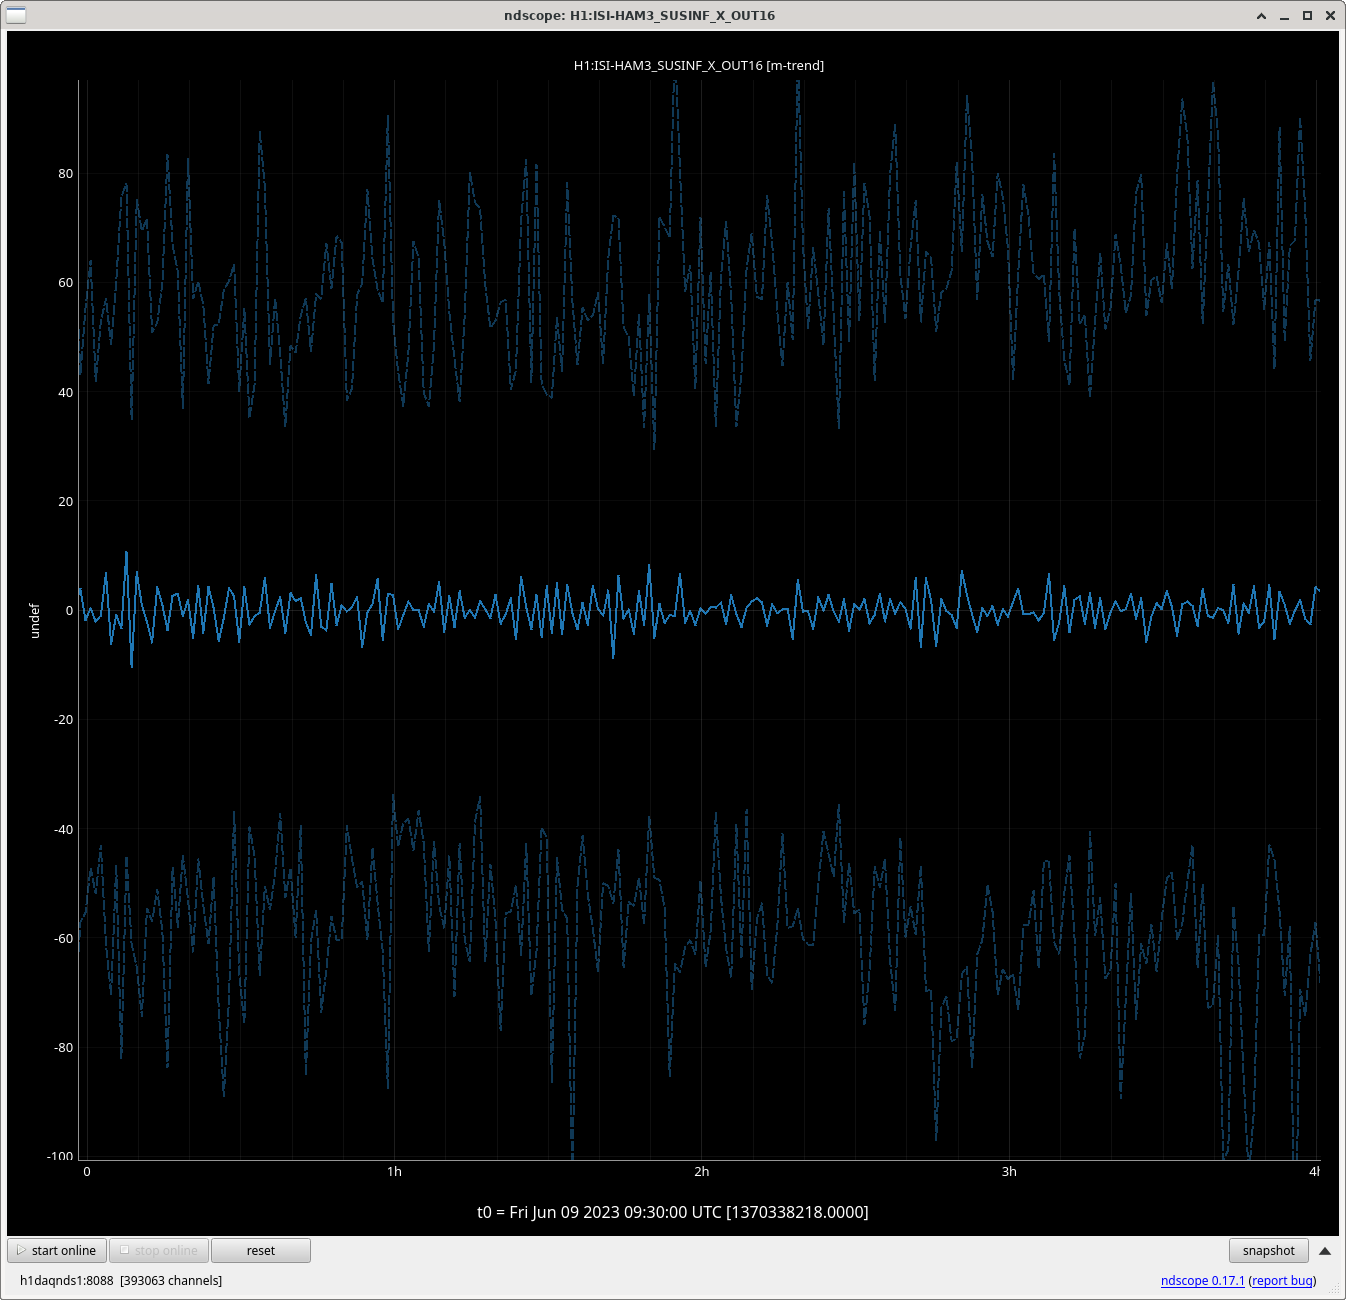
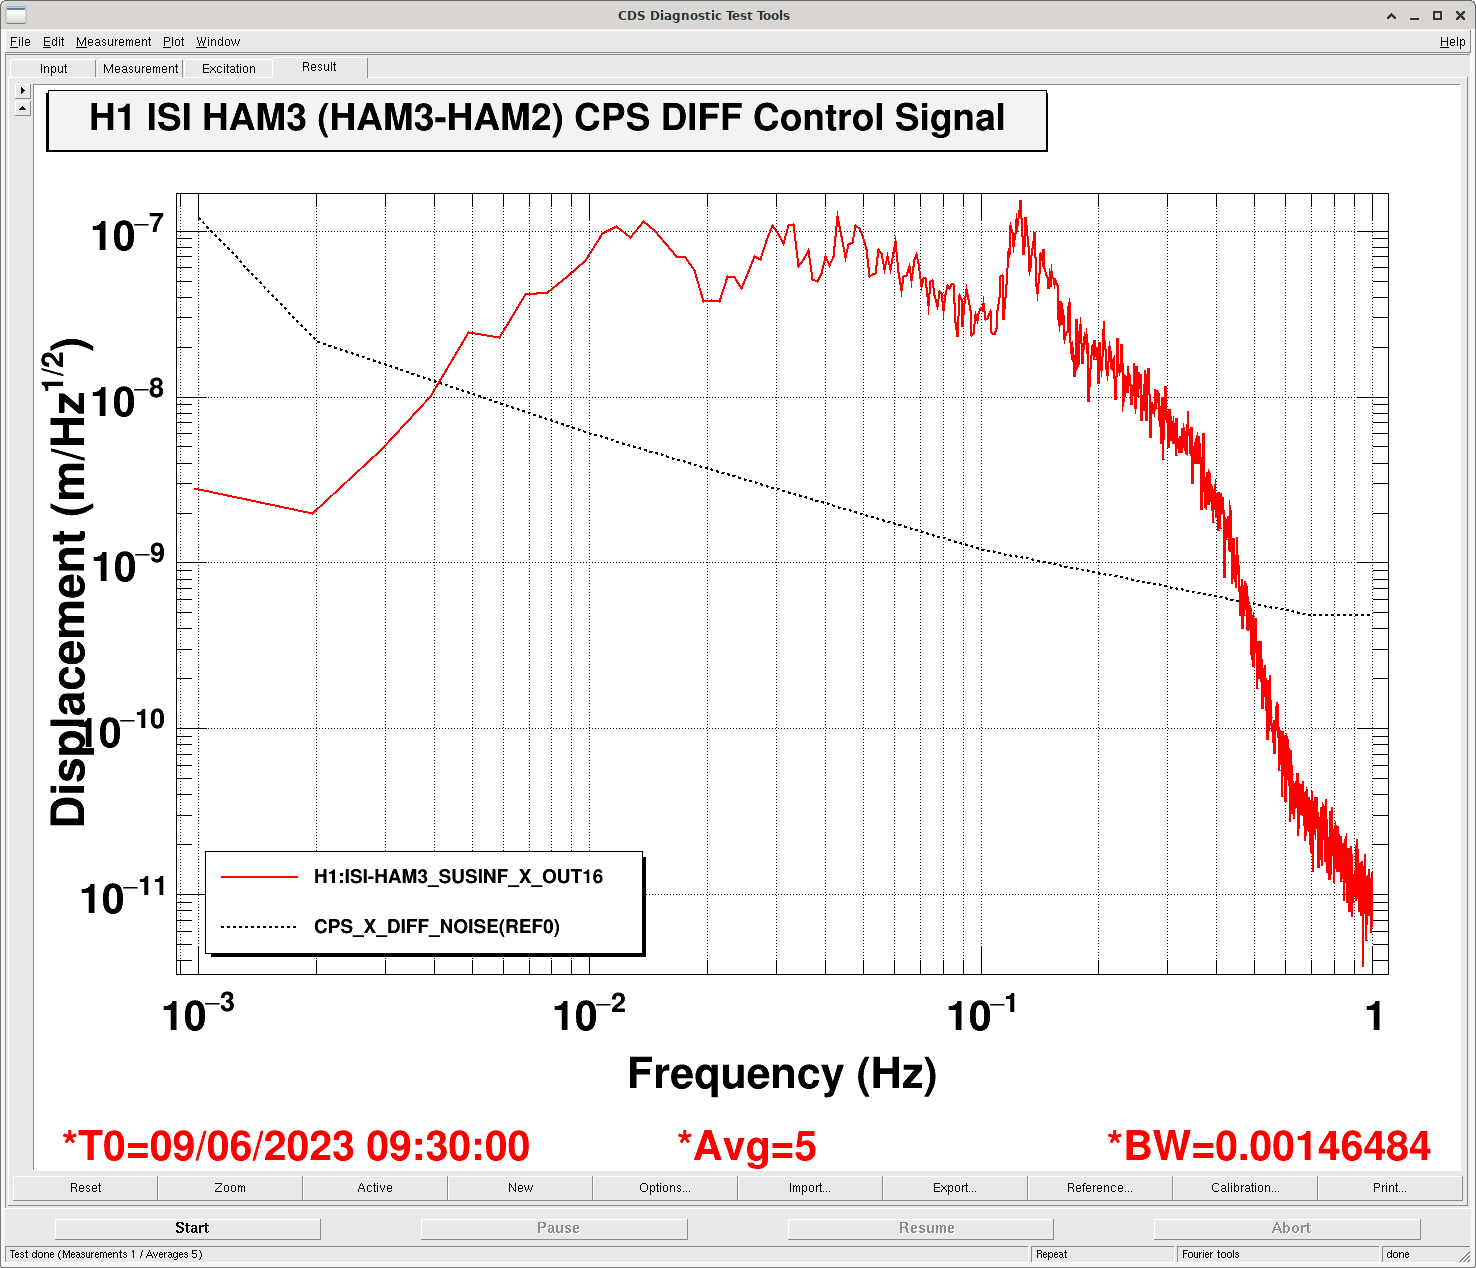
2023-06-12_0930UTC_ISICPSDIFF_HAM3-HAM2_ControlSignal_3hrMinuteTrend.png shows the minute trend of the HAM3-HAM2 CPS DIFF band-limited control signal for the 3 hour stretch on 2023-06-09 09:30 UTC that I took the data in the main aLOG. 2023-06-12_0930UTC_ISICPSDIFF_HAM3-HAM2_ControlSignal_ASD.png shows the amplitude spectral density compared against CPS X DIFF = sqrt(2) * HAM "1 mm" ADE CPS X sensor noise (using the handy feature of SEI_sensor_noise Brian reminds me of above -- thanks Brian!).
This amplitude spectral density is consistent with the shape and amplitude of the (HAM3-HAM2) offline concocted ASD differential signal above 2023-04-13_0000UTC_HAM23_SPIMotivation_spiprcl_LOCALX_vs_DIFFX.pdf.
I attribute the difference in shape due to different averaging, windowing, and % overlap, and FFT parameters, so don't look too closely. This needs to be done more carefully offline, and I will eventually.
So,
- (HAM3-HAM2) CPS DIFF is *already* doing the same job that I describe that a future SPI L "the ifo part" connecting HAM3-HAM2 would do.
- Deciding which would do it *better* and/or which we should use in which frequency region is a question of which will have better sensor noise.
- Both should be a part of the discussion.
- CPS DIFF does *not* play a role in any of the material / data / plots discussing SPI P and SPI Y, since HAM3-HAM2 Z (for P) and HAM3-HAM2 Y (for Y) do not have any CPS DIFF.
Note, the plan to improve the "the HAM2 HAM3 CPS" won't impact this assessment; at the moment, we're only considering upgrading the *vertical* CPS sensors on the HAMs.
Images attached to this comment