Daniel, Sheila
We turned off the 9 Mhz, 45 MHz, and 117 MHz sidebands in order to do an OMC loss measurement. We used a single bounce beam off of ITMX, with 10W input from the PSL. We spent some time trying to improve the alignment before making OMC scans.
locked: 1370711576 (OMC REFL avg 3.51mW, OMC DCPD sum 15.23mA)
unlocked: 1370711782 (OMC REFL avg 24.73 mW, OMC DCPD sum 0.078 mA)
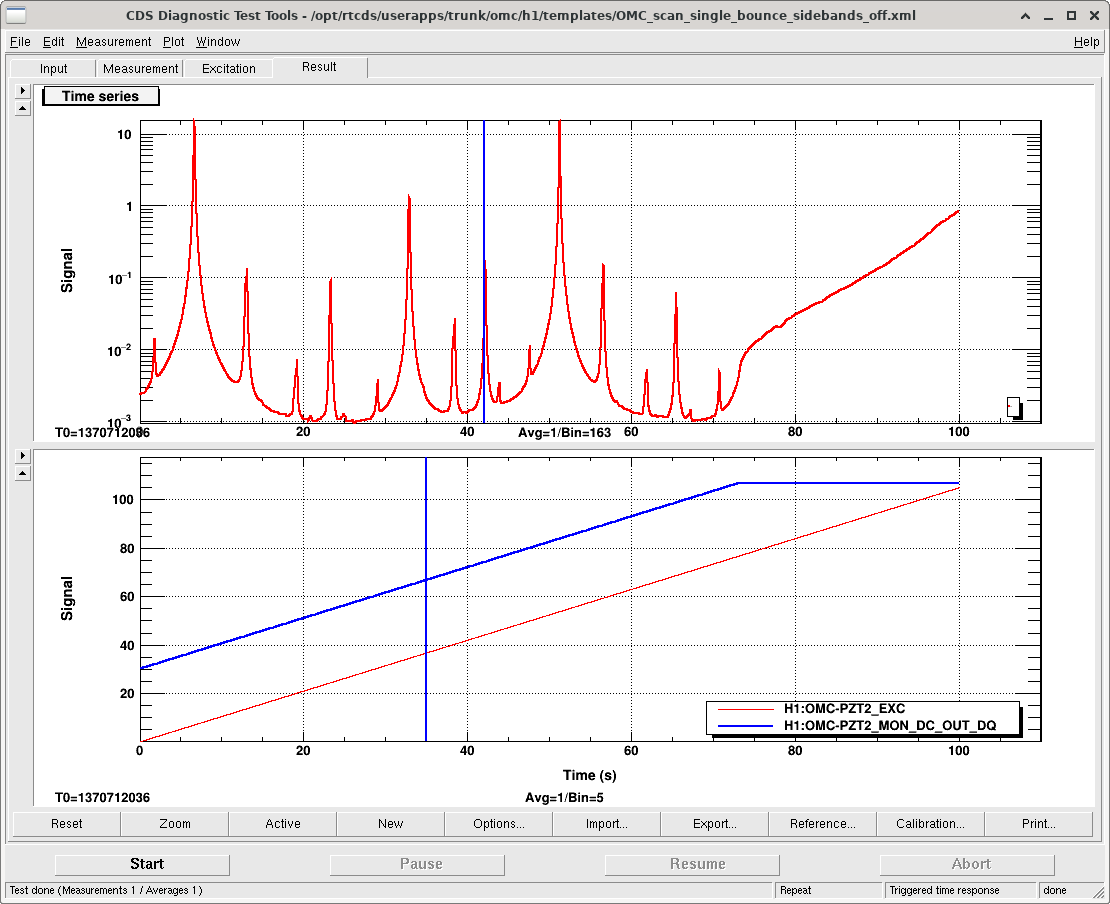
OMC scan start: 1370712036 duration 100 seconds (2nd order modes are roughly 8% of the 00 mode).
shutter blocked: 1370712337 (OMC REFL avg -0.030 DCPD SUM 8e-4 mA).
Jennie Wright plans to analyze this data to estimate OMC losses.
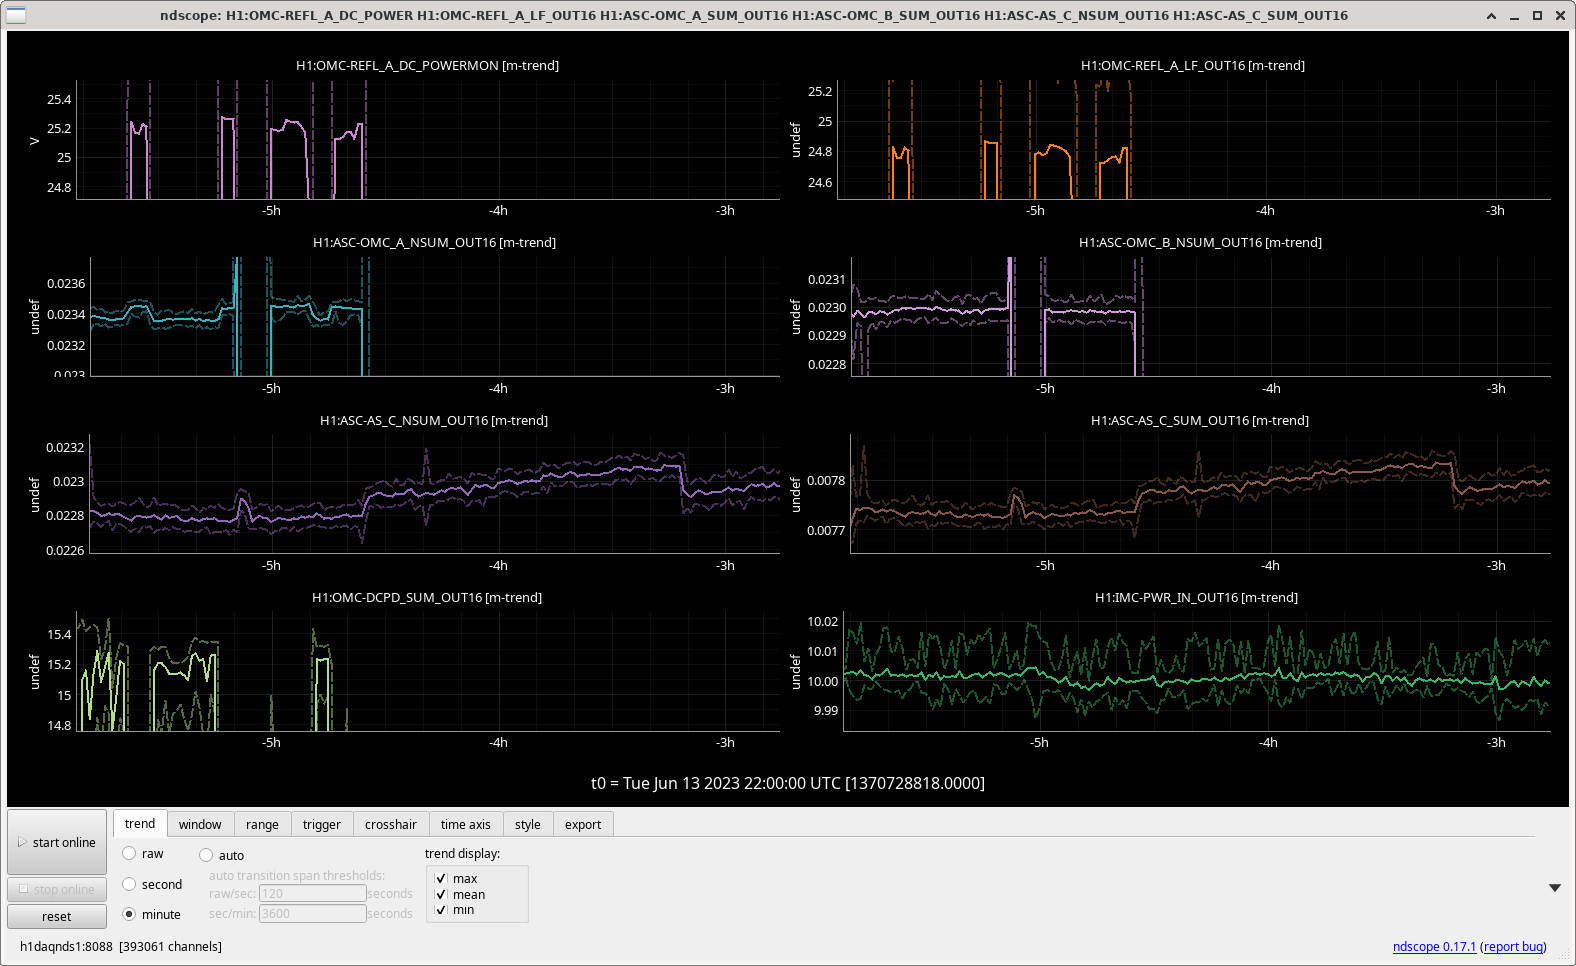
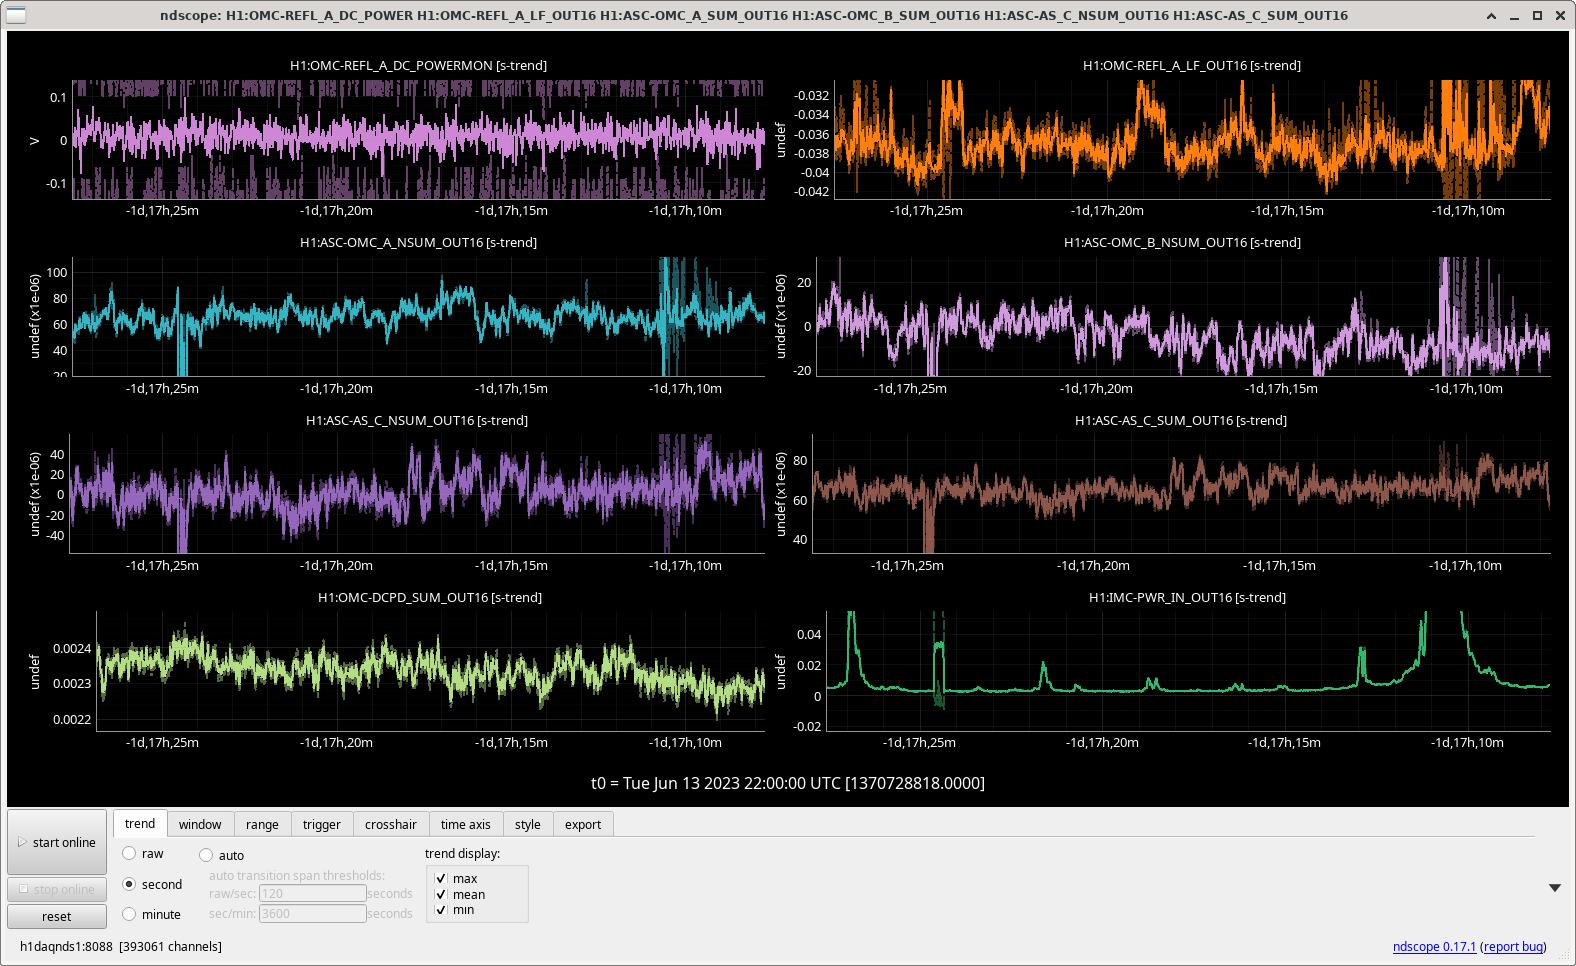
Here are the plots of ASC-AS_C_NSUM, OMC-QPD_A_NSUM, OMC-QPD_B_NSUM and OMC-REFL_A_LF, during these measurements. ASC-AS_C_NSUM shows between 22.8 and 32.1mW, OMC-QPD_A_NSUM 23.4mW, OMC-QPD_B_NSUM 23.0mW, and OMC-REFL_A_LF 24.8mW. According to Keita OMC-REFL_A_DC has an incorrect calibration and shows 25.2mW. The average of the 2 QPDs would be 23.2mW, which is about 6.5% lower than 24.8mW.
Second screen shots shows a time when the IMC was unlocked. The DC offsets are in the 10s of uW at most.
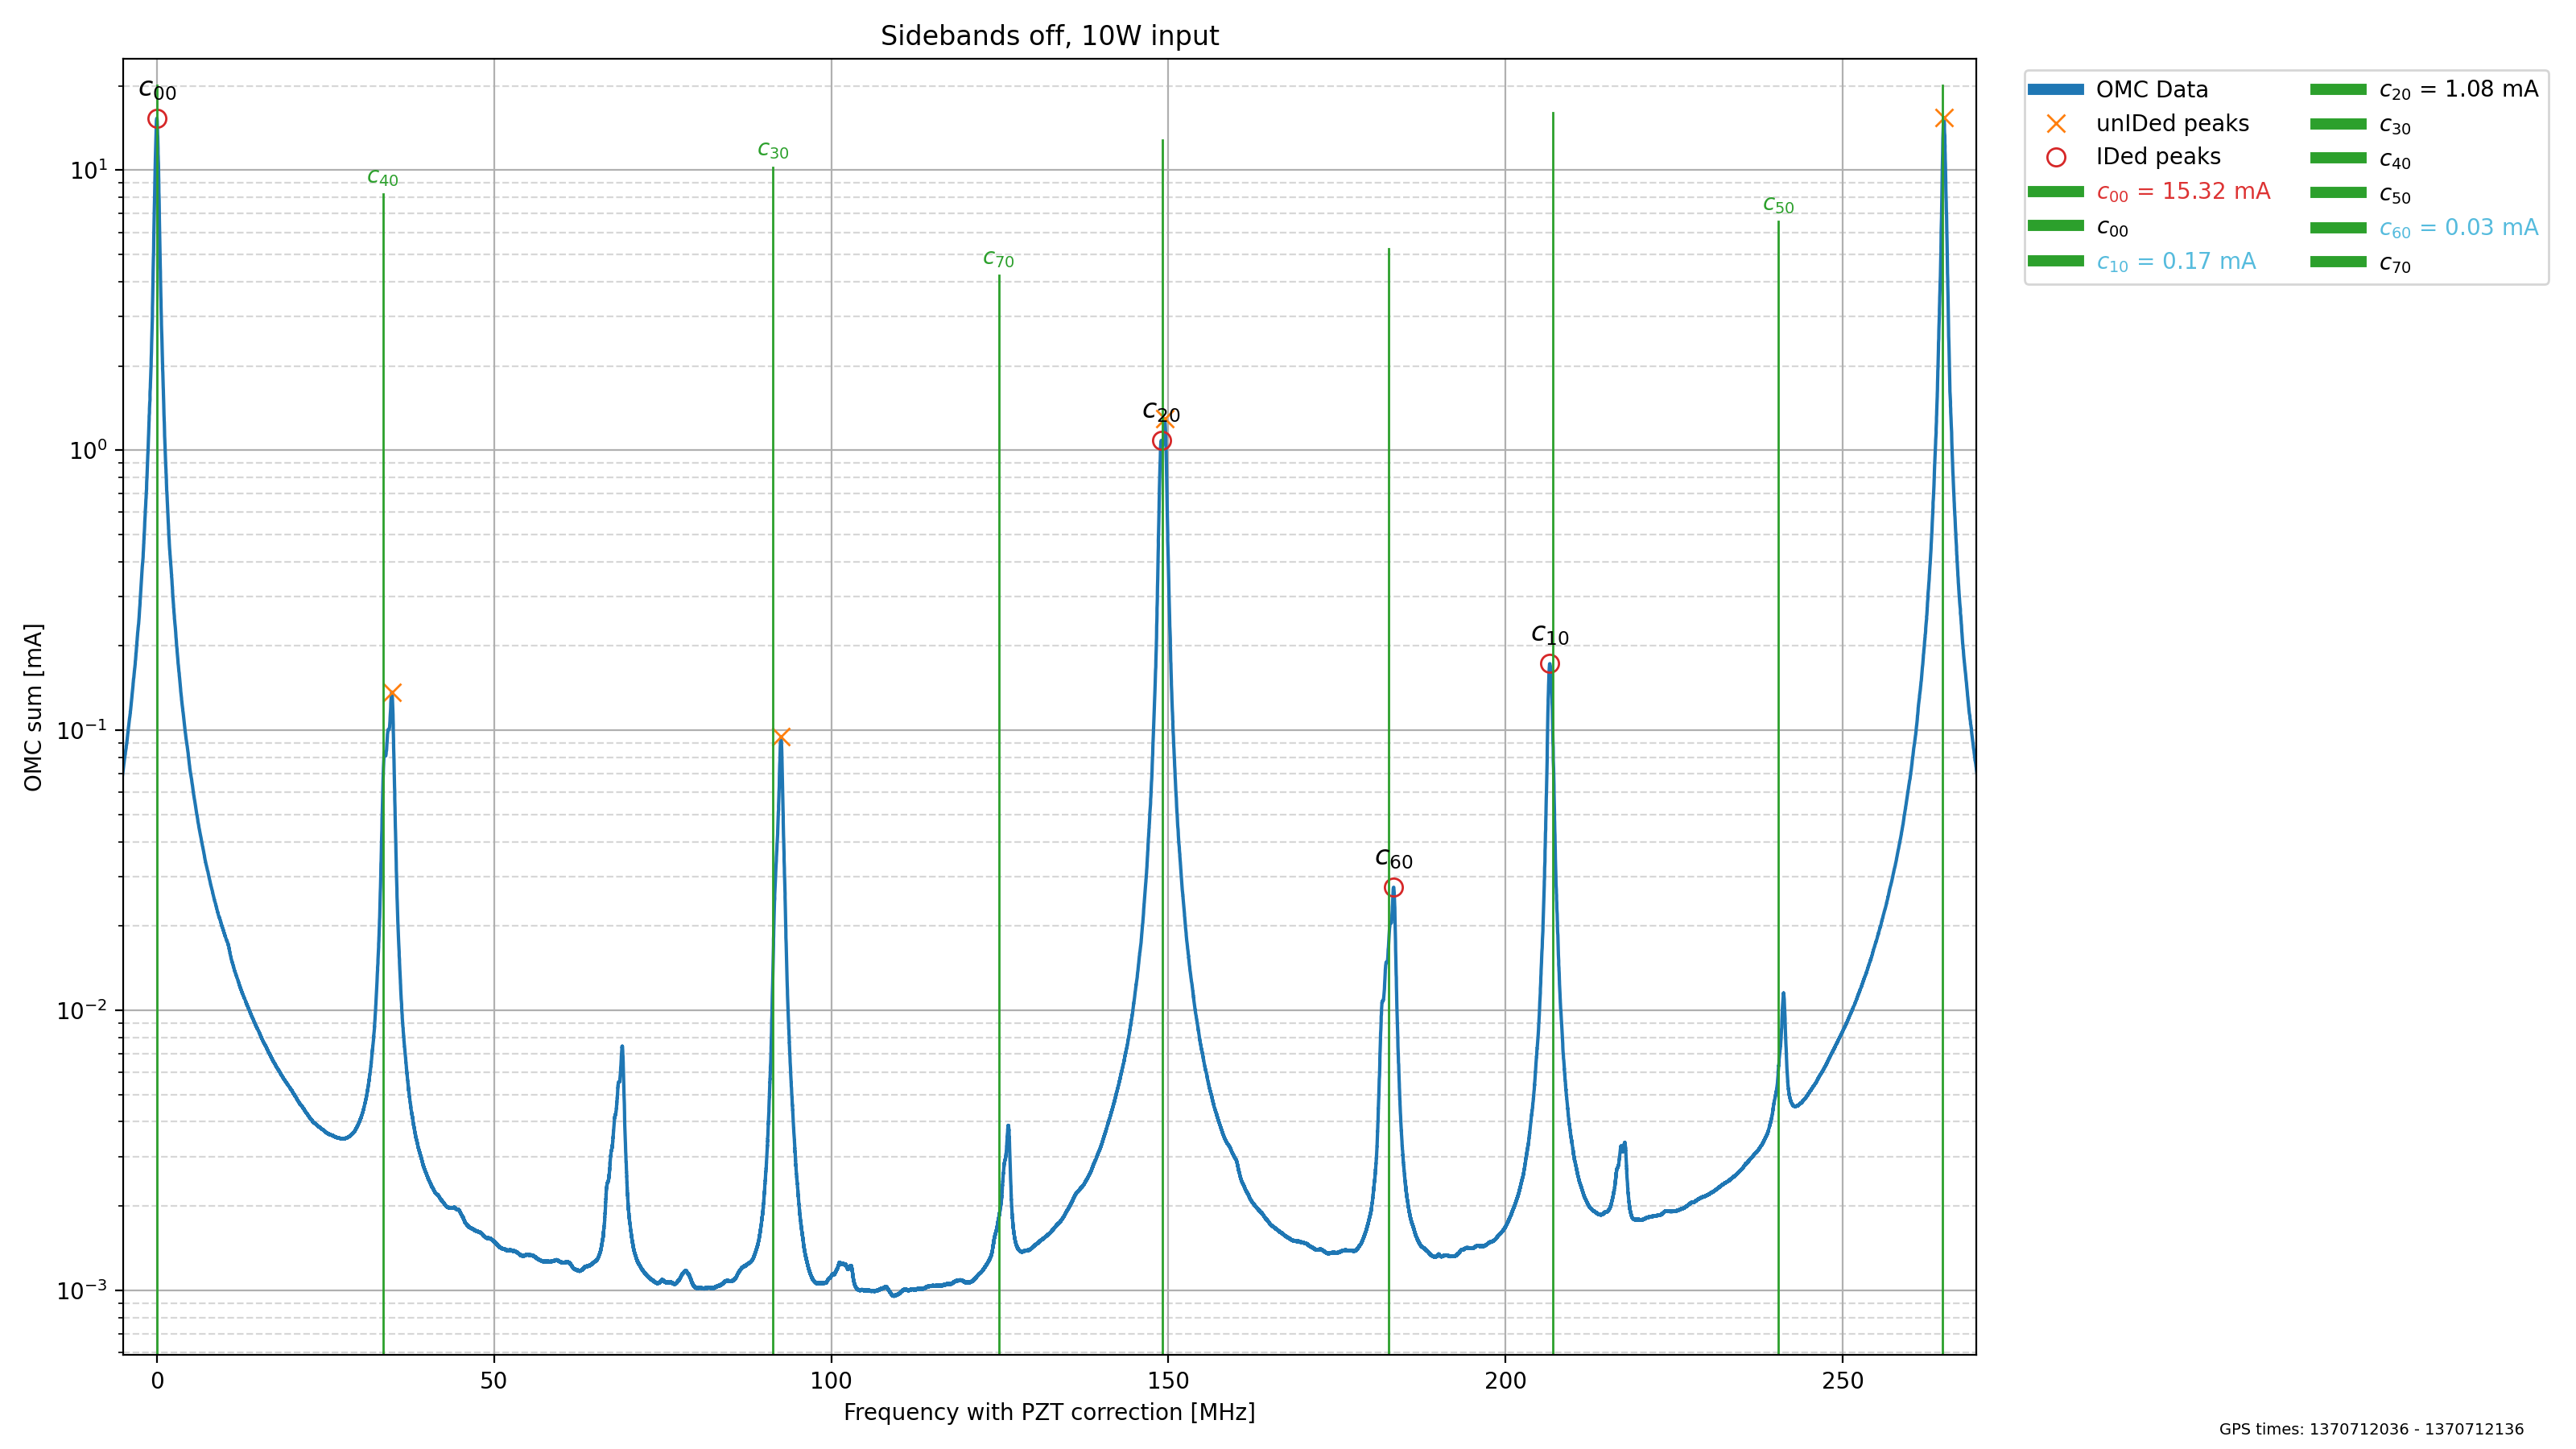
Using data from the scan I adapted labutils/OMCscan class to plot the fitted scan and adapted labutils/fit_two_peaks.py to fit a sum of two lorentzians functions for distinguishing carrier 20/02 modes.
The first graph is the OMC scan plot, the second is the curvefit for the second order carrier modes.
We expect the HOM spacing to be 0.588 MHz as per this entry and DCC T1500060 Table 25.
The spacing for the modes measured is 0.592 MHz.
From the heights of the two peaks this suggests mode-mismatch of the OMC to be C02+C20/C00 = (0.83+1.158)/(15.32+0.83+1.158) = 11.0% mode mis-match.
From the locked/unlocked powers on the OMC REFL PD the visibility on resonance is 1-(3.51+0.03/24.73+0.03) = 85.7% visibility.
If the total loss is 14.3%, this implies that the other non mode-matching losses are roughly 1.3%.
To run the OMC scan code go to
/ligo/gitcommon/labutils/omc_scan/ and run
python OMCscan_nosidebands.py 1370712036 100 "Sidebands off, 10W input" "single bounce" --verbose --make_plot -o 2
in the labutils conda environment and on git branch dev.
To do the double peak fitting run:
python fit_two_peaks_no_sidebands.py
in the labutils conda environment and on git branch dev.

These scans were done with OM2 cold.
For comparison with new OMC measurements I used Sheila's code to process the visibility, but updated dit to use nds2utils instead of gwpy as I was having trouble using it to get data.
The code is attached and should be run in the nds2utils conda environment on the CDS workstations.
Power on refl diode when cavity is off resonance: 24.757 mW
Incident power on OMC breadboard (before QPD pickoff): 25.239 mW
Power on refl diode on resonance: 3.525 mW
Measured effiency (DCPD current/responsivity if QE=1)/ incident power on OMC breadboard: 70.4 %
assumed QE: 100 %
power in transmission (for this QE) 17.760 mW
HOM content infered: 13.472 %
Cavity transmission infered: 82.111 %
predicted efficiency () (R_inputBS * mode_matching * cavity_transmission * QE): 70.367 %
omc efficency for 00 mode (including pick off BS, cavity transmission, and QE): 81.323 %
round trip loss: 1605 (ppm)
Finesse: 371.769
