My earthquake analysis finds ground velocities at the time of earthquake peaks then finds if it is responsible for lock loss. For more details for how an earthquake is defined, refer to the LLO alog: https://alog.ligo-la.caltech.edu/aLOG/index.php?callRep=65657
In O3, there were 434 total earthquake events detected at H1; the detector lost lock for 194 and survived 240 of these earthquakes. In the first five weeks of O4 (May 24 - June 28, 2023), there were 73 total earthquakes at H1; the detector lost lock for 46 and survived 27 earthquakes. Thus, the probability of survival at H1 for O3 is 0.530 and for O4 is 0.370.
So far, the probability of H1 surviving an earthquake event in O4 is lower than the survival probability in O3.
There are 8 attached plots. The editor won't let me post the plots in-text, so I've attached them.
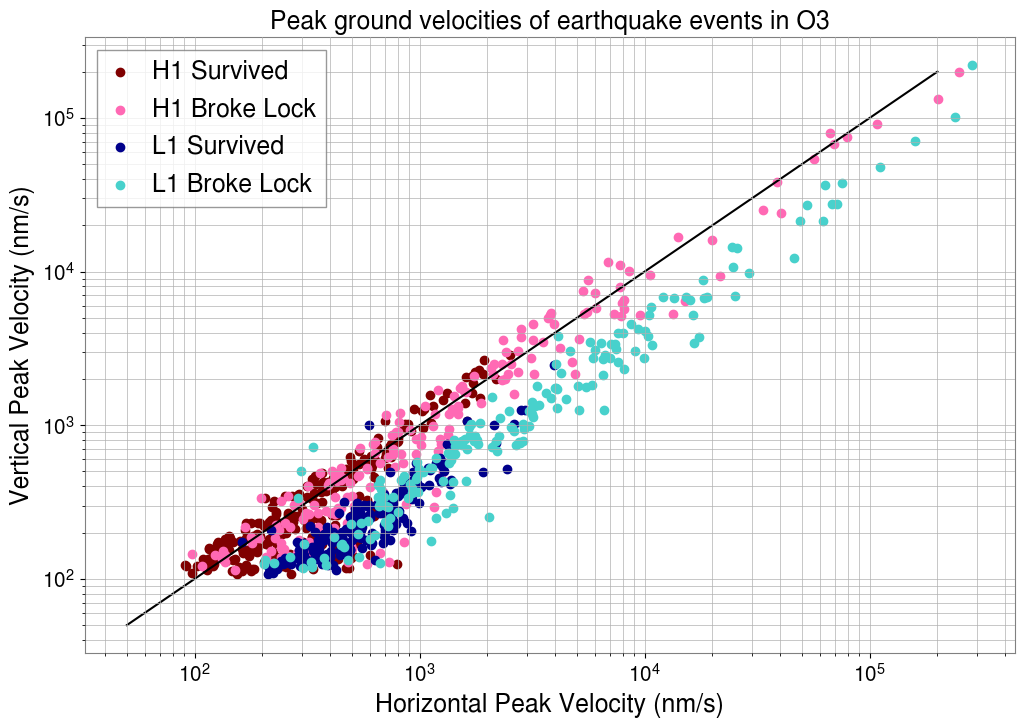
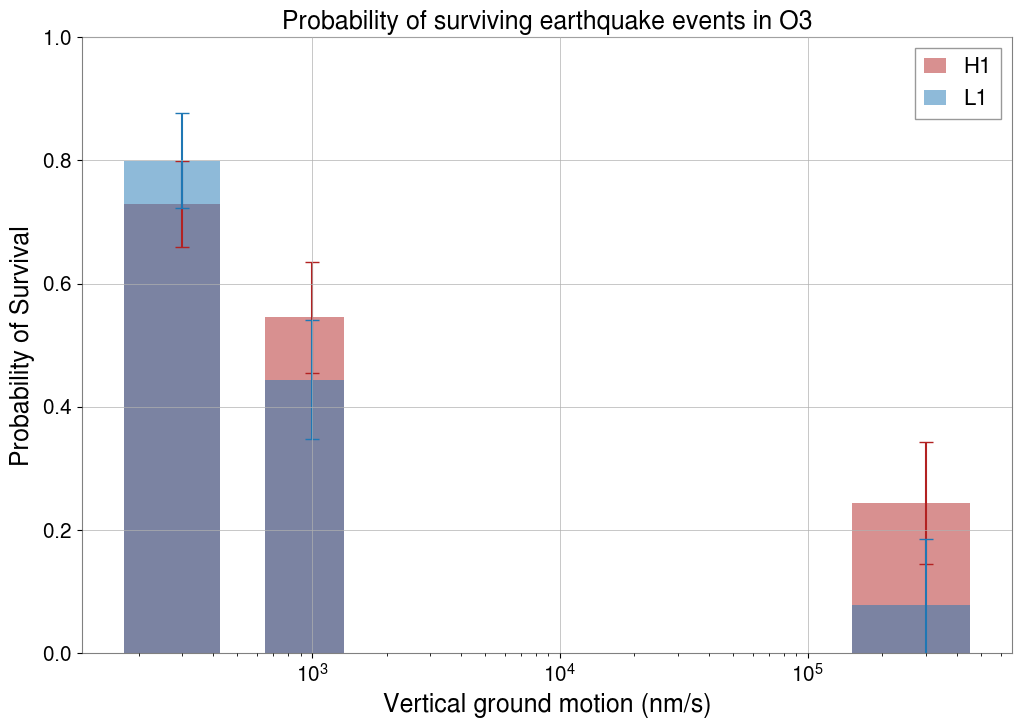
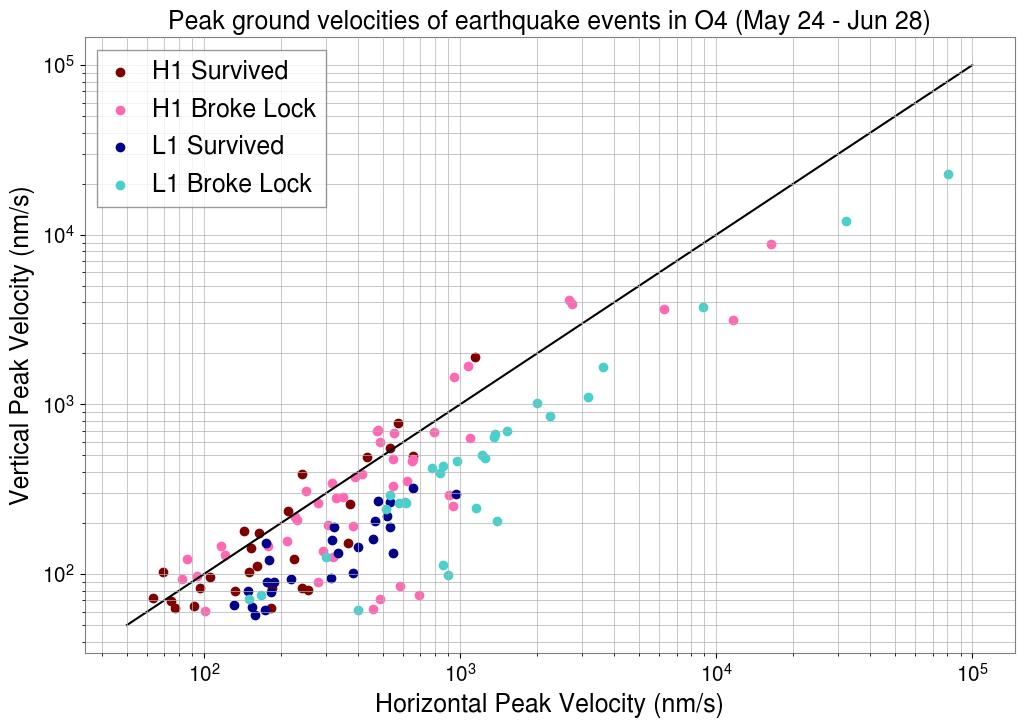
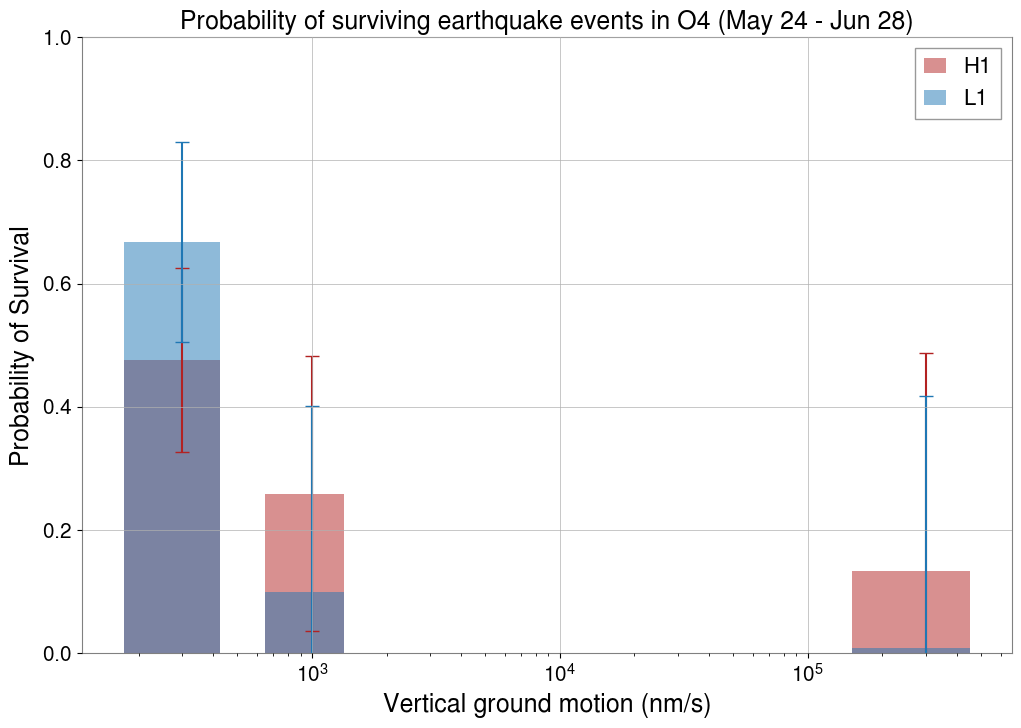
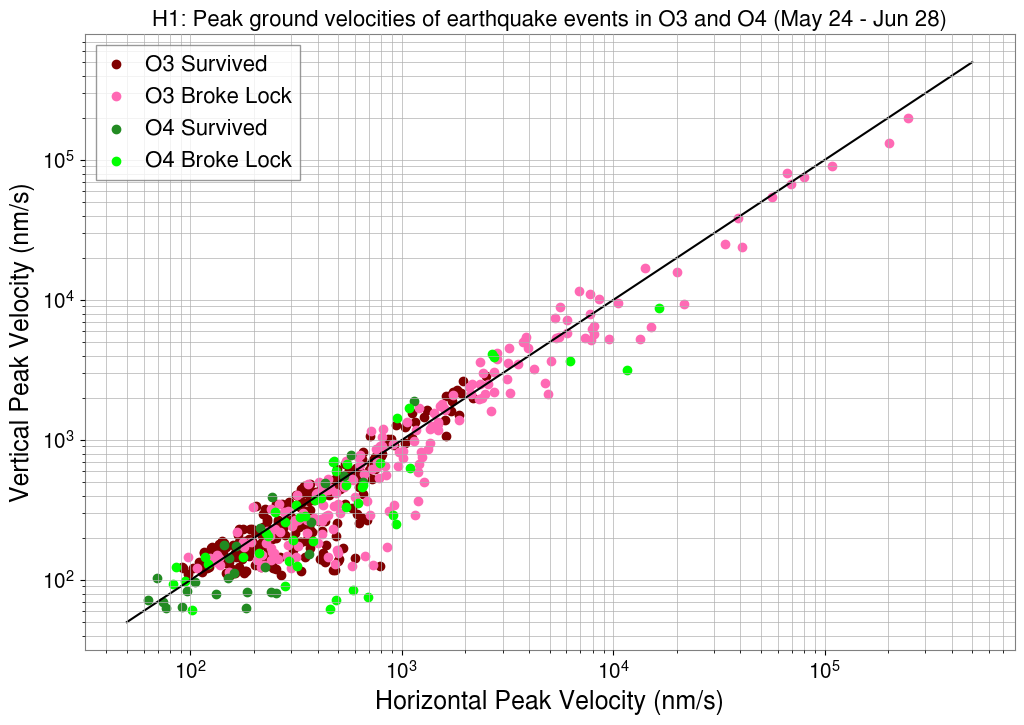
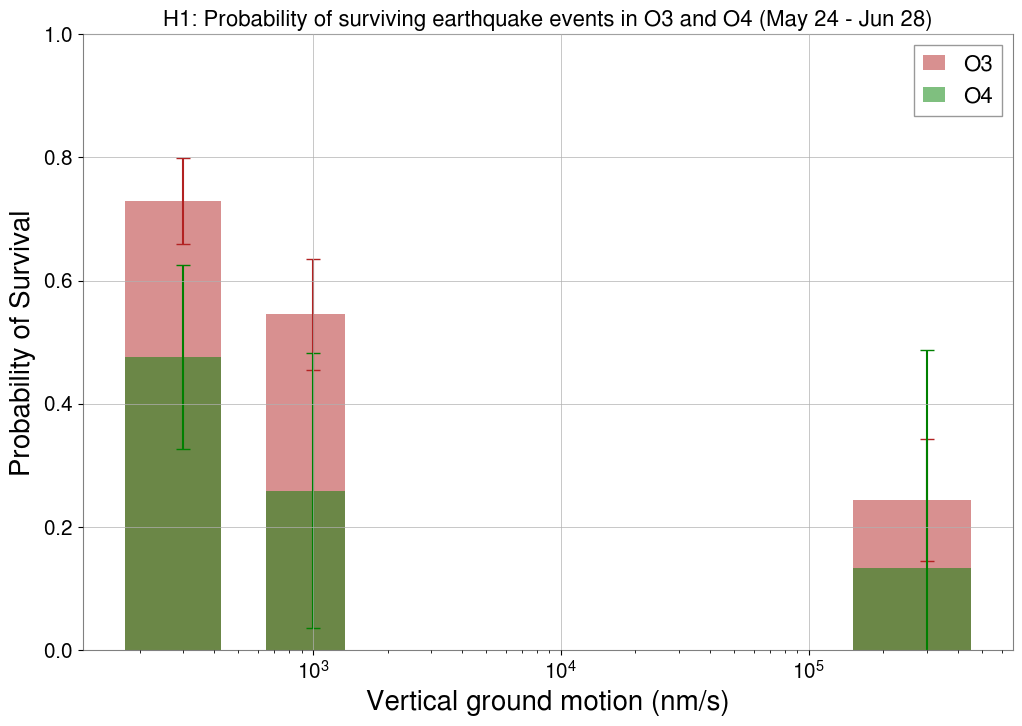
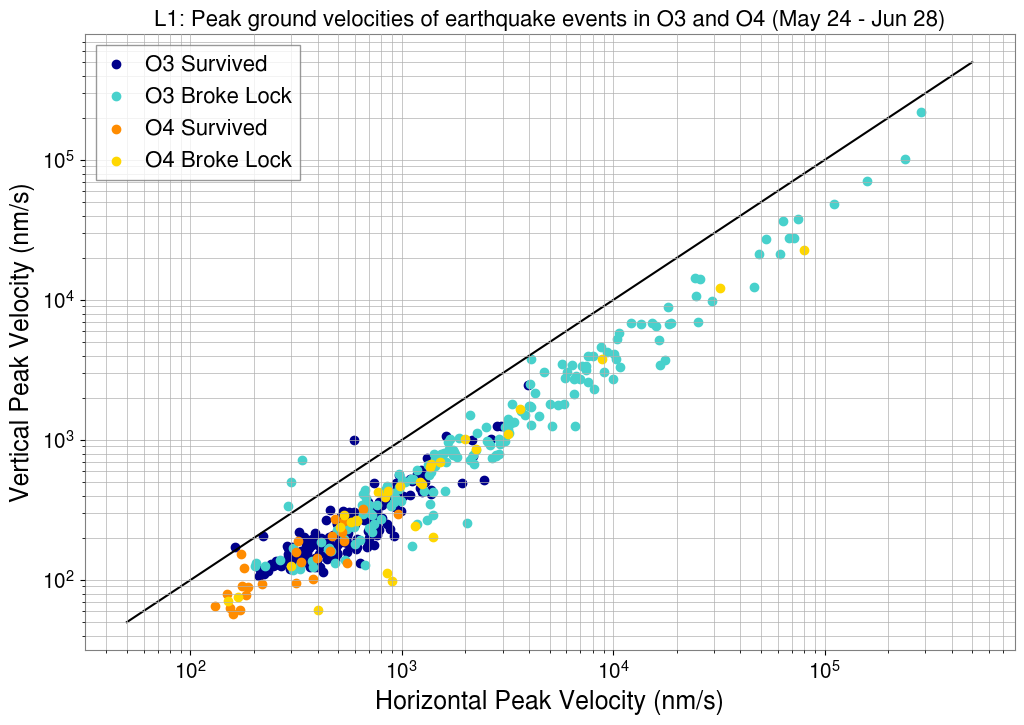
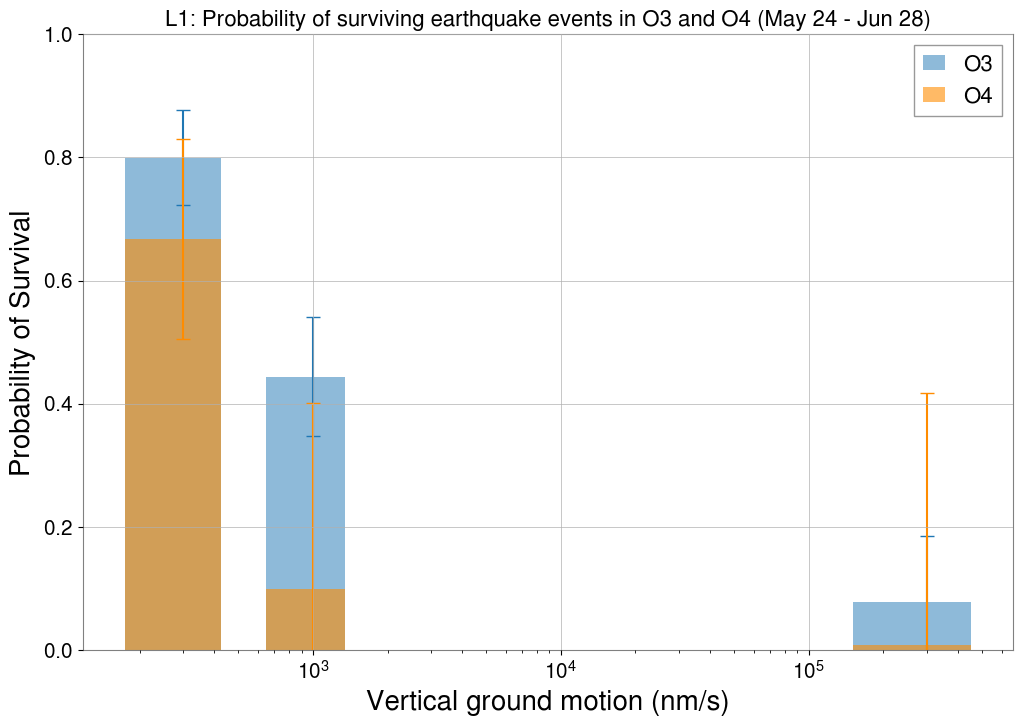
Four of the attached plots show the peak vertical/horizontal ground velocities of each earthquake and if the detector survived or not. Each of these plots is followed by a histogram of the survival probability at different bins of vertical velocities. Information about the number of survived and total earthquakes in each bin is provided beneath each set of plots. All probability plots are separated by the same peak vertical velocity bins: [50, 300, 1000, 300000] (nm/s). The error bars are calculated as 1/sqrt(total earthquakes in bin).
- O3H1L1peakvelocities.png, O3H1L1peakprobability.png
- H1, O3:
(49.999, 300.0]      149 survived, 207 total
(300.0, 1000.0]       67 survived, 125 total
(1000.0, 300000.0]     24 survived, 102 total
- L1, O3:
(49.999, 300.0]      132 survived, 167 total
(300.0, 1000.0]       47 survived, 108 total
(1000.0, 300000.0]      6 survived, 87 total
- H1, O3:
- O4H1L1peakvelocities.png, O4H1L1peakprobability.png
- H1, O4:
(49.999, 300.0]       21 survived, 45 total
(300.0, 1000.0]        5 survived, 20 total
(1000.0, 300000.0]     1 survived, 8 total
- L1, O4:
(49.999, 300.0]       25 survived, 38 total
(300.0, 1000.0]        1 survived, 11 total
(1000.0, 300000.0]     0 survived, 6 total
- H1, O4:
- H1O3O4peakvelocities.png, H1O3O4peakprobability.png
- L1O3O4peakvelocities.png, L1O3O4peakprobability.png