Mode matching of the single bounce beam to the OMC is really bad and we don't know why. We don't even know the beam shape of the single bounce beam hitting the OMC. I constrained the beam shape by looking at the OMC scan data.
There are many OMC single bounce scans but the most recent two w/o RF SBs, one with cold and the other with hot OM2, were carefully analyzed by Jennie to resolve 02 and 20 mode as separate peaks (alogs 70502 and 71100), so I used them here.
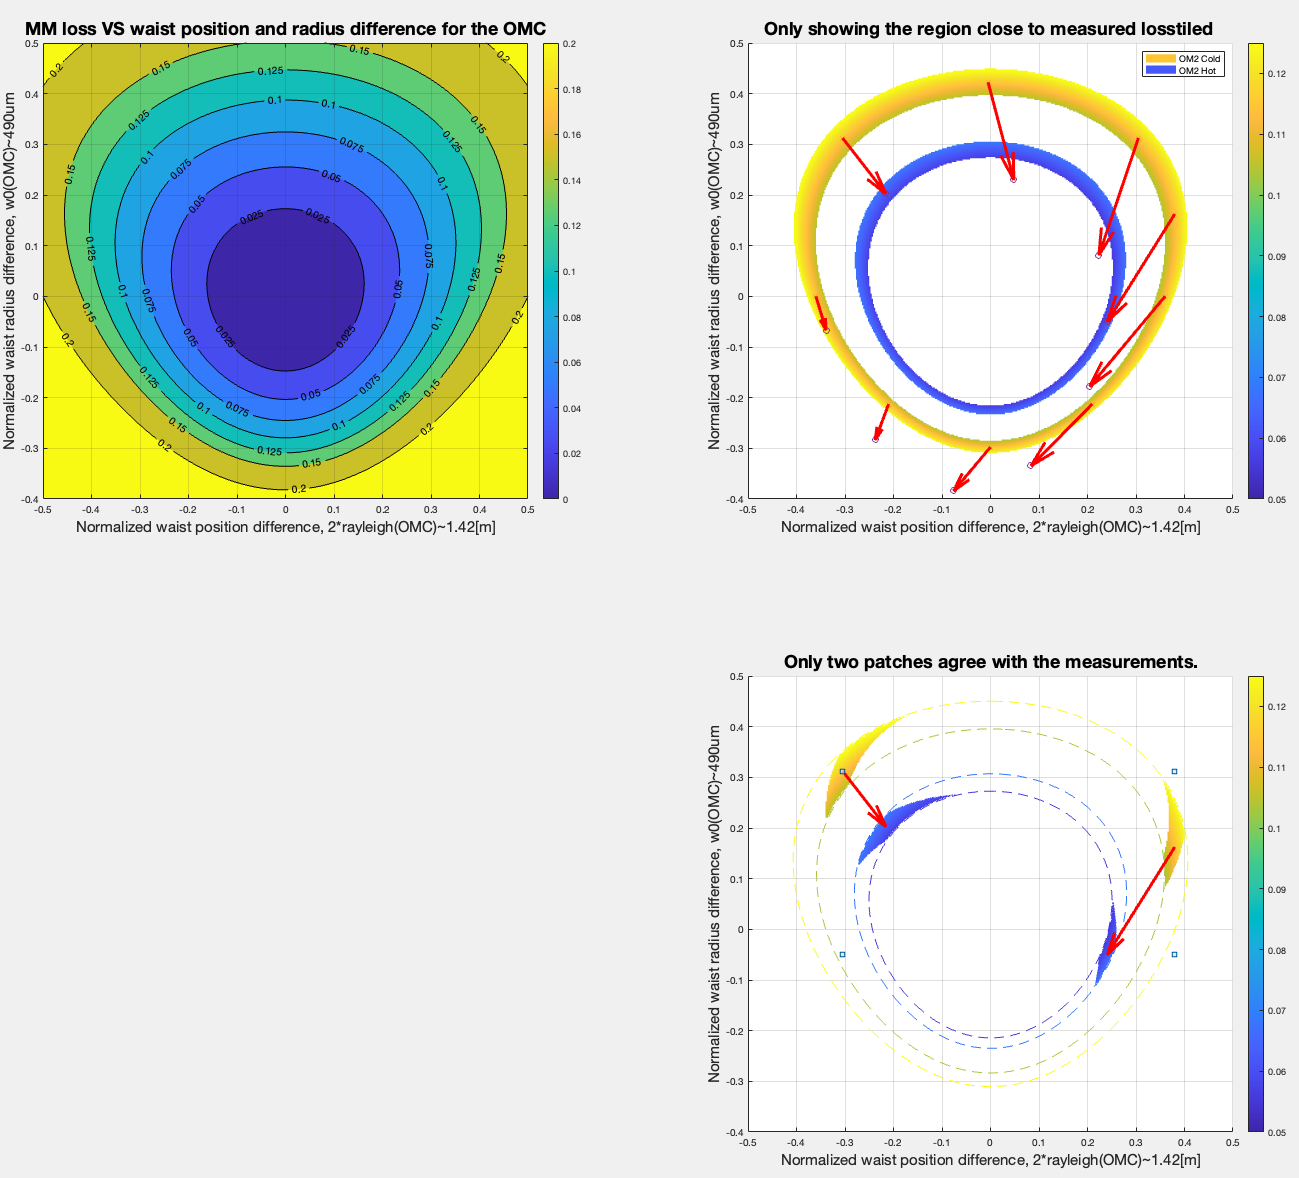
If you just want to see the results, look at the third panel of the first attachment.
X-axis is the normalized waist position difference, Y-axis is the normalized waist radius difference. From the measured cold mode matching loss of 11.5%(!!) and hot loss of 6.2%, and the fact that the loss changed by only changing the ROC of OM2, the beam parameters hitting the OMC were constrained to two patches per each OM2 ROC. Yellow is when OM2 is cold, blue is when OM2 is hot. Arrows show how cold (yellow) patches are transformed to hot (blue) patches when OM2 ROC is changed by heating.
Note that we're talking about inconceivably huge mismatching parameters. For example, about -0.3 normalized waist position difference (left yellow patch) means that the waist of the beam is ~43cm upstream of the OMC waist. Likewise, about +0.3 normalized waist radius difference means that the beam waist radius is 690um when it should be 490um.
We cannot tell (yet) which patch is closer to reality, but in general we can say that:
- The beam is too big (Normalized waist radius difference is positive) when the OM2 is cold.
- If the reality is more like the patches on the left half of the plot, making ROC even smaller will give us a better matching.
- If on the right half of the plot, changing ROC won't do much, we need to change the distance between OM2 and OMC.
There are many caveats. The first one is important. Others will have limited impact on the analysis.
- We don't know yet if this "MM loss" measurement is really a fair representation of mode decomposition of the beam hitting the OMC. If for example there's a position-dependent loss (e.g. dust particulates on the OMC mirrors close to the center of the beam spot, it doesn't have to be on HR, it could be on AR of input or output coupler) the analysis will be totally off. Separate evaluation needs to be made to make sure that this isn't (or is) the case.
- I assumed that the distance between OM2 and OMC waist is as designed (~37cm). This sounds like a fair assessment as the error of a few cm hardly matters (1.4cm error corresponds to the normalized mismatch parameter of 0.01).
- I assumed that the measured MM loss could have +-10% fractional error, i.e. loss=(1+-0.1)*lossMeasured.
- I assumed that the ROC is 2m cold and 1.75m hot, but I haven't checked the thermistor, so these numbers could be off, which could have a minor impact.
- I assumed that the beam is round w/o astigmatism.
Moving forward:
- It would be difficult to down-select one of the two pairs of patches by going to the middle heating setting. It might be possible to use ITM central heating or maybe PR3. I'll look at the Gouy phase of these relative to OM2.
- Even if we can down-select, that won't give us any REAL guidance as to what we should do. We WILL see what to do to make the single bounce matching better, but doing so w/o understanding why is a risky thing. Besides, doing so might make our jitter coupling in full lock worse.
- Aforementioned characterization of the schmutz. For that matter, I suddenly remembered that Daniel wanted to see the QPD/OMCREFL ratio when I was calibrating the OMCREFL. That might help or not but I'll pull the data.
- We can do a similar analysis for full locked IFO beam.
Here's a brief explanation of what was done.
Top left panel of the 1st attachment is the mode matching loss contour plot. loss=0 when [posDiffNormalized, sizeDiffNormalized]=[0.0]. Contours are not circular because the loss is calculated analitically, not by quadratic approximation.
Top right panel of the 1st attachment only shows the region close to the measured losses. Yelllow ring is when OM2 is cold, blue is when hot. Each and every point on these rings represent a unique waist size and waist position combination (relative to the OMC waist).
Since we are supposed to know the OMC-OM2 distance and ROC of the cold and hot OM2, you can choose any point on the yellow (cold) ring, back-propagate the beam to the upstream of OM2 (assuming the cold ROC), "heat" the OM2 by changing the ROC to the hot number, propagate it again to the OMC waist position, and see where the beam lands on the plot. If it's on the blue ring, it's consistent with the measured hot loss. If not, it's inconsistent.
Just for plotting, I chose 9 such points on the cold ring and connected them with their hot landing points on the top right panel. If you for example look at the point at ~[0, 0.4] on the plot ("beam too big but position is perfect when cold"), after heating OM2 the beam becomes smaller but the beam position doesn't change meaningfully, therefore the matching becomes better. In this case the improvement is much better than the measured (i.e the landing point is inside the blue ring), so we can conclude that this ~[0, 0.4] for cold is inconsistent with the measured hot loss.
By doing this for each and every point on the yellow ring we end up with a patch or two that are consistent with reality.
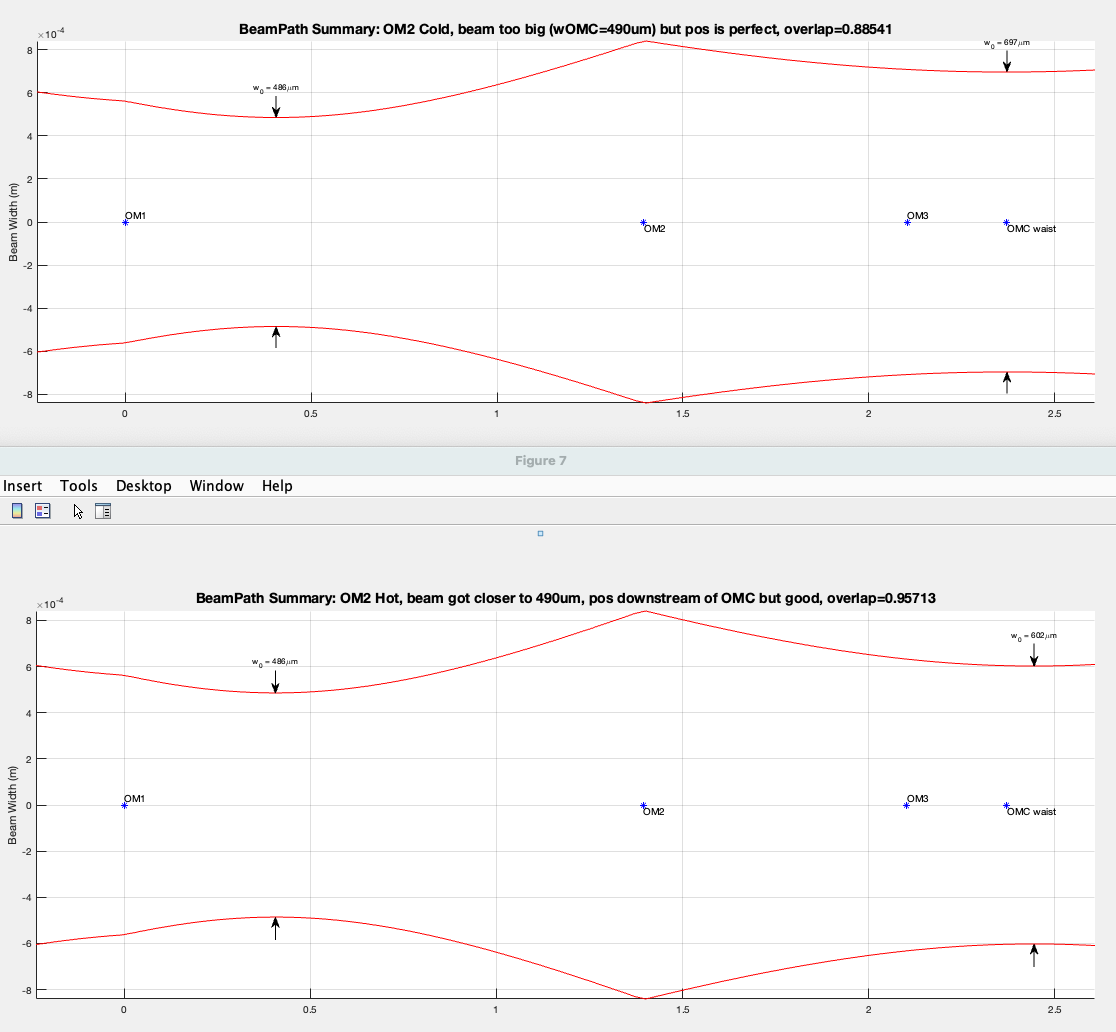
If you cannot visualize what's going on, see the 2nd attachment. Here I'm ploting the beam propagation of "beam too big but position is perfect when cold" case in the top panel. The beam between the OM2 and OMC is directly defined by the initial (cold) parameters. The beam upstream of the OM2 is back-propagation of that beam. On the bottom panel is the propagation diagram of when OM2 becomes hot. The beam upstream of OM2 is the same as the cold case. You propagate that beam to the OMC position using hot ROC. In this case the loss, which was ~12% when cold, was improved to 4.3%, that's inconsistent with the measured hot loss of (1+-0.1)*6.2%.
Further summary:
We can probably down-select the patch by 30uD single-path thermal lensing in ITM comp plate relative to the thermal lensing we had in previous scans (alogs 70502 and 71100). Start by a hot OM2. If we see a significant reduction in MM loss after ITM TCS, the actual beam parameters are on the patches in the left half plane.
Details 1:
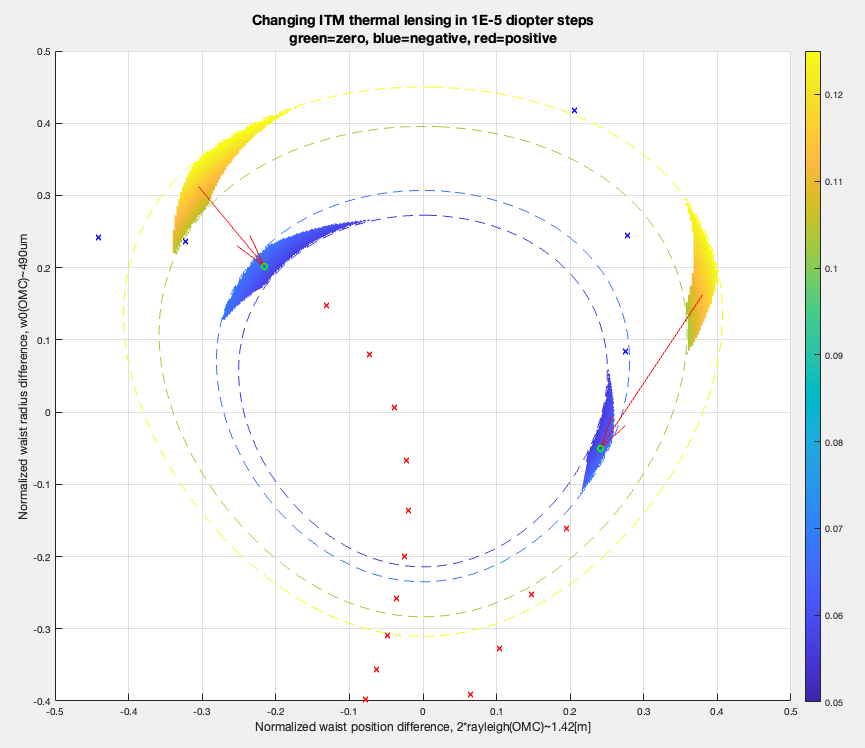
In the 1st attachment, I took two representative points on the hot patches indicated by little green circles, which define the beam shape at the OMC waist position. I then back propagated the beam to the upstream of ITM (i.e., in this model, optics are correctly placed with correct ROC and things, but the input beam is bad). ITM is at the average ITM position. The only lensing in the ITM is the nominal diversing lens due to ITM's curvature on the HR.
Then I added the thermal lens, once to the beam impinging the ITM HR and once to the beam reflected, and see what happens to the beam parameter at the OMC waist location. These parameters are represented by tiny crosses. Blue means negative diopters (annular heating) and red means positive (central heating). I changed the thermal lensing by 10uD steps (single-path number).
As you can see, if you start from the left half plane patch, central heating will bring you close to ~(-0.04, 0) with 30uD single-path (or 60uD double-path).
OTOH if you start from the right half plane, ITM heating only makes things worse both ways.
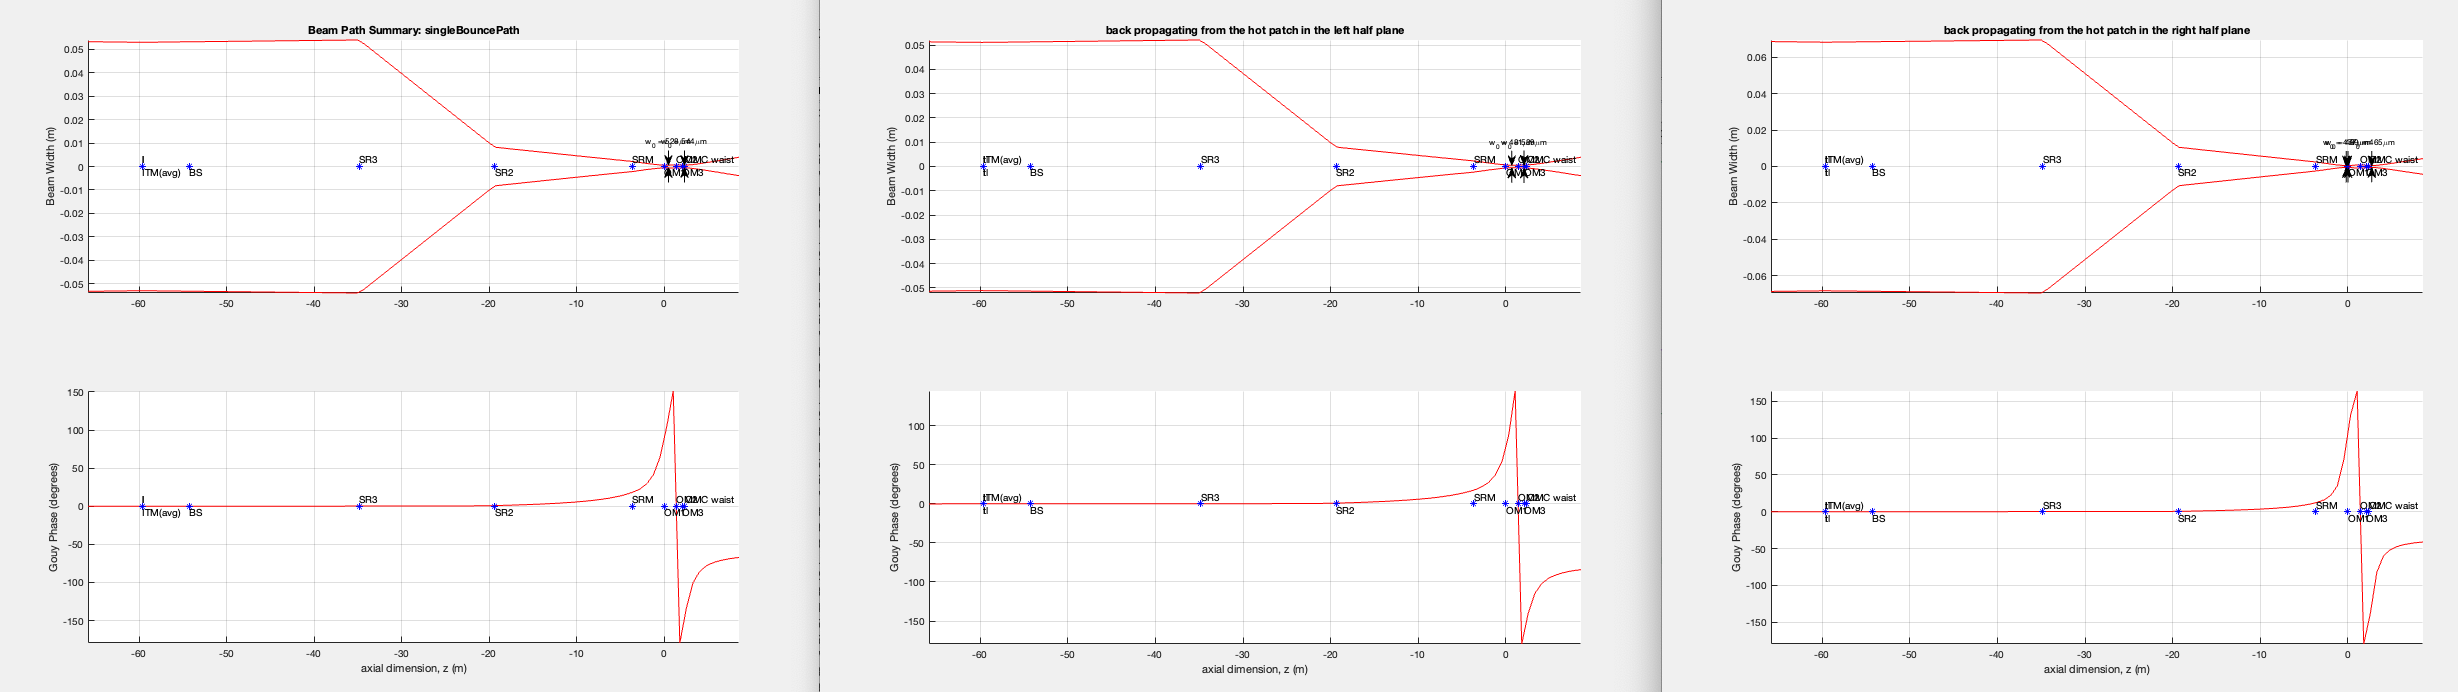
FYI, 2nd plot shows, from the left to the right, good mode matching, hot patch in the left half plane and in the right half plane. The beam size on the ITM is ~5.3cm nominally, 5.1cm if in the left half plane (sounds plausible), 6.8cm in the right (sounds implausible). From this alone, right half plane seems almost impossible, but of course the problem might not be the bad input beam.
Details 2:
Next, I start with (almost) perfectly mode-matched beam and change the optics (either change ROC/lens or move) to see what happens. We already expect from the previous plots that ITM negative thermal lensing will bring us from perfect to the hot patch in the left half plane, but what about other optics?
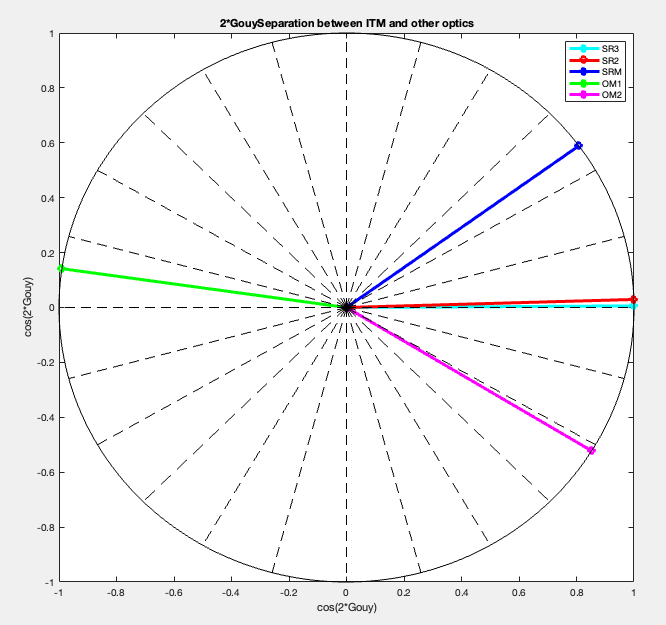
3rd attachment shows twice the Gouy phase separation between ITM and other optics. Double because we're thinking about mode matching, not misalignment. As is expected, there's really no difference between ITM, SR3 and SR2. OM1 is almost the opposite of ITM (172 deg), so this is the best optic to compensate for the ITM heating, but the sign is opposite. OM2 is about -31 deg, SRM ~36 deg. From this, you can expect that SR3 and SR2 are mostly the same as ITM as actuators.
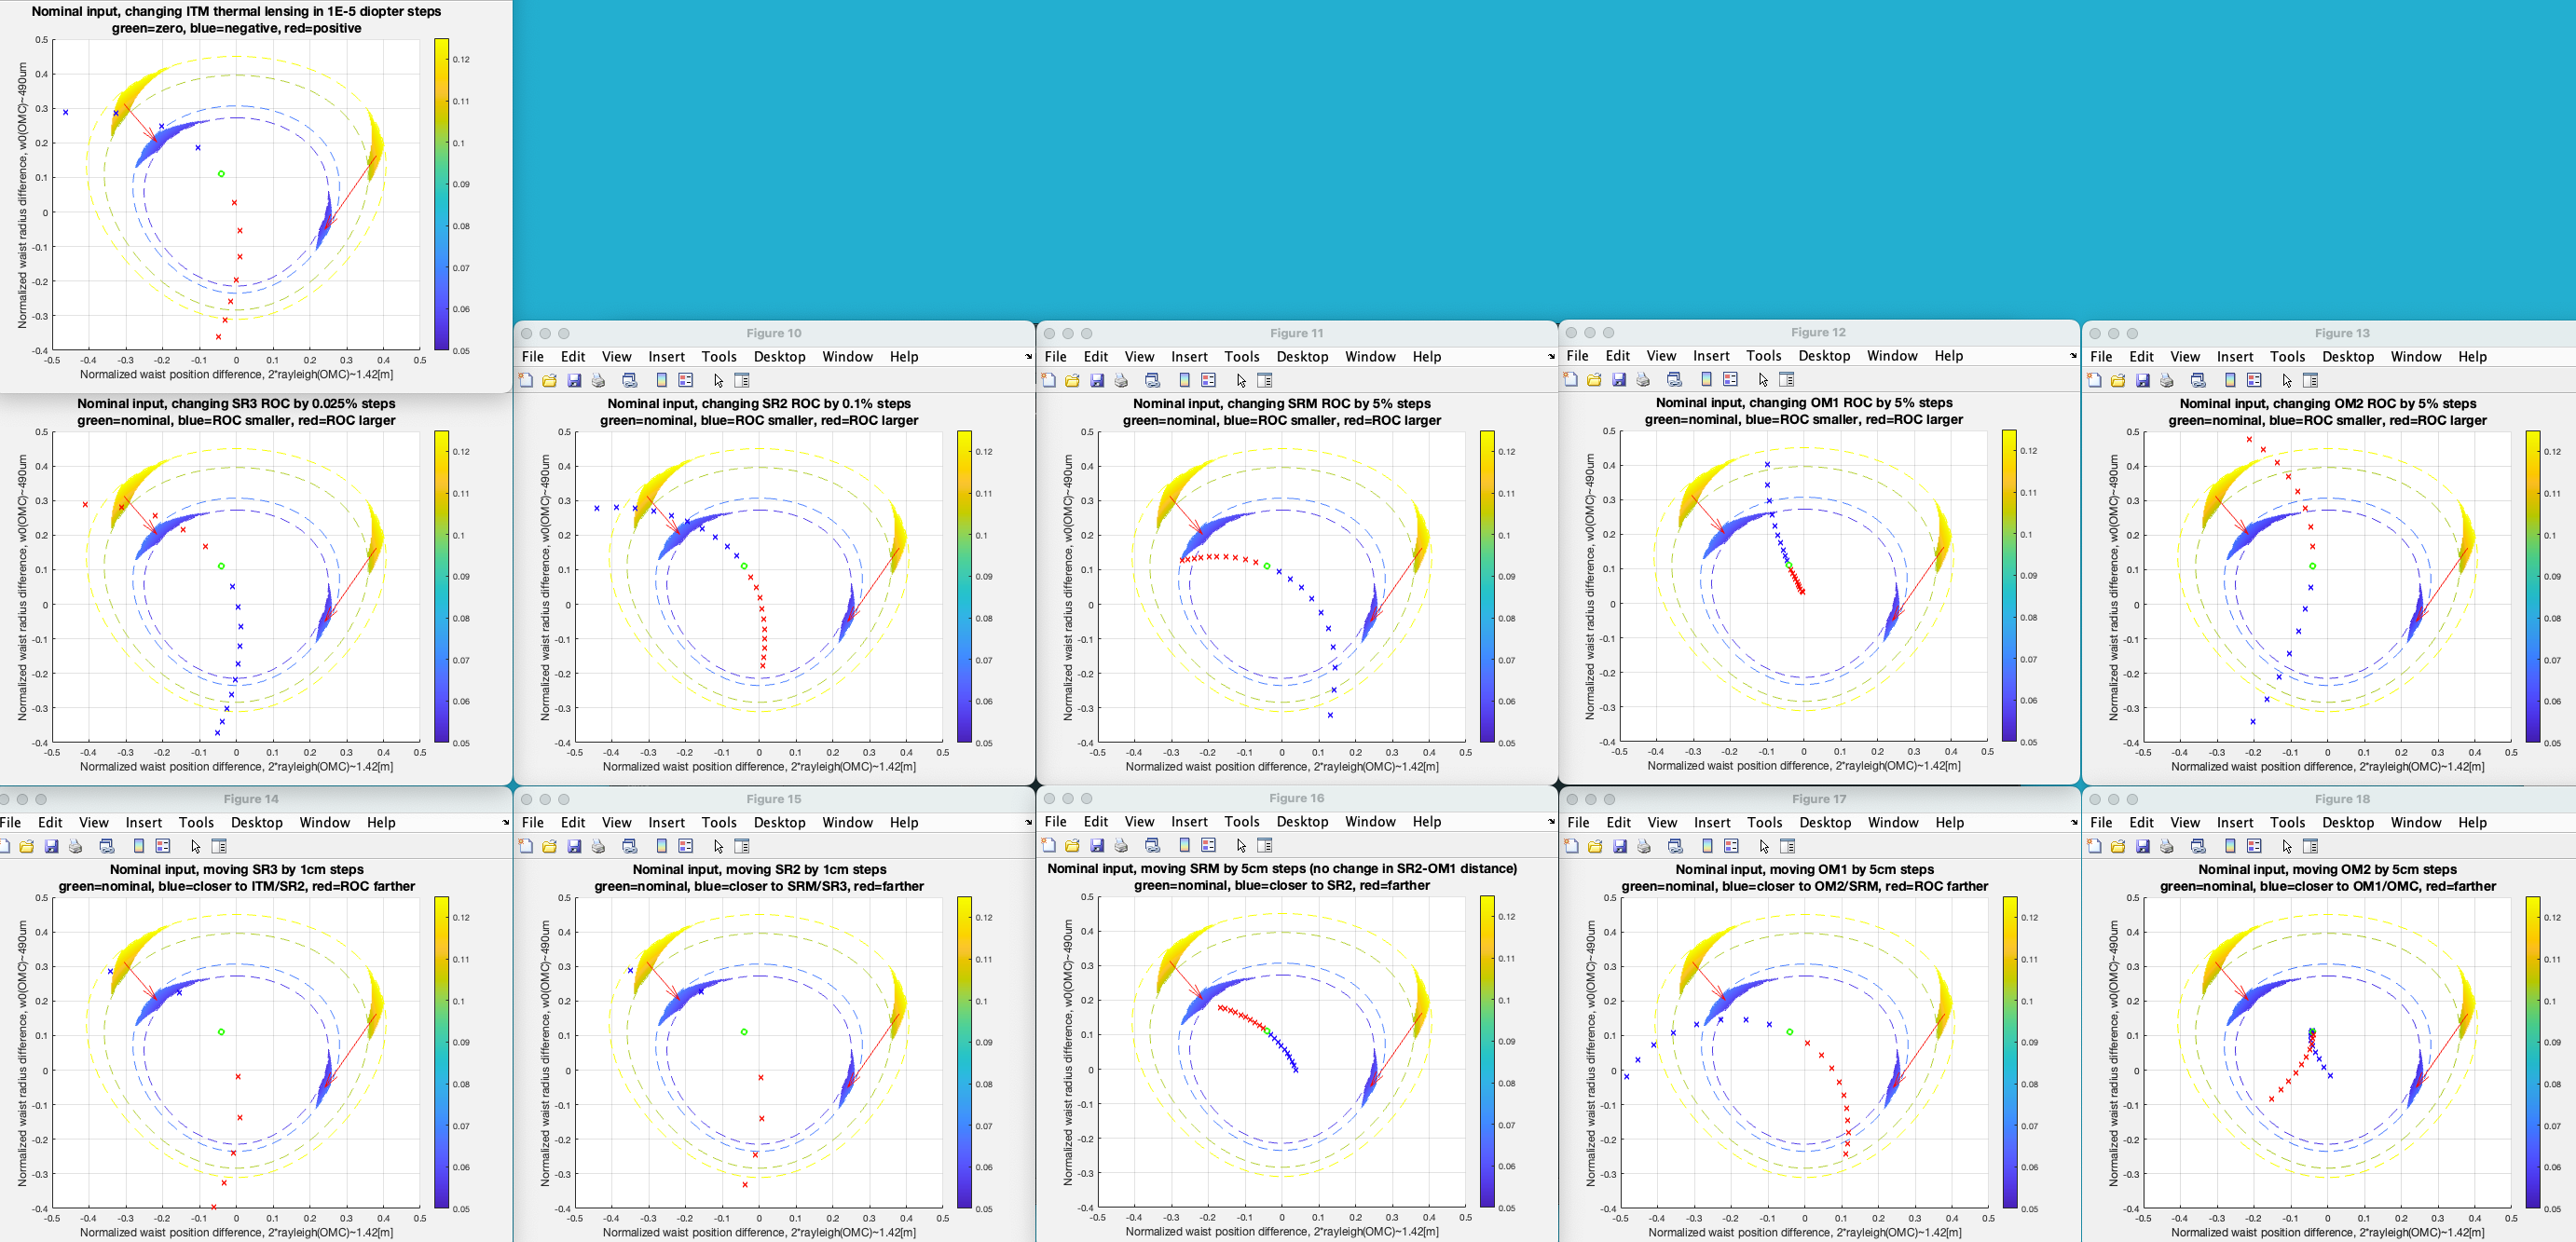
4th attachment shows a bunch of plots, each representing the change of one DOF of one optic. (One caveat is that I expected that the green circles, which repsent the beam perfectly mode matched to the arm propagated to the OMC waist position, will come very close to (0, 0) with zero MM loss, but in this model it's ~(-0.4, 0.1) with ~1.2% loss. Is this because we need a certain amount of ITM self-heating to perfectly mode match?)
Anyway, as expected, ITM, SR3, SR2 all look the same. It doesn't matter if you move the position of SR3 and SR2 or change the ROC, the trajectory of the beam parameter points on these plots are quite similar. These optics all can transform the perfectly matched system to the blue patch in the left half plane.What is kind of striking, though not surprising, is that 0.025% error in SR3 ROC seem to matter, but this also means that that particular error is easily compensated by ITM TCS.
SRM, OM1 and OM2 are different (again as expected). Somewhat interesting is that if you move OM2, the waist size only goes smaller regardless of the direction of the physical motion.
From these plot, one can conclude that if you start from perfectly matched beam, you cannot just change one optic to reach the hot patch in the right half plane. You have to make HUGE changes in multiple optics at the same time e.g. SRM ROC and ITM thermal lensing.
Both Details 1 and 2 above suggest that, regardless of what's wrong as of now (input beam or the optics ROC/position), if you apply the central heating on ITM TCS and see an improvement in the MM loss, it's more likely that the reality is more like the patches on the left, not right.
Dan pointed me to their SRC single-path Gouy phase measurement for the completely cold IFO, which was 19.5+-0.4 deg (alog 66211).
In my model, 2*Gouy(ITM-SRM single path) was ~36deg, i.e. the SRC single-path Gouy phase is about 18 degrees. Seems like they're cosistent with each other.
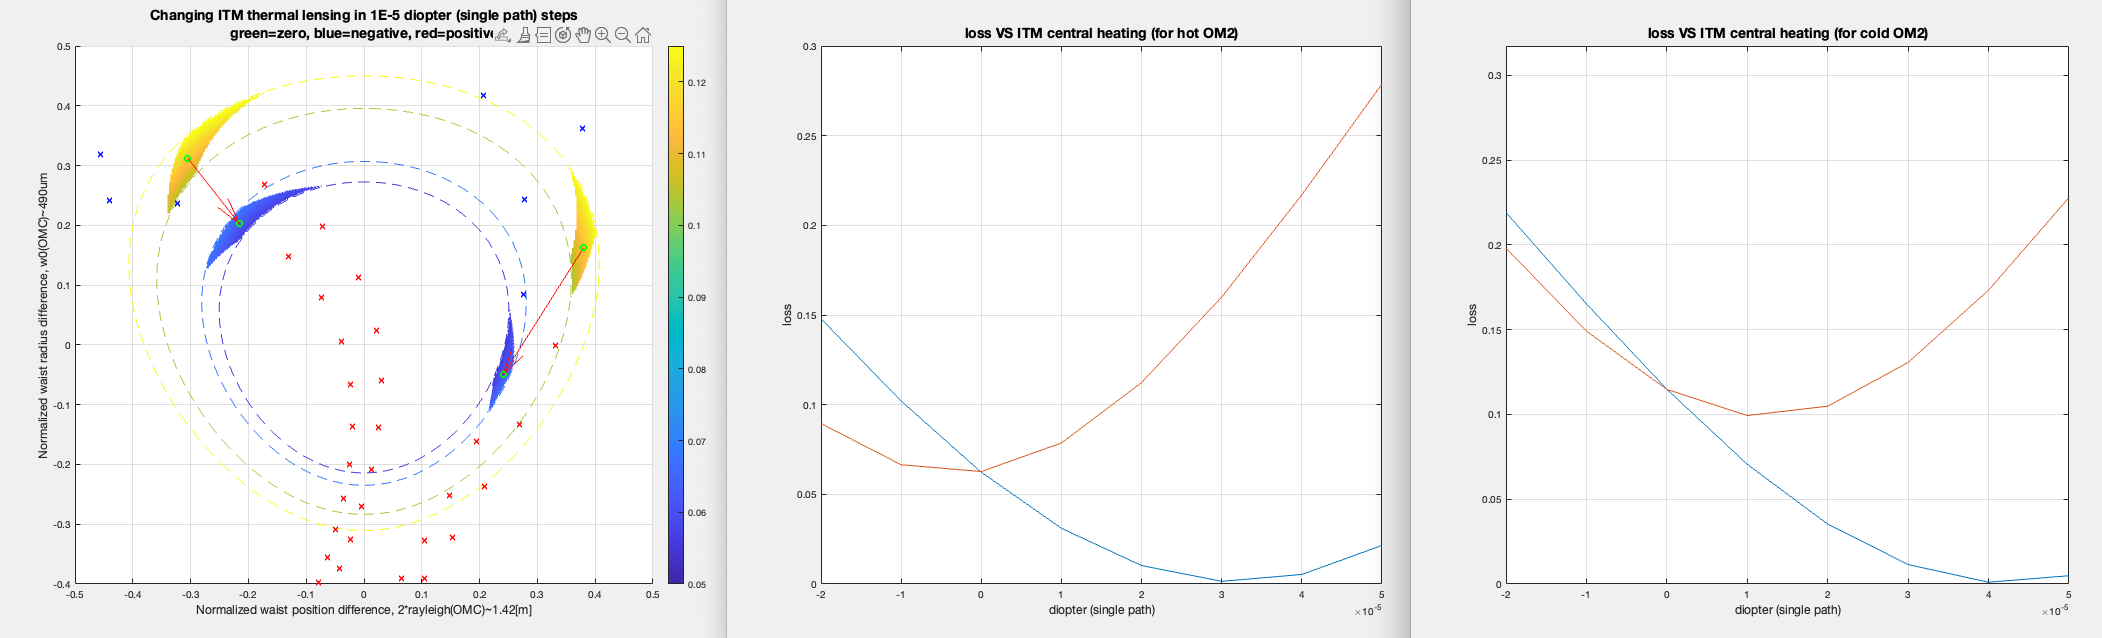
ITM central heating plot was updated. See attached left. Now there are four points as the "starting points" without any additional TCS corresponding to both hot and cold patches.
According to this, starting with cold OM2, if the heating diopter (single path) is [0, 10, 20, 30, 40]uD, the loss will be [11.5, 7.1, 3.5, 1.1, 0.1]% if the reality is in the left half plane (attached right, blue), or [11.5, 9.9, 10.5, 13.1, 17.3] % if in the right half plane (attached right, red).
Updated to add cold OM2, ITMY single bounce, central CO2 OFF/ON case in alog 71457.
Jennie Wright, Keita Kawabe, Sheila Dwyer
Above Keita says "I assumed that the distance between OM2 and OMC waist is as designed (~37cm). " 37 cm is a typo here, the code actually uses 97 cm, which is also the value listed for OMC waist to OM2 in T1200410