lanceanderson.blagg@LIGO.ORG - posted 13:13, Wednesday 12 July 2023 (71265)
Range Effects Due to OM2 Heating on 06/27/2023
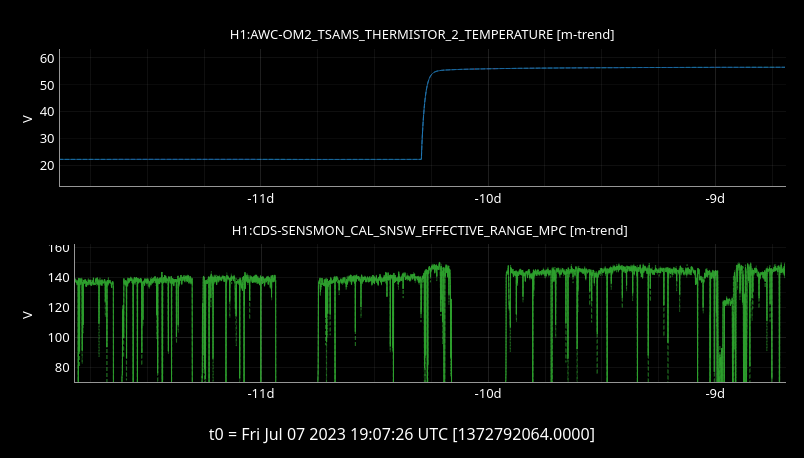
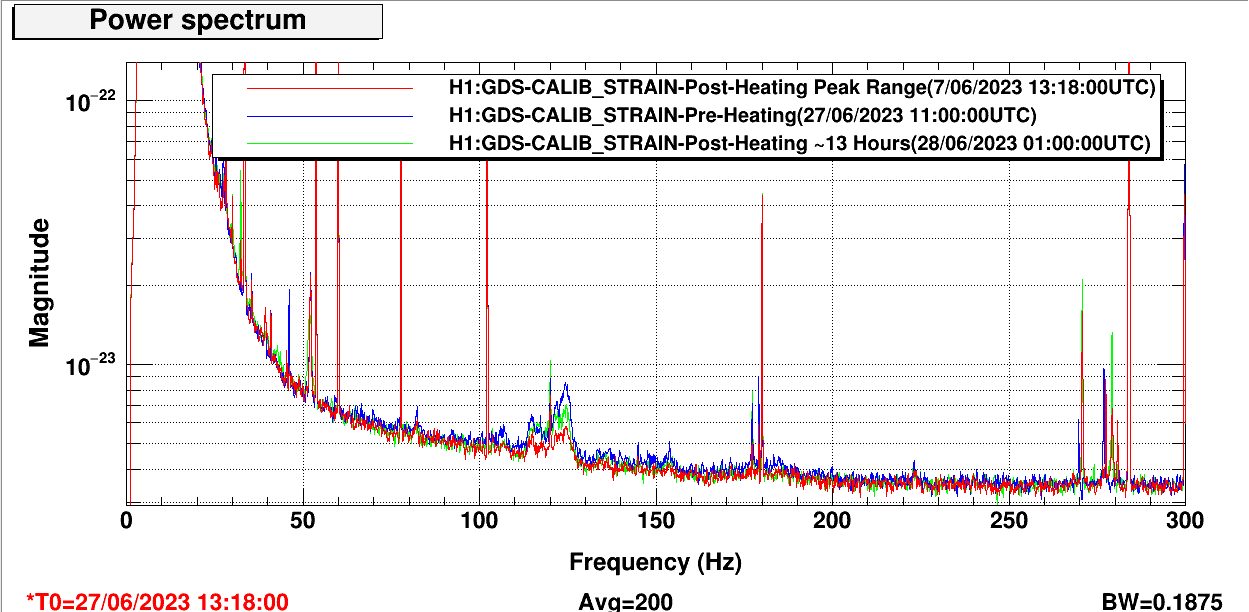
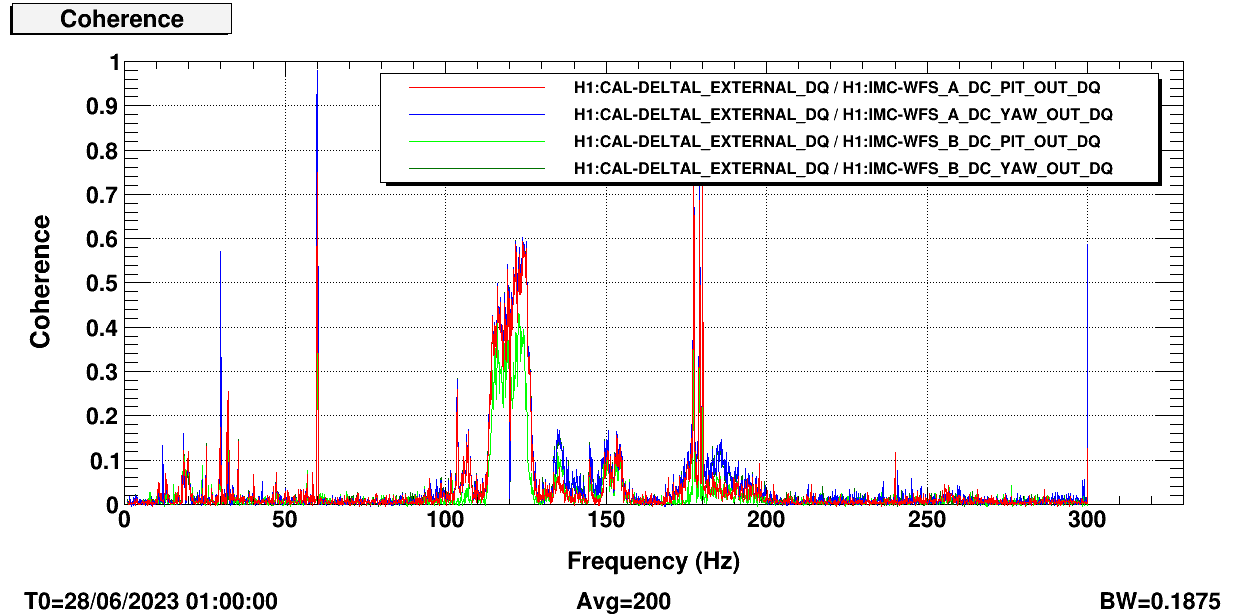
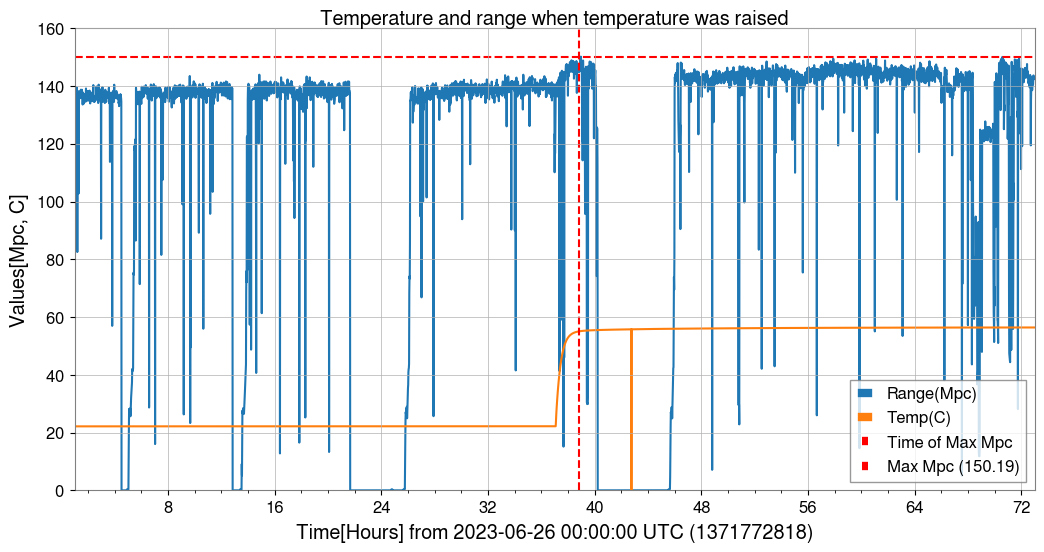
At approximately the exact moment that OM2 TSMAS temperature was raised, the H1 range jumped but then began a downward trend and did not sustain this range in the subsequent days. (The actual max range during this period seemed to spike during the downward trend).

The following are plots are of two ndscope channels during a 72 hour period around this temp raising, the DARM power spectrum and transfer functions (magnitude and phase) at 3 different times during this period(before heating, near the peak range prior to the downward trend, and around 13 hours after the peak range). We have a coherence from from 4 IMC channels but we used this to choose the WFS_A_DC_PIT channel vs the CAL_DELTAL for the transfer function plots.

Perhaps less importantly, I also attached a gwpy plot from the ndscope data that overlays the range changes with the temperature changes, pinpointing the moment of max range of 150.19, which was at 2023-06-27 13:57:42 UTC, but again this was a quick spike during the downward trend.
Images attached to this report