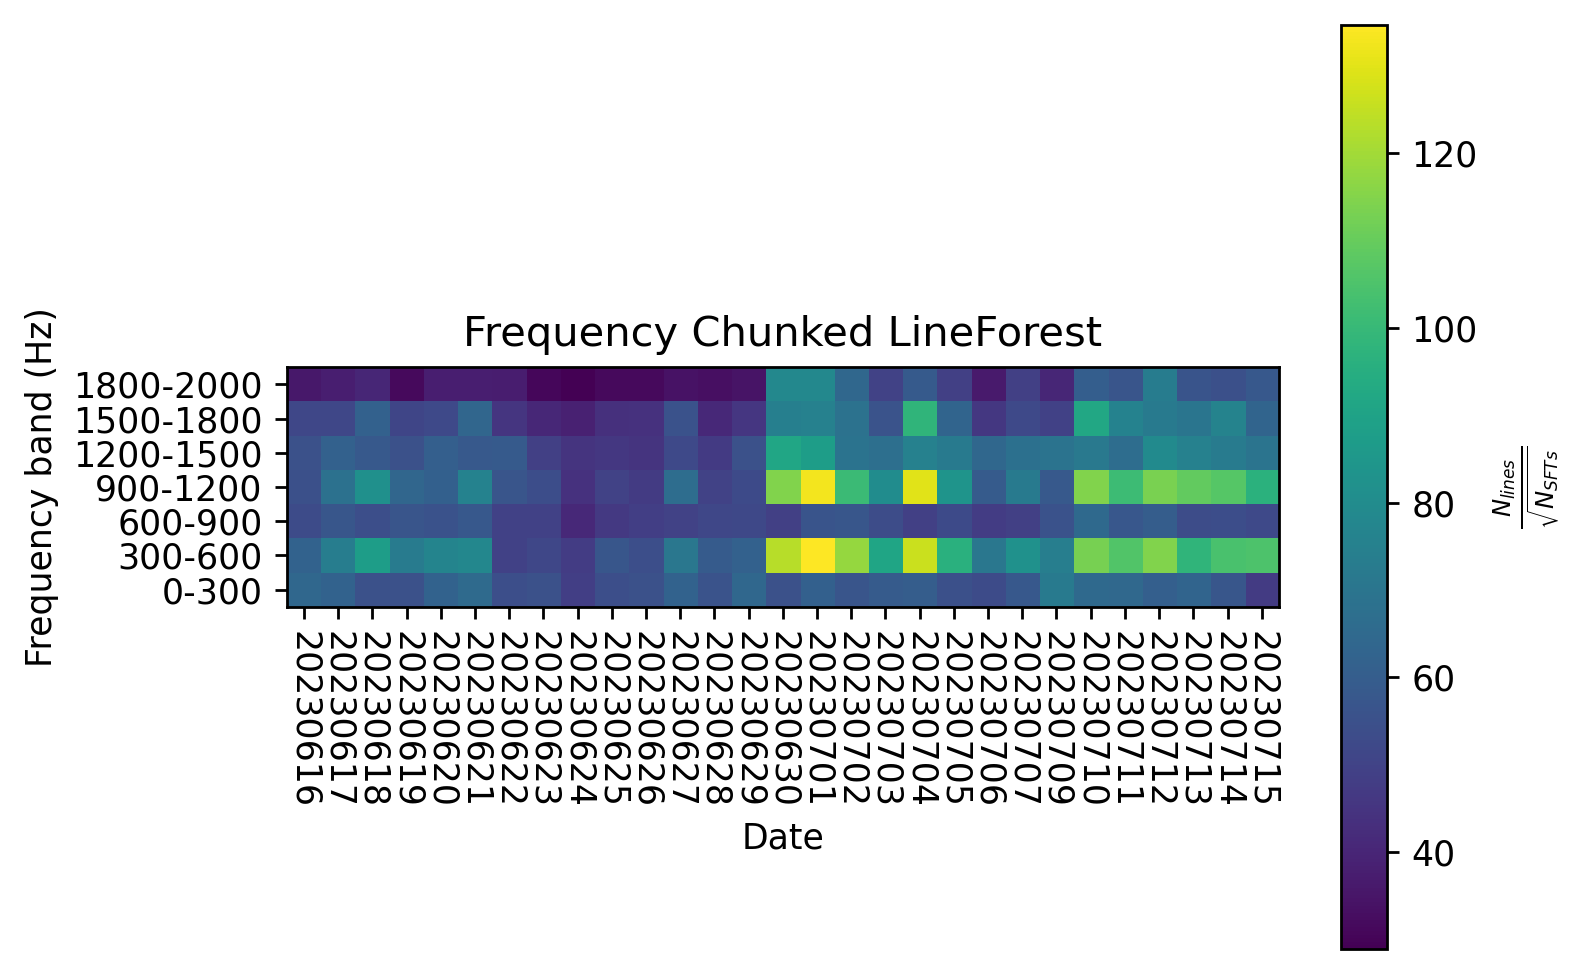
We conducted a study using data from the Fscan pipeline that shows when the violin modes are rung up, there is a dramatic increase in the number of narrow lines (of the type problematic for CW searches) in the regions around the violin modes and harmonics. This increase in the number of narrow lines is visible both in daily and weekly plots since June 29th when the violin modes and its harmonics are known to have rung up.
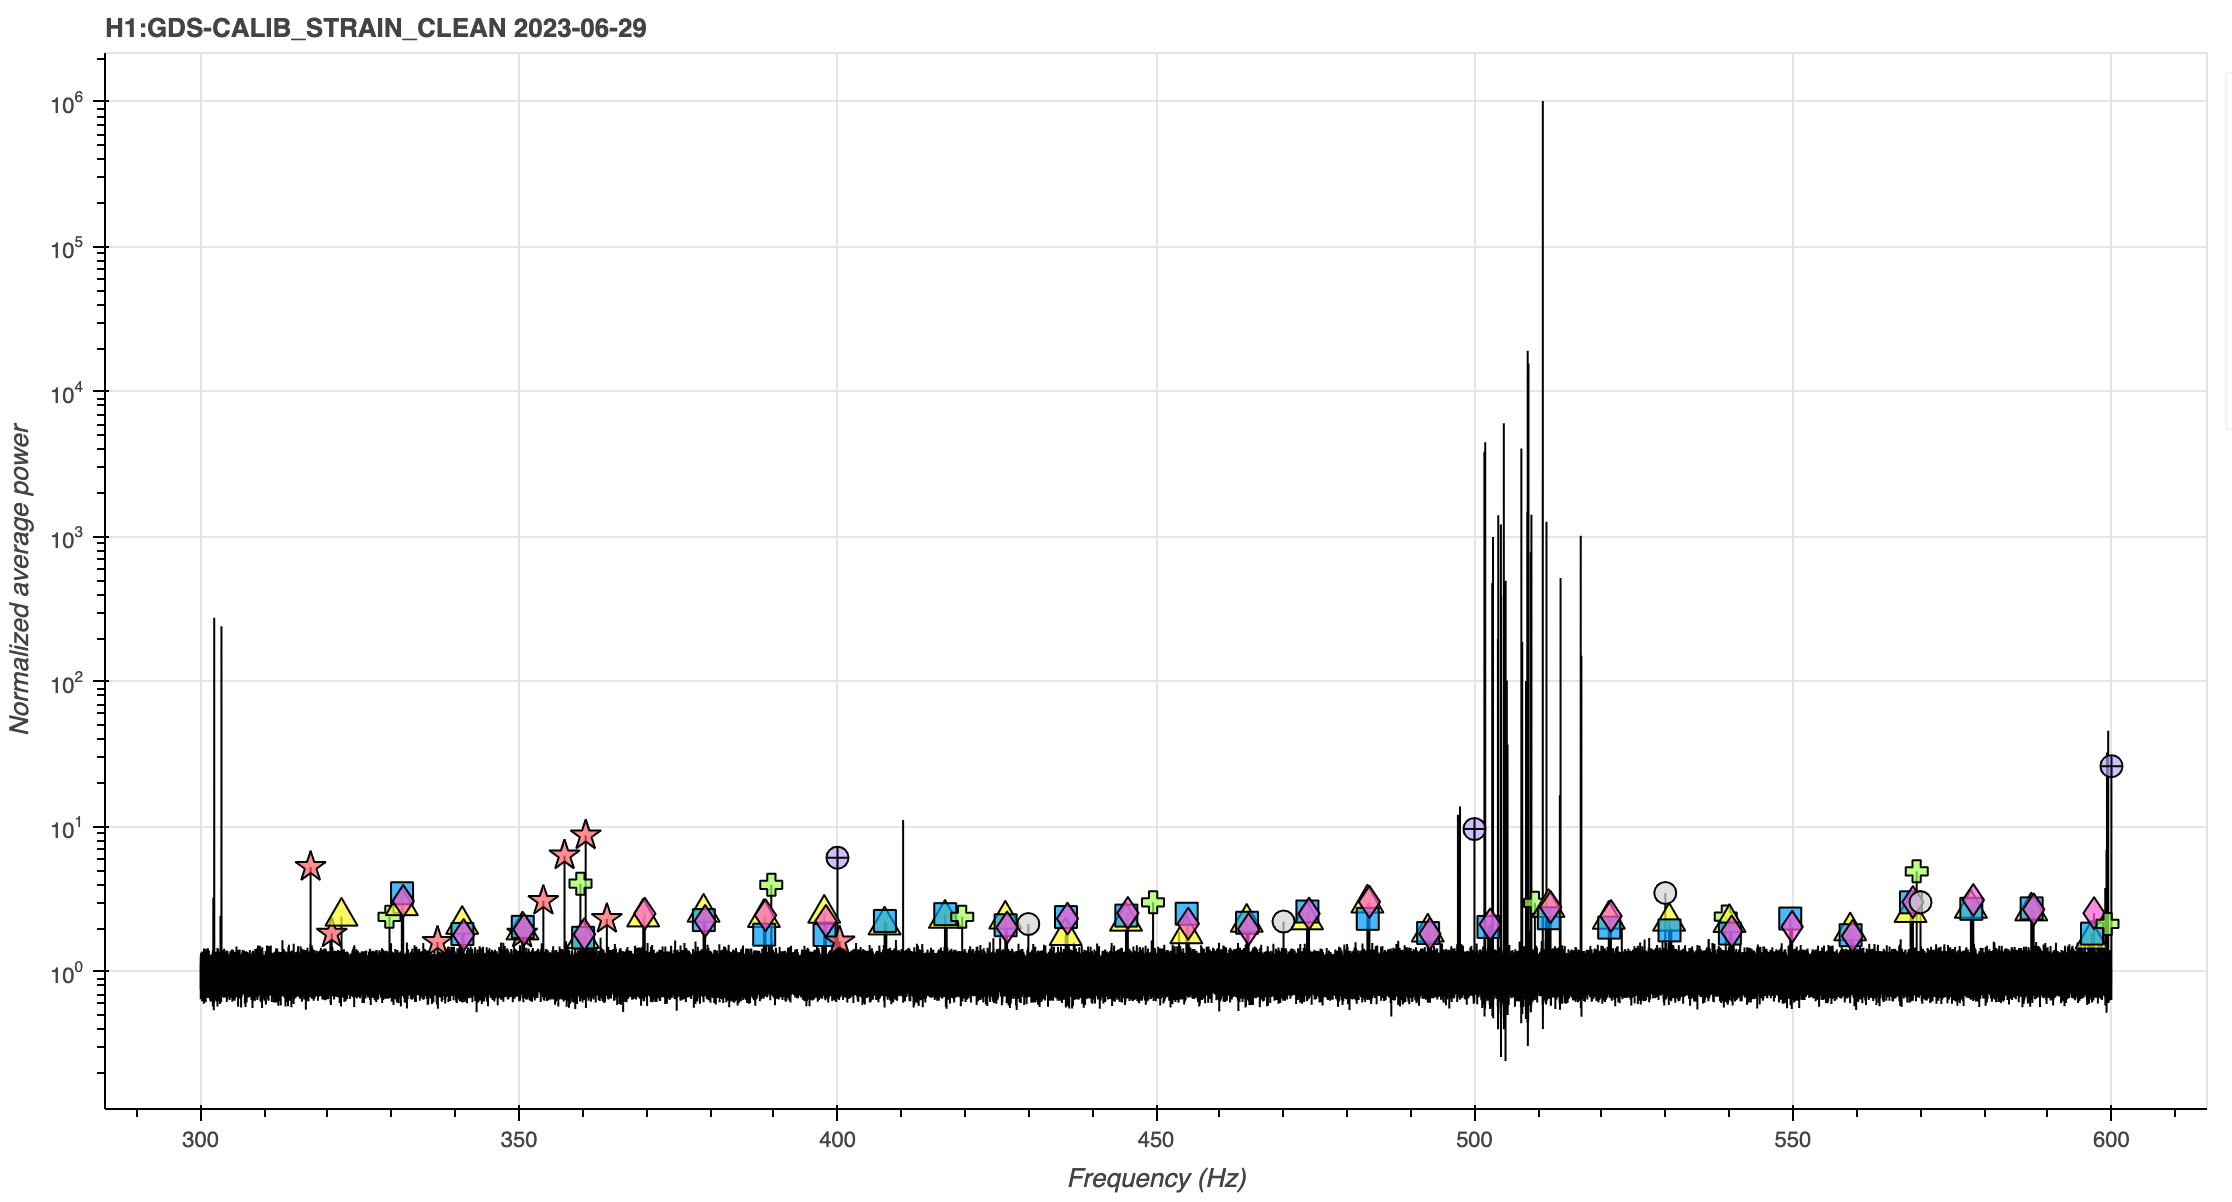
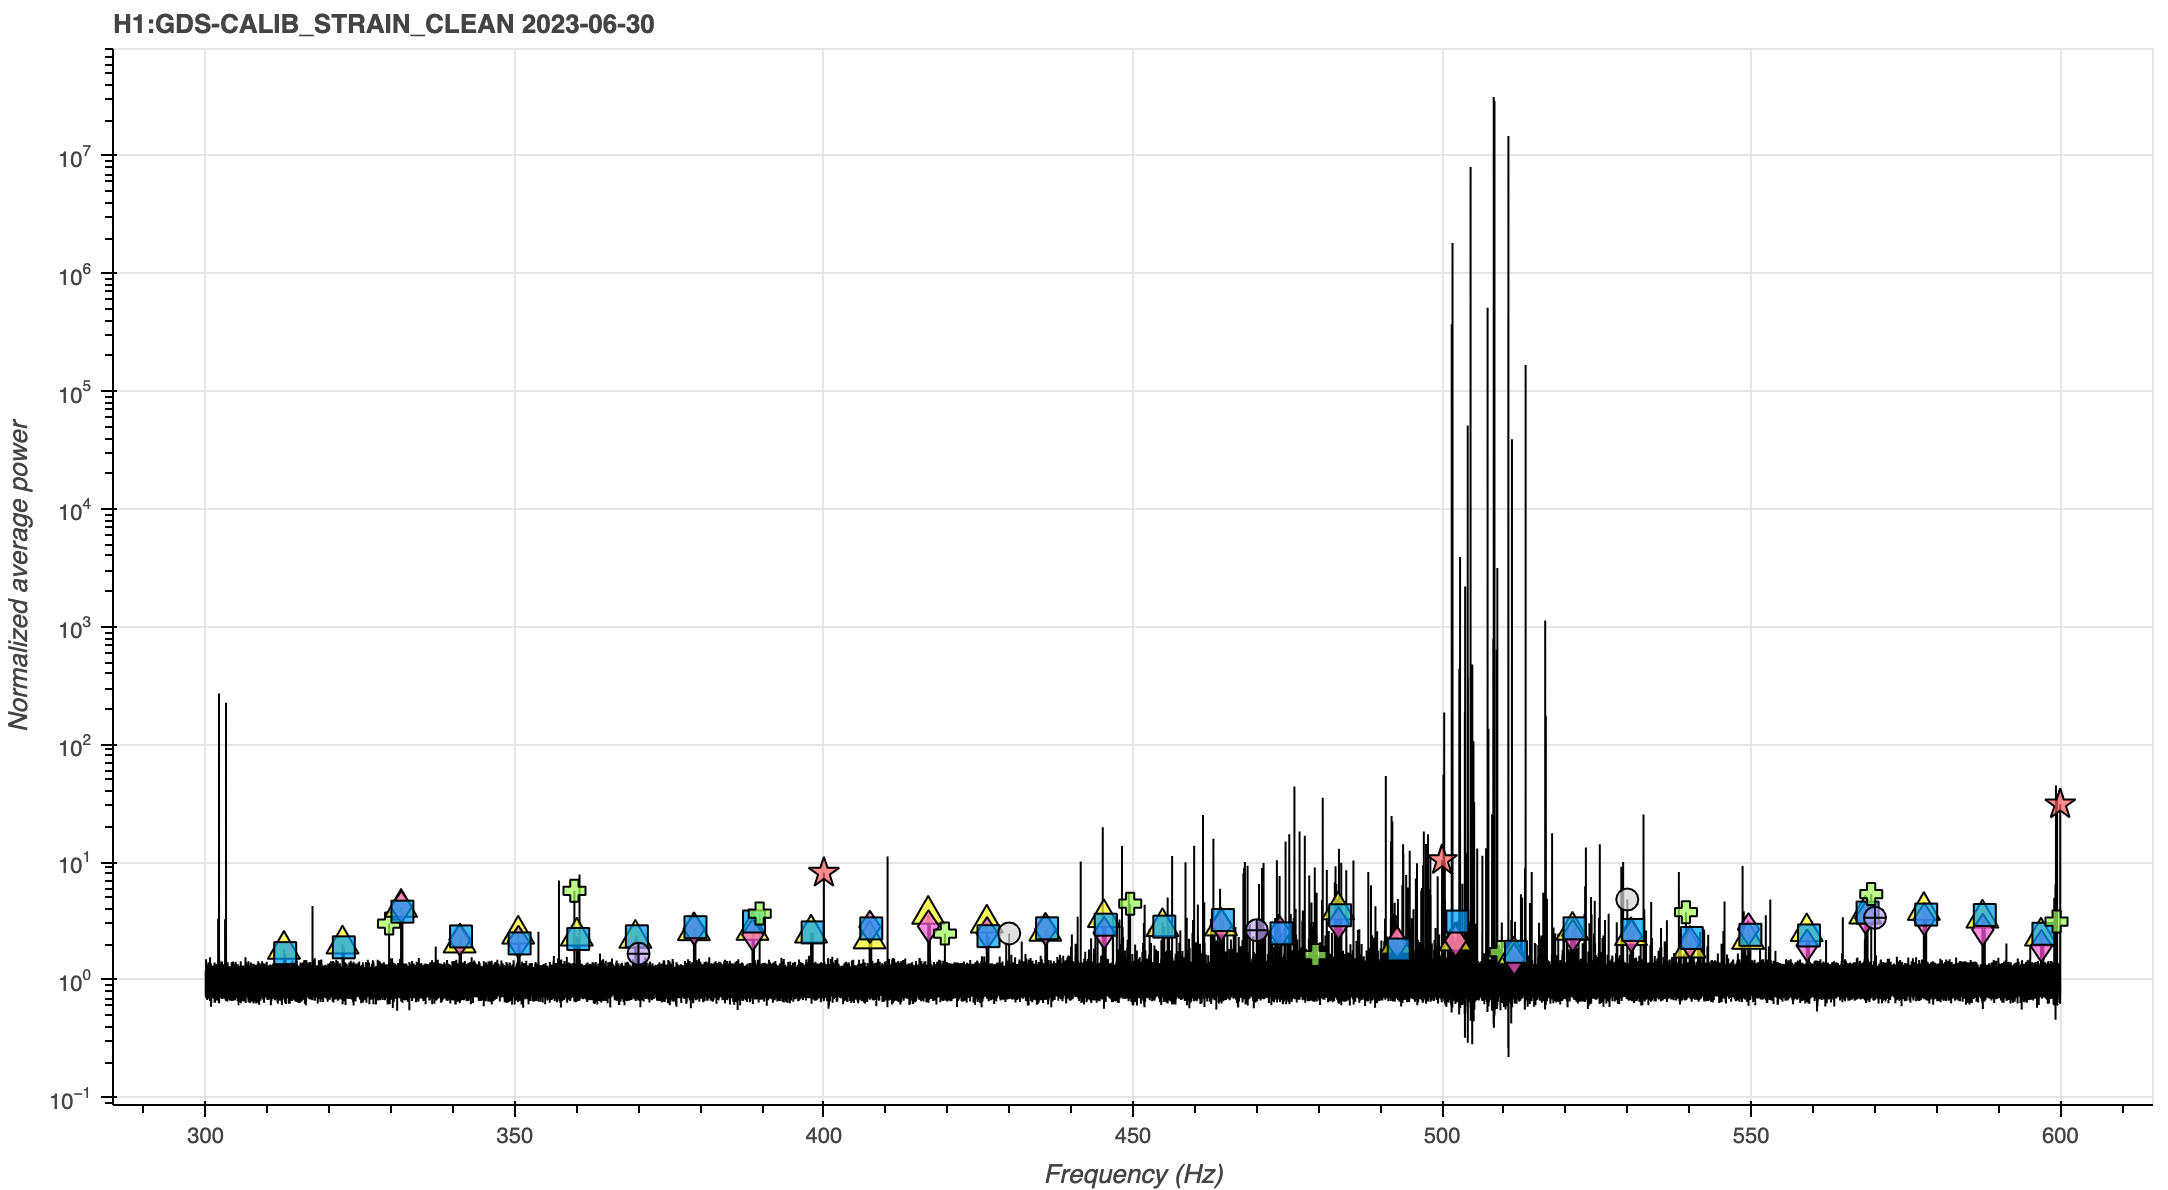
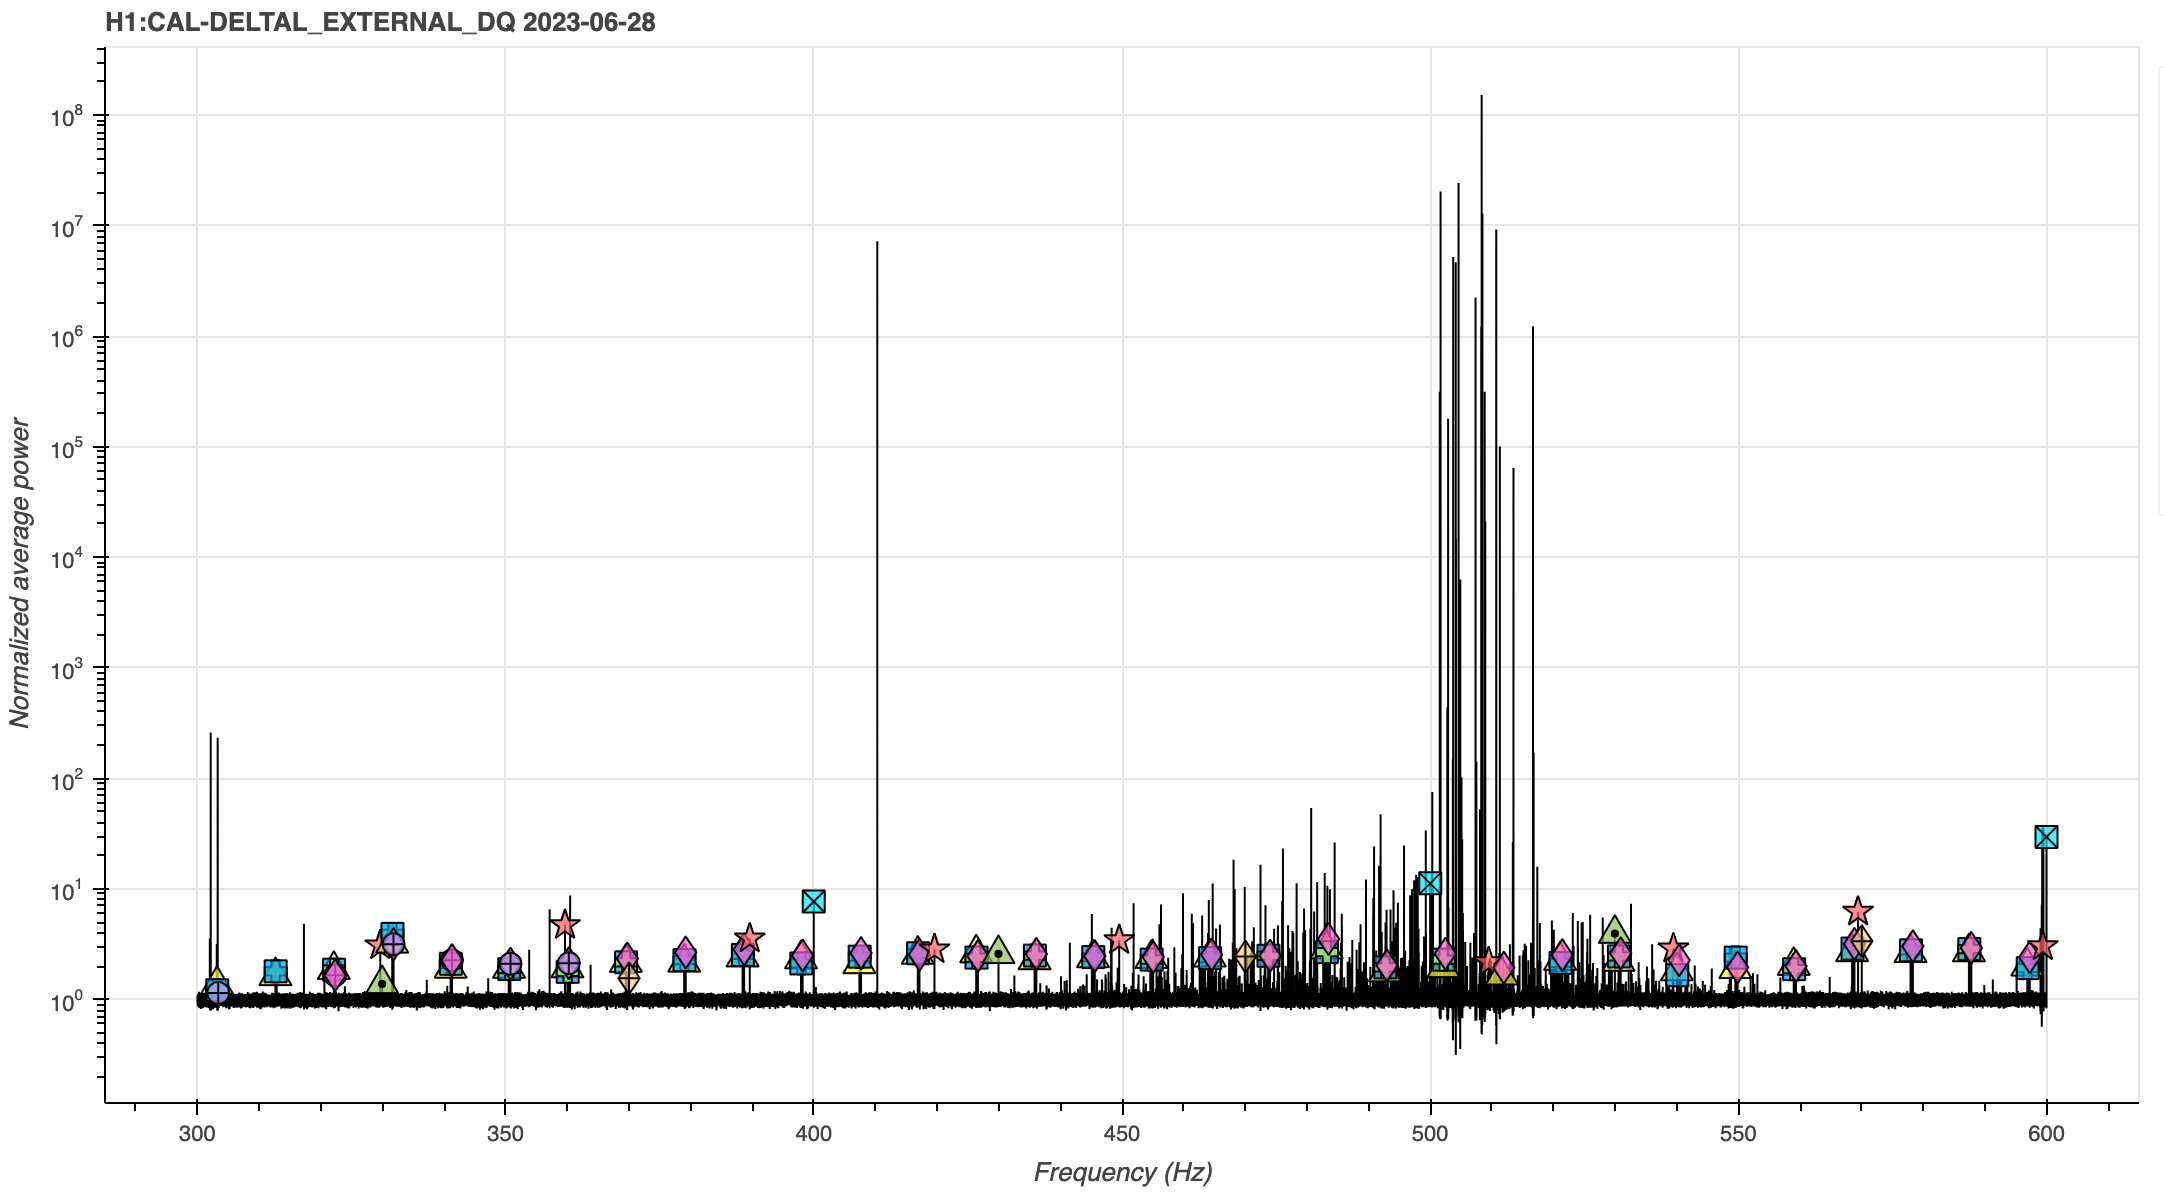
Figure 1 shows how the number of lines jumped significantly in the 300-600Hz and 900-1200Hz bands from June 29th to June 30th, and again from July 9th to July 10th without much change in the other frequency bands. Figures 2 and 3 show the averaged spectrum for the 29th and 30th respectively, demonstrating just how dramatic the increase in the number of lines is. Figure 4 shows how visible and persistent the lines are in the weekly data.
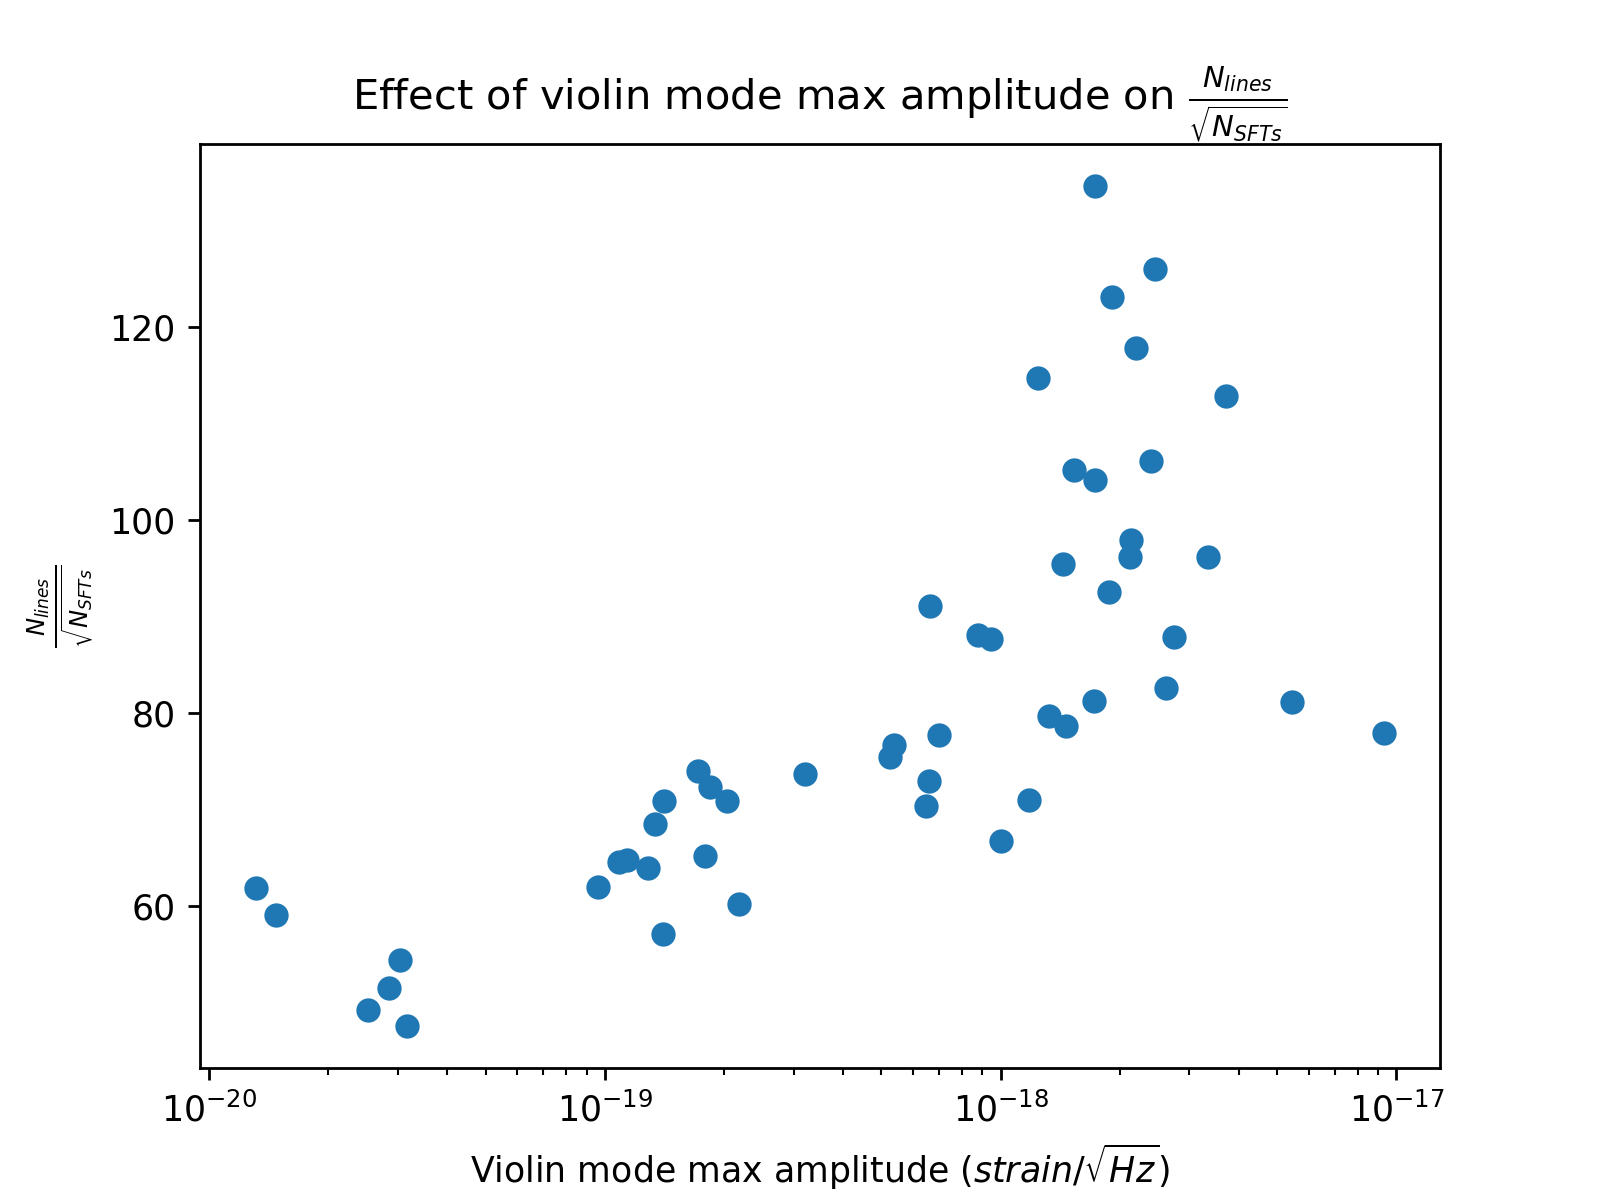
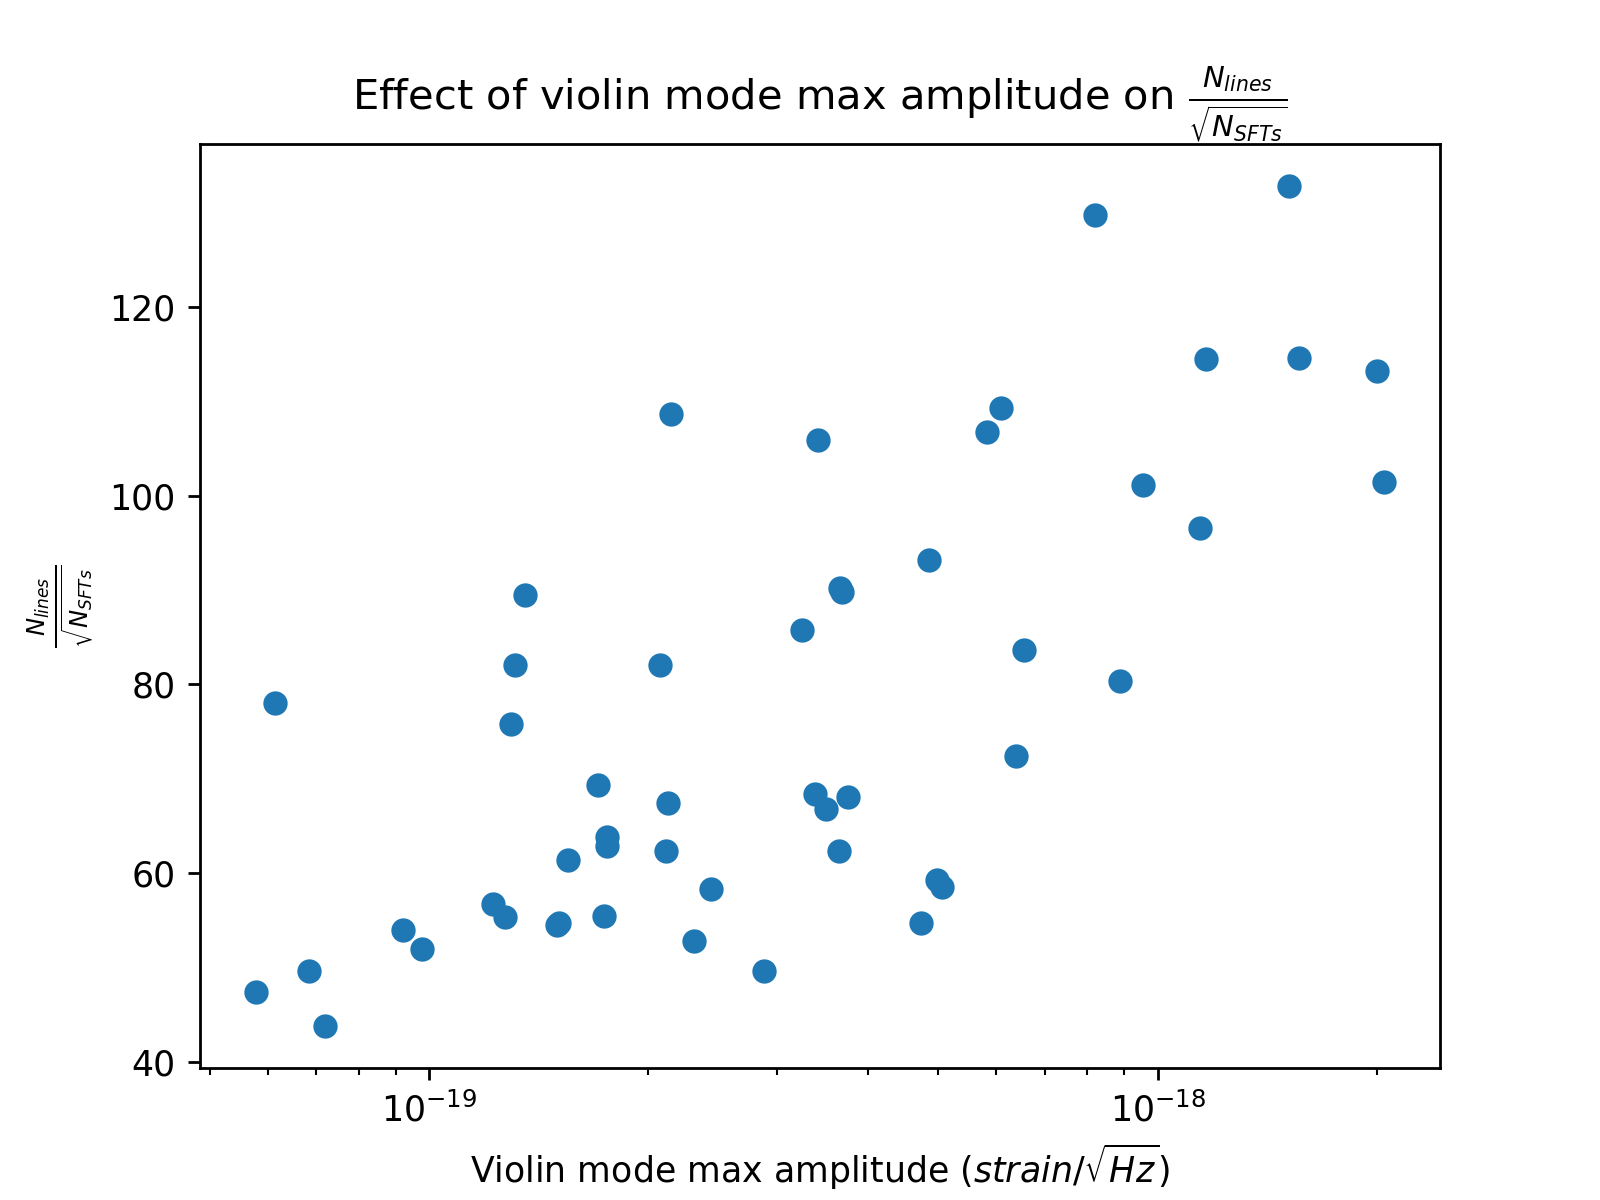
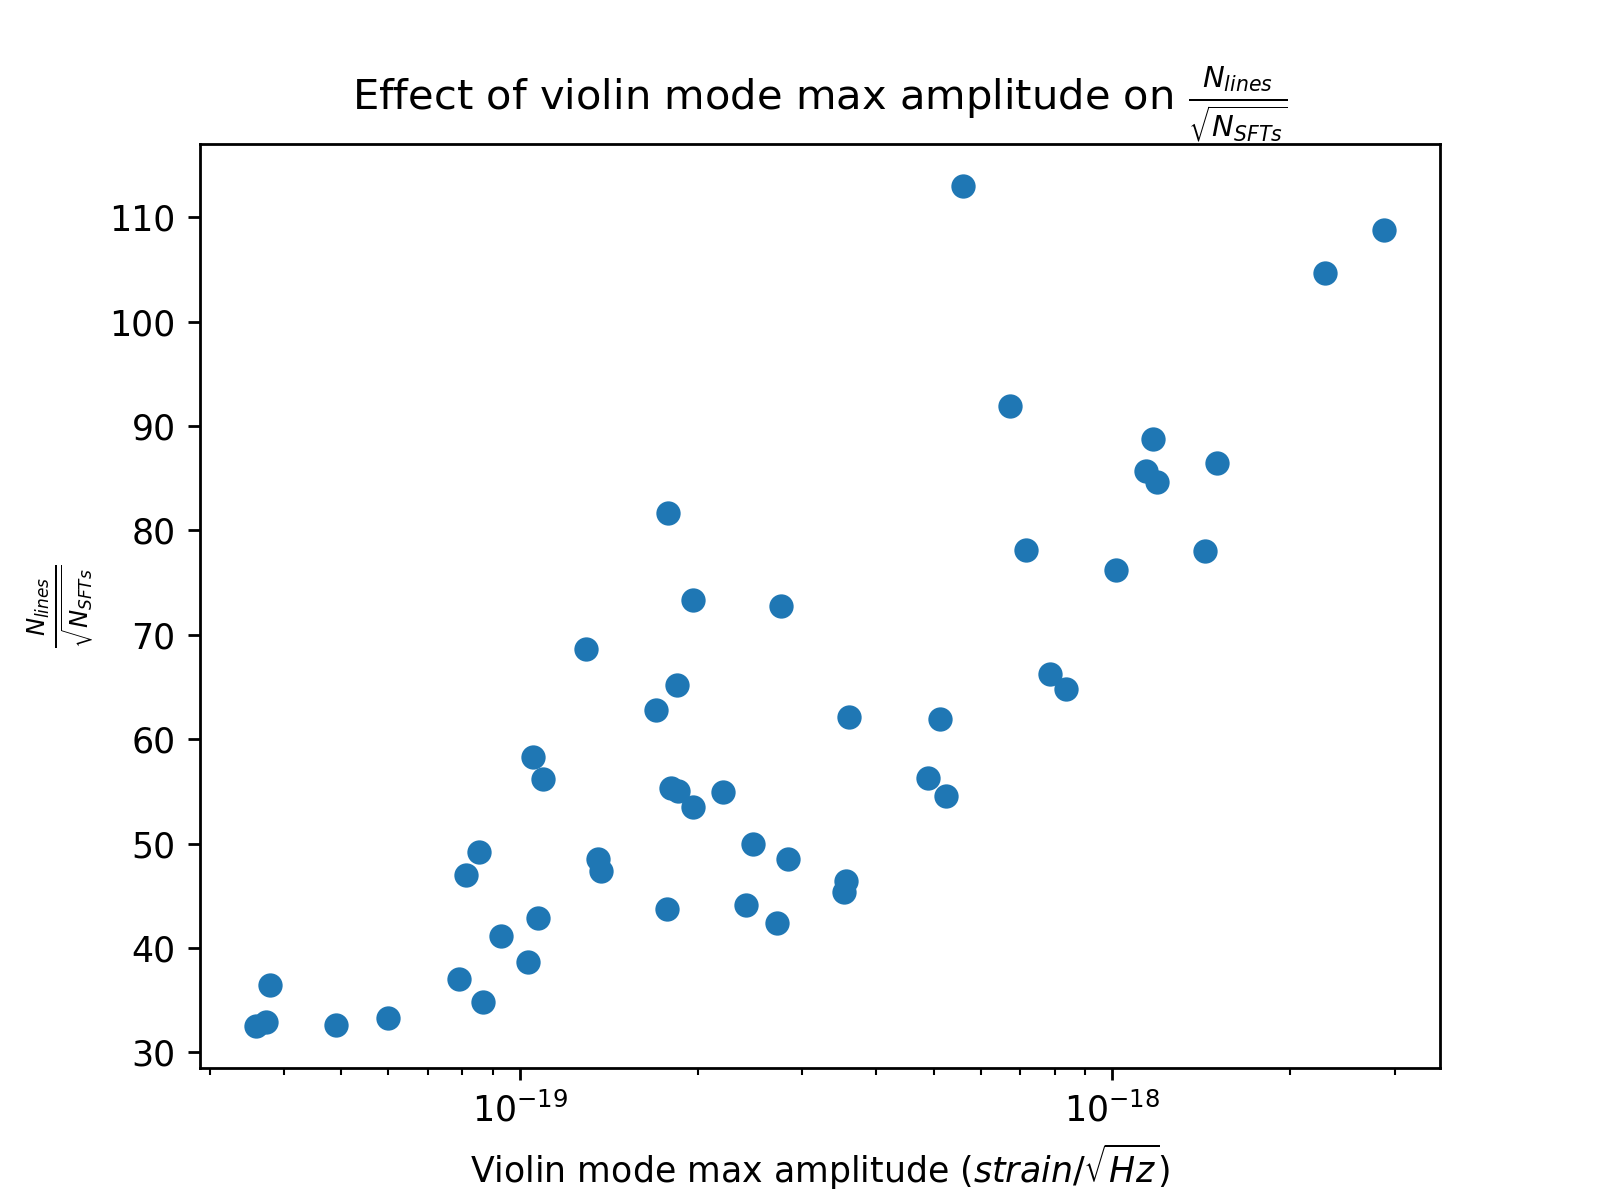
Figures 5, 6, and 7 show the max amplitude of the violin modes vs number of lines per the square root number of SFTs in three different frequency bands surrounding the violin modes and its harmonics. To remove the effect of the duty cycle on the number of lines counted, the total number of lines counted is divided by the square root of the number of SFTs produced in a day because the number of SFTs produced in a day is directly proportional to the amount of time spent observing on that particular day. From here on out, I will refer to the number of lines per square root of the number of SFTs as the number of lines.
Looking at all the O4 data so far, it is obvious that the number of lines increases with the max amplitude violin modes in the bands surrounding the violin modes and its harmonics. The most dramatic effect is visible in the 300-600Hz band (Figure 5) where the number of lines seems to increase approximately linearly with the max amplitude of the violin modes between amplitudes of 10-20-10-18 strain/√Hz. Between 10-18-10-17 strain/√Hz, the number of lines increases significantly with no clear pattern. Multiple days after the June 29th ring up appear in this region, showing that these long ring ups can greatly increase the number of lines and decrease CW data quality for a significant period of time. Around the 1000Hz (Figure 6) and 1500Hz (Figure 7) harmonics, the number of lines increases approximately linearly with the max amplitude of the violin modes without displaying the jump present in the 300-600Hz band. This might be because the amplitude of the violin modes has a much smaller range of 10-19-10-18 strain/√Hz during the ring up.
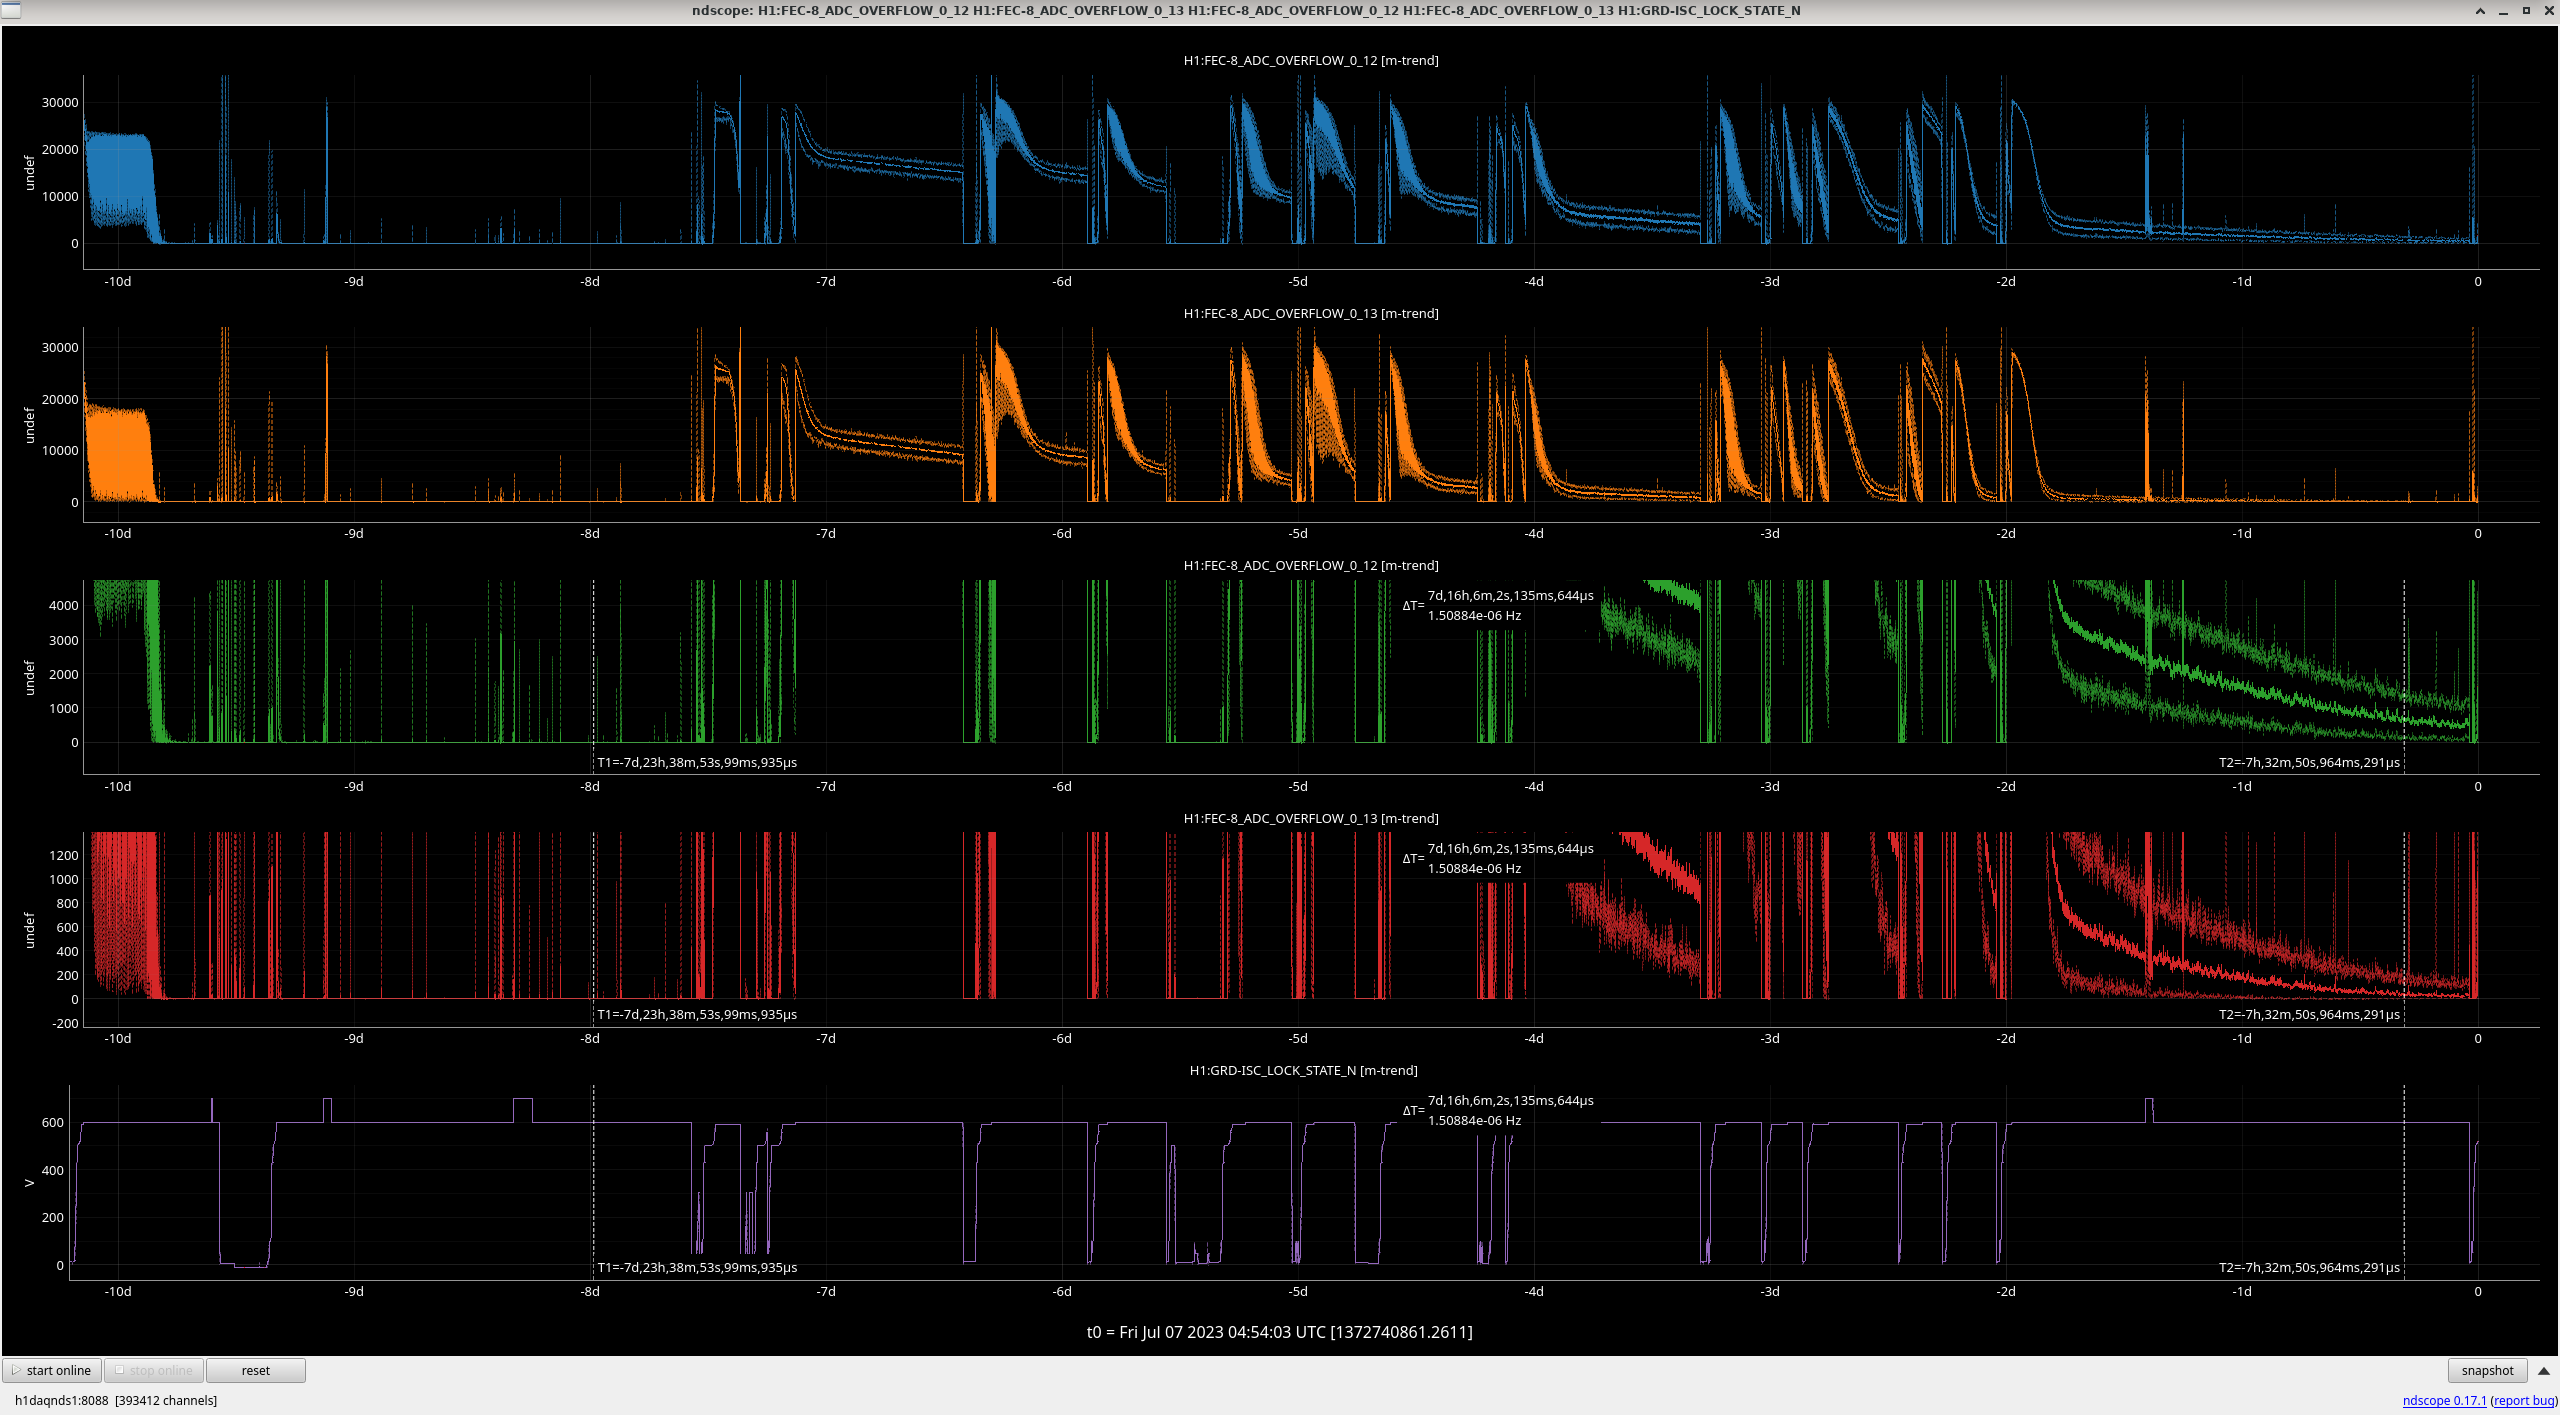
Nice alog Taylor. This shows how important it is for us to understand and stop these violin ring ups, which started 29th June, links in alog71404. They decreased over July 5/6/7th as we had a long 40+hr lock where we were able to nicely damp them (overflows plot from 71129). Tagging OpsInfo and SUS.
This could also be a good opportunity, while the lines are large, for CW to tag these lines as caused by violins if not yet done.