Summary:
This is a continuation of single bounce beam analysis. In the past we've done OM2 hot/cold measurements for ITMX in alog 70502 and 71100, this time we've done a different thing (OM2 cold, ITM CO2 off/on for ITMY beam).
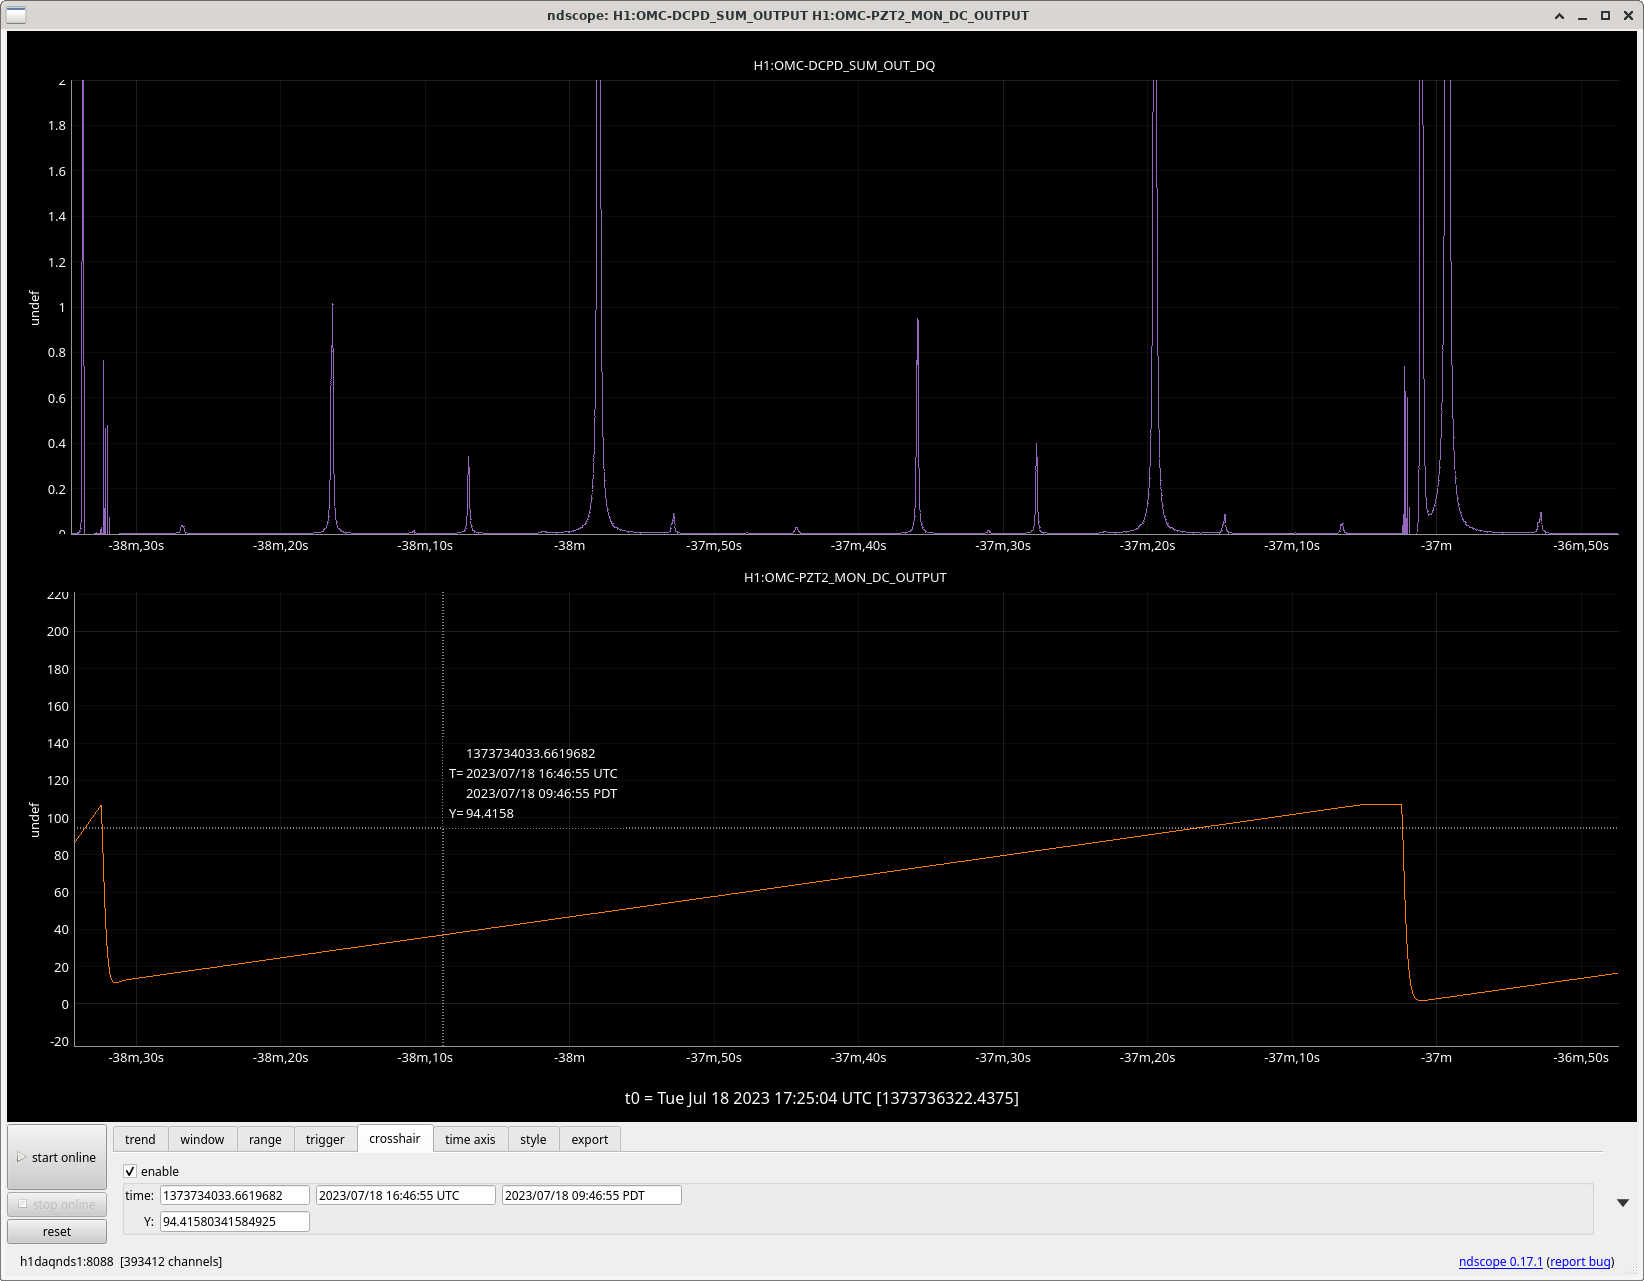
When ITM CO2 was off, the OMC scan looked like the first attached (for Jennie: about 16:46:35 - 16:47:58 UTC). 20 peak is ~1.0 while 00 peak is ~16 (off the scale in the plot).
With CO2 heating of 1W (started ~16:51:13) , the 20 peak started decreasing but it was much, much slower than we expected.
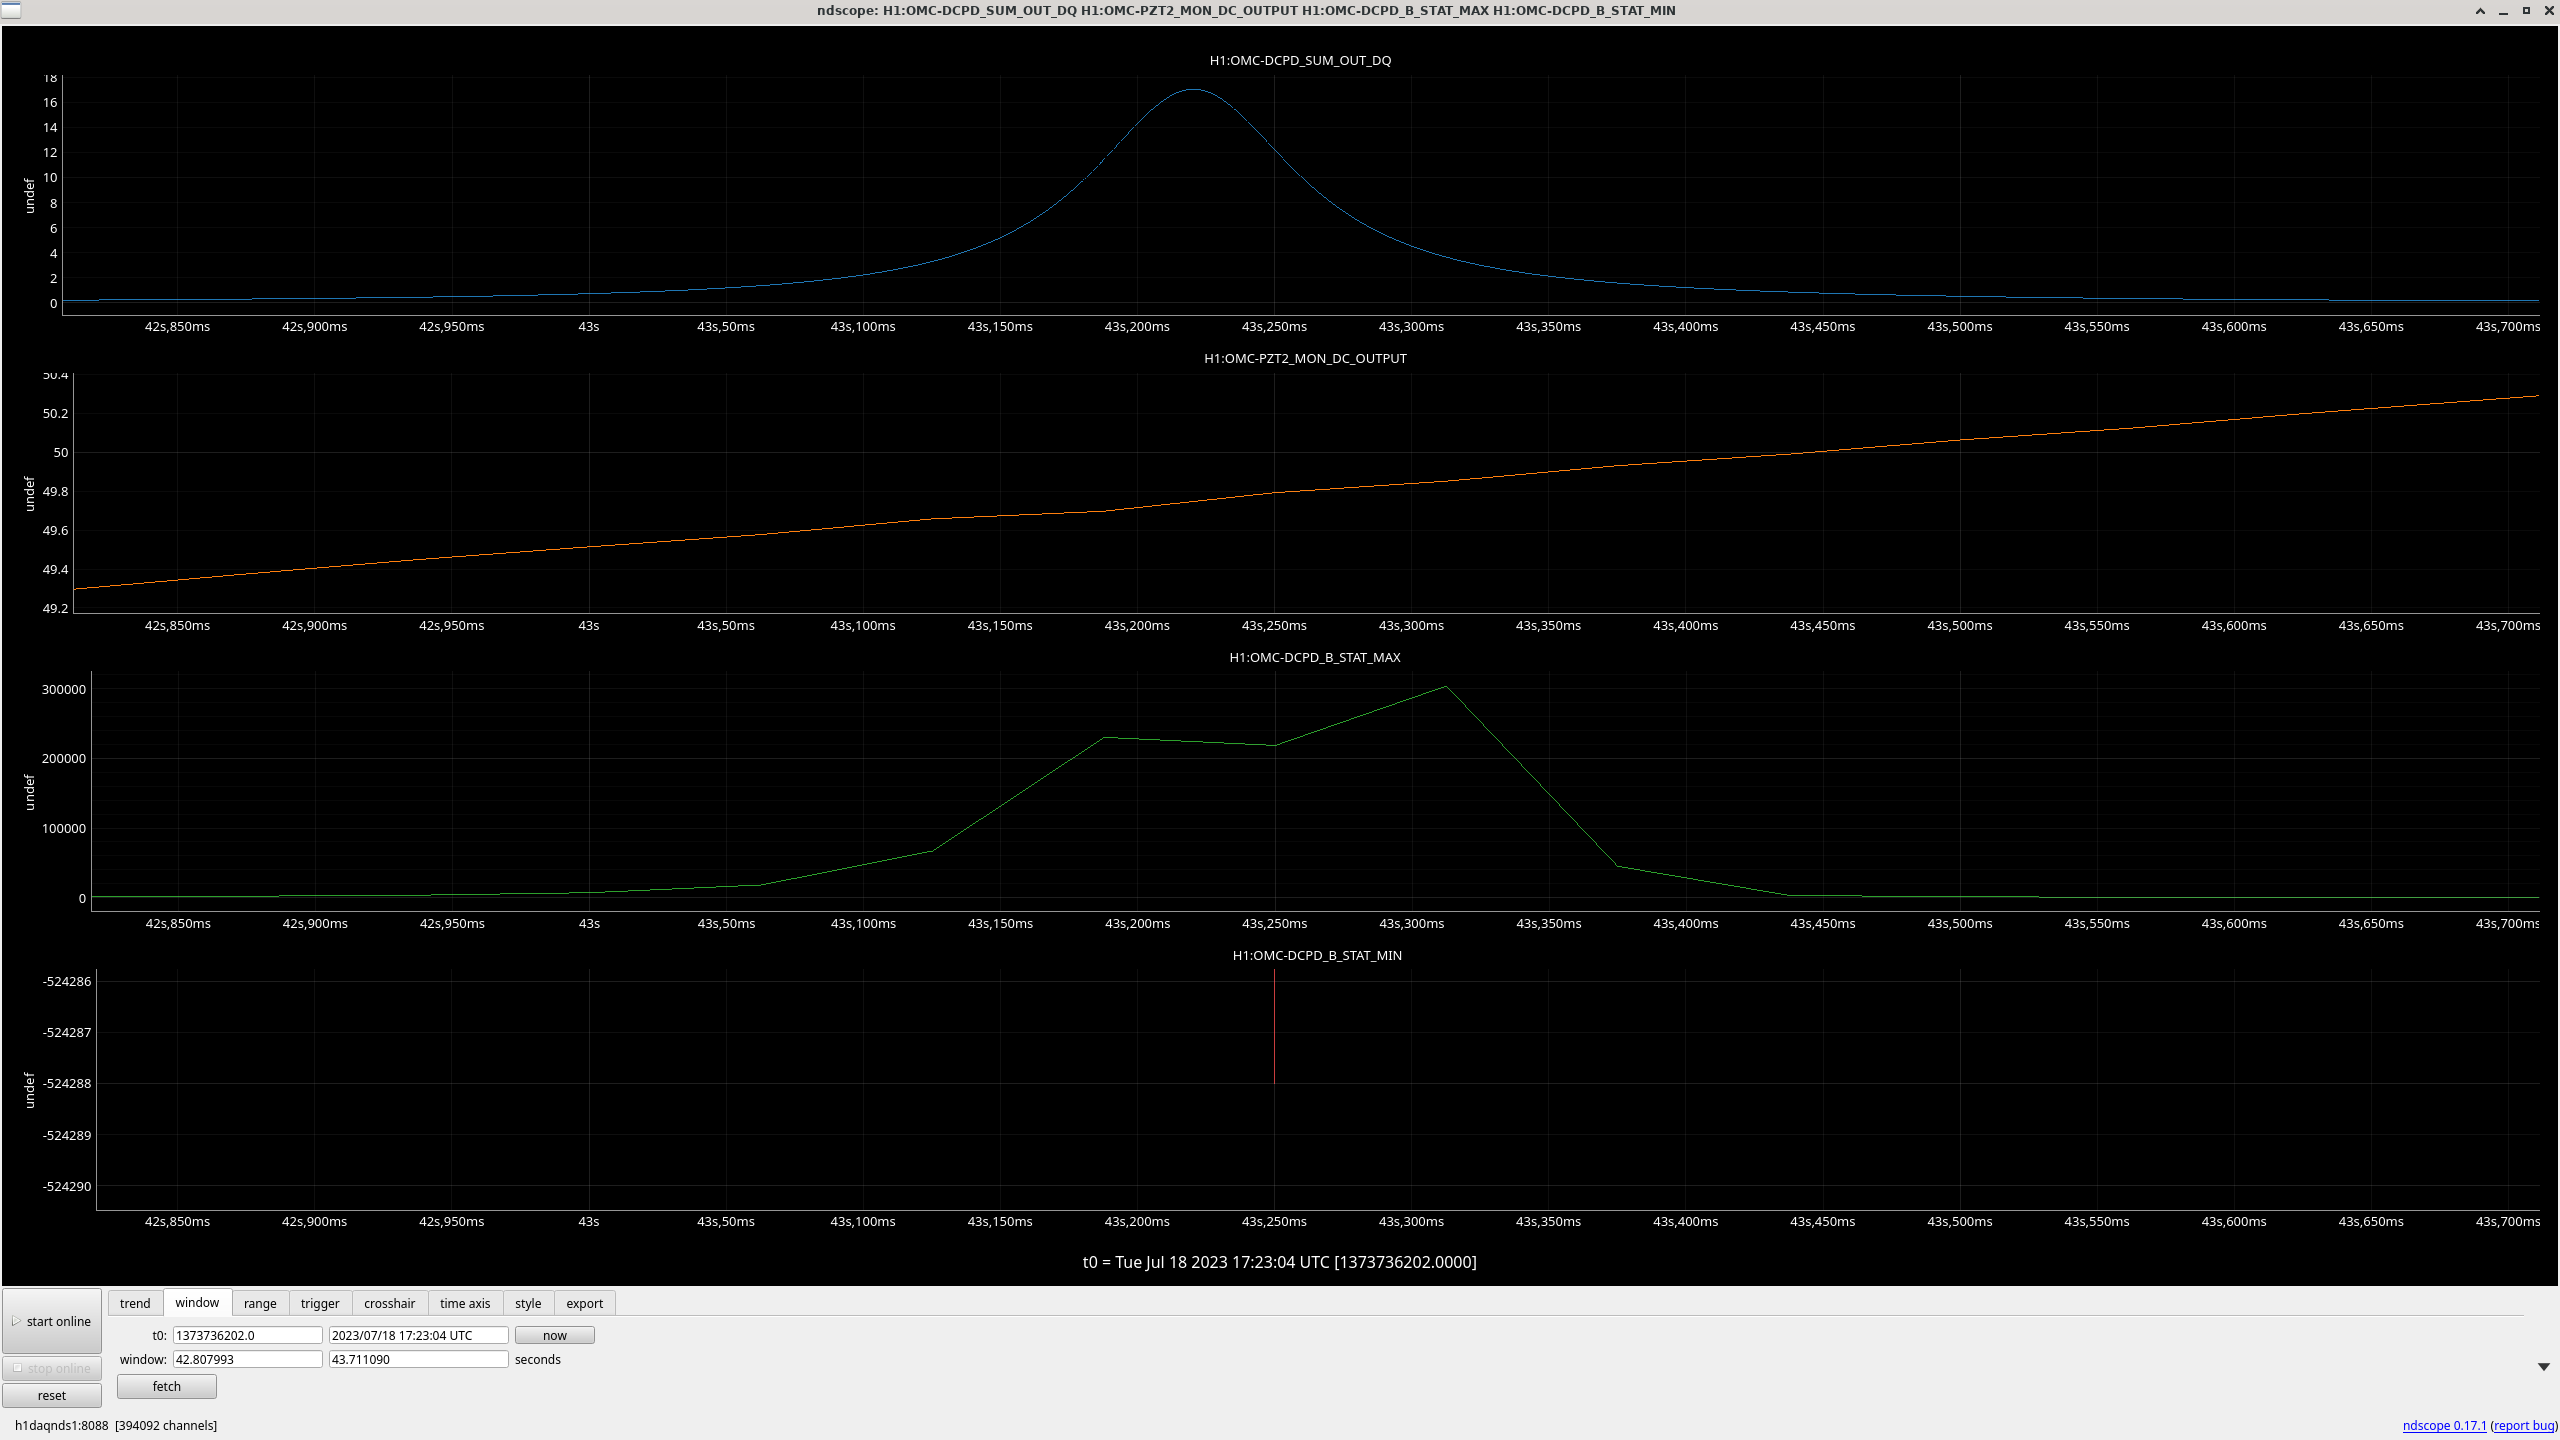
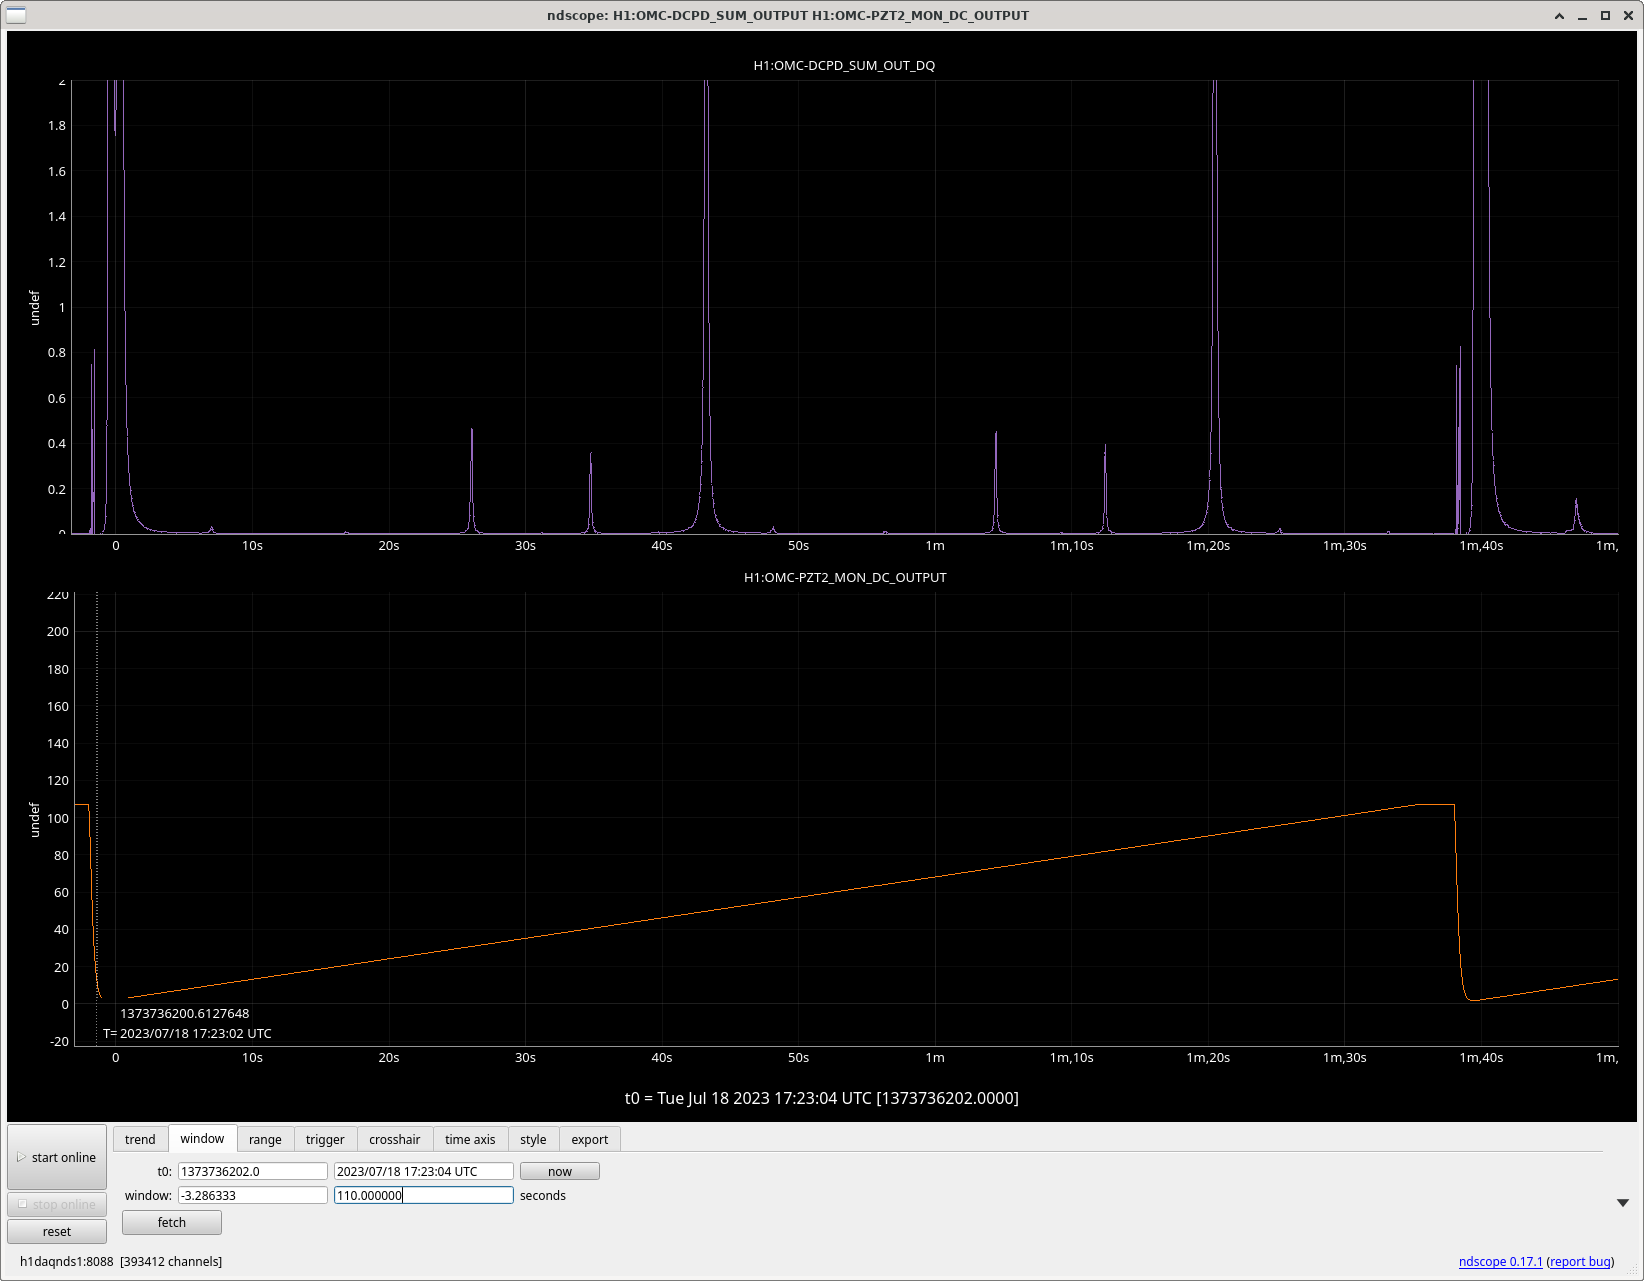
At around 17:25:00 UTC we had to stop due to other maintenance tasks. The last usable scan before this (for Jennie: 17:23:08-17:24:38 UTC) is shown in the second attachment. 20 peak was still slowly decreasing, but anyway at that moment 20 peak was down to 0.6.
Given this slow time constant, Daniel points out that maybe we should have waited longer after the IFO unlocked before starting the single bounce scan (both for today and for the past measurements). FYI IFO was unlocked at about 15:07 UTC.
I'll do my mode matching simulation as soon as Jennie gets the 20/(20+00) numbers.
What was done:
10W into IMC, ITMY single bounce. ASC-AS_A and AS_B DC centering (DC3 and DC4) were on. RF sidebands were turned off.
Manually locked OMC (OMC guardian auto, asked for prep-omc-scan, then go manual, scan the OMC-PZT2_EXC to find 00 peak, stop scan and adjust the PZT2_OFFSET so we're on the 00 resonance, ask for OMC_LSC_ON, then OMC_Locked and go AUTO, that's what I kind of remember).
Manually refined the alignment using OM3 and OMCS. Disabled the OMC LSC, OMC guardian DOWN, and started scanning. We ended up using 0.01Hz Ramp signal with 110V amplitude (PZT2_OFFSET zero) to make sure to use the full range of the PZT.
OM2 was cold throughout the scan (H1:AWC-OM2_TSAMS_THERMISTOR_1_TEMPERATURE=21.748 to 21.749, H1:AWC-OM2_TSAMS_THERMISTOR_2_TEMPERATURE= 22.149 to 22.147)
TCS was off at first. The first scan (16:45:35-16:47:58) was about 1h 40min after the lock loss.
TCS central heating of 1W was turned on at about 16:51:13.
Daniel restored the RF SBs and brought all settings back.
How to turn off RFSBs.
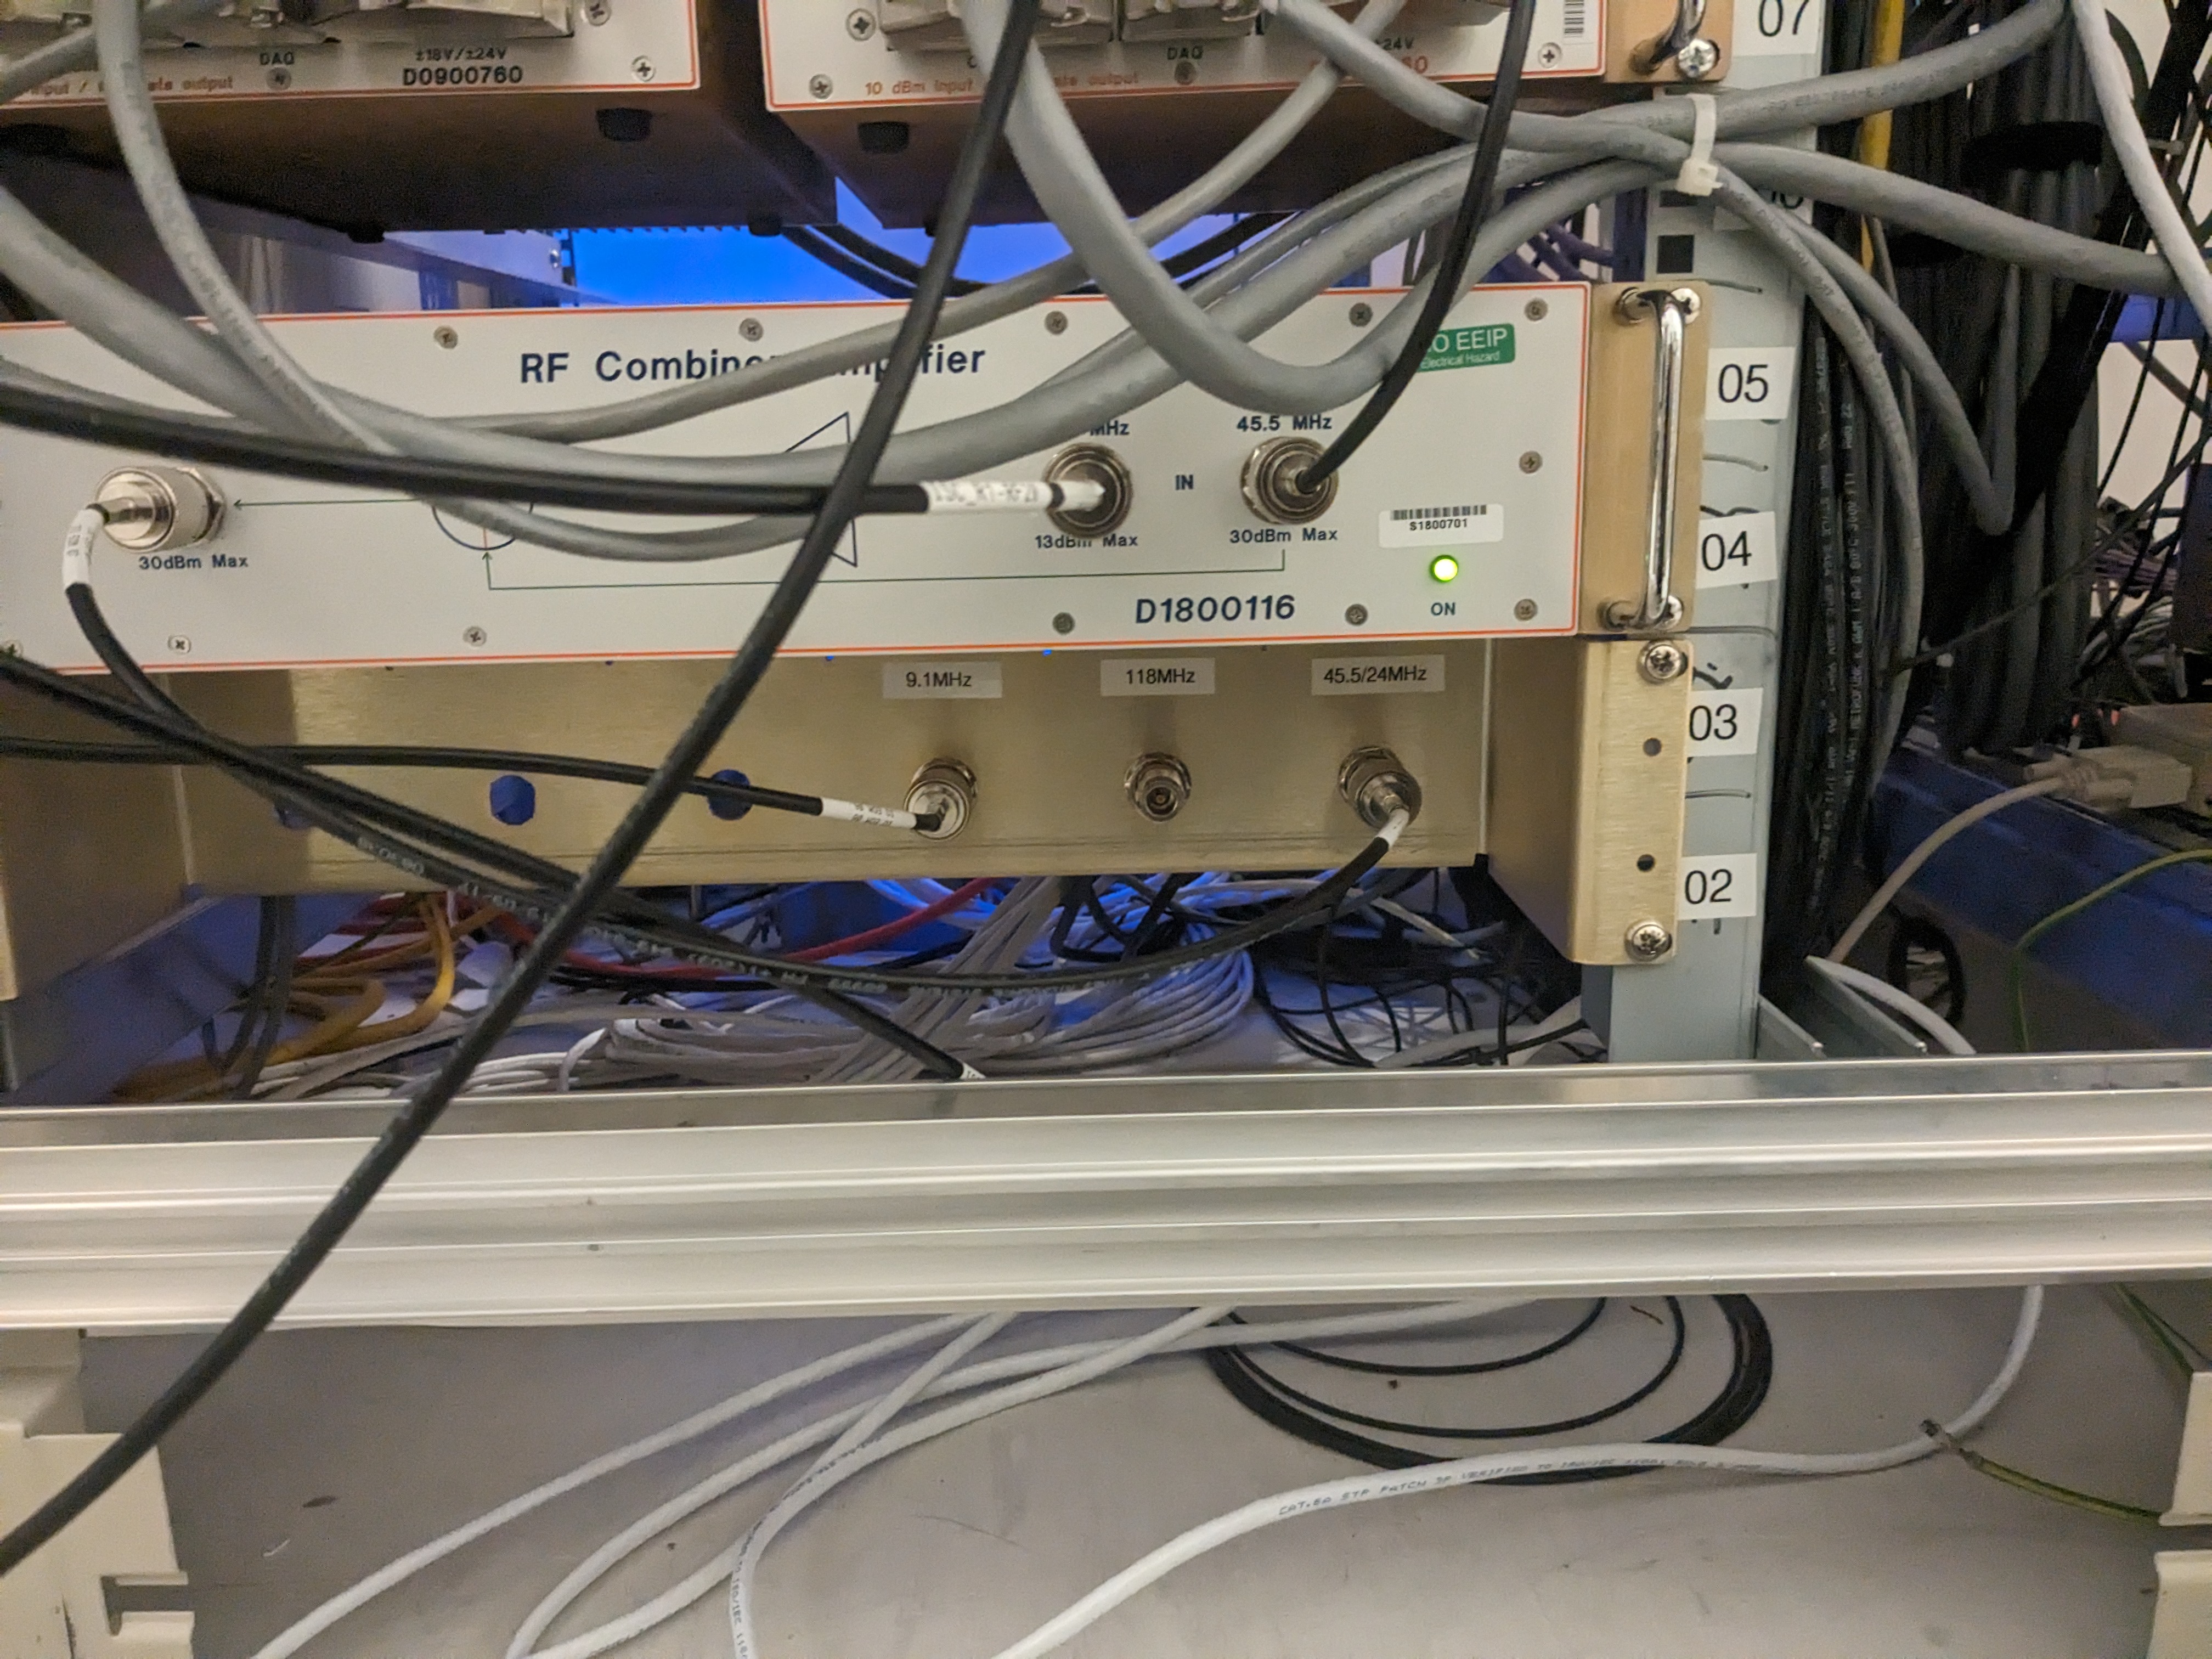
Disconnect the cable for 118MHz on the patch panel at the bottom of the PSL rack (1st picture).
On top of the patch panel there's a 24MHz amplifier, don't turn it off.
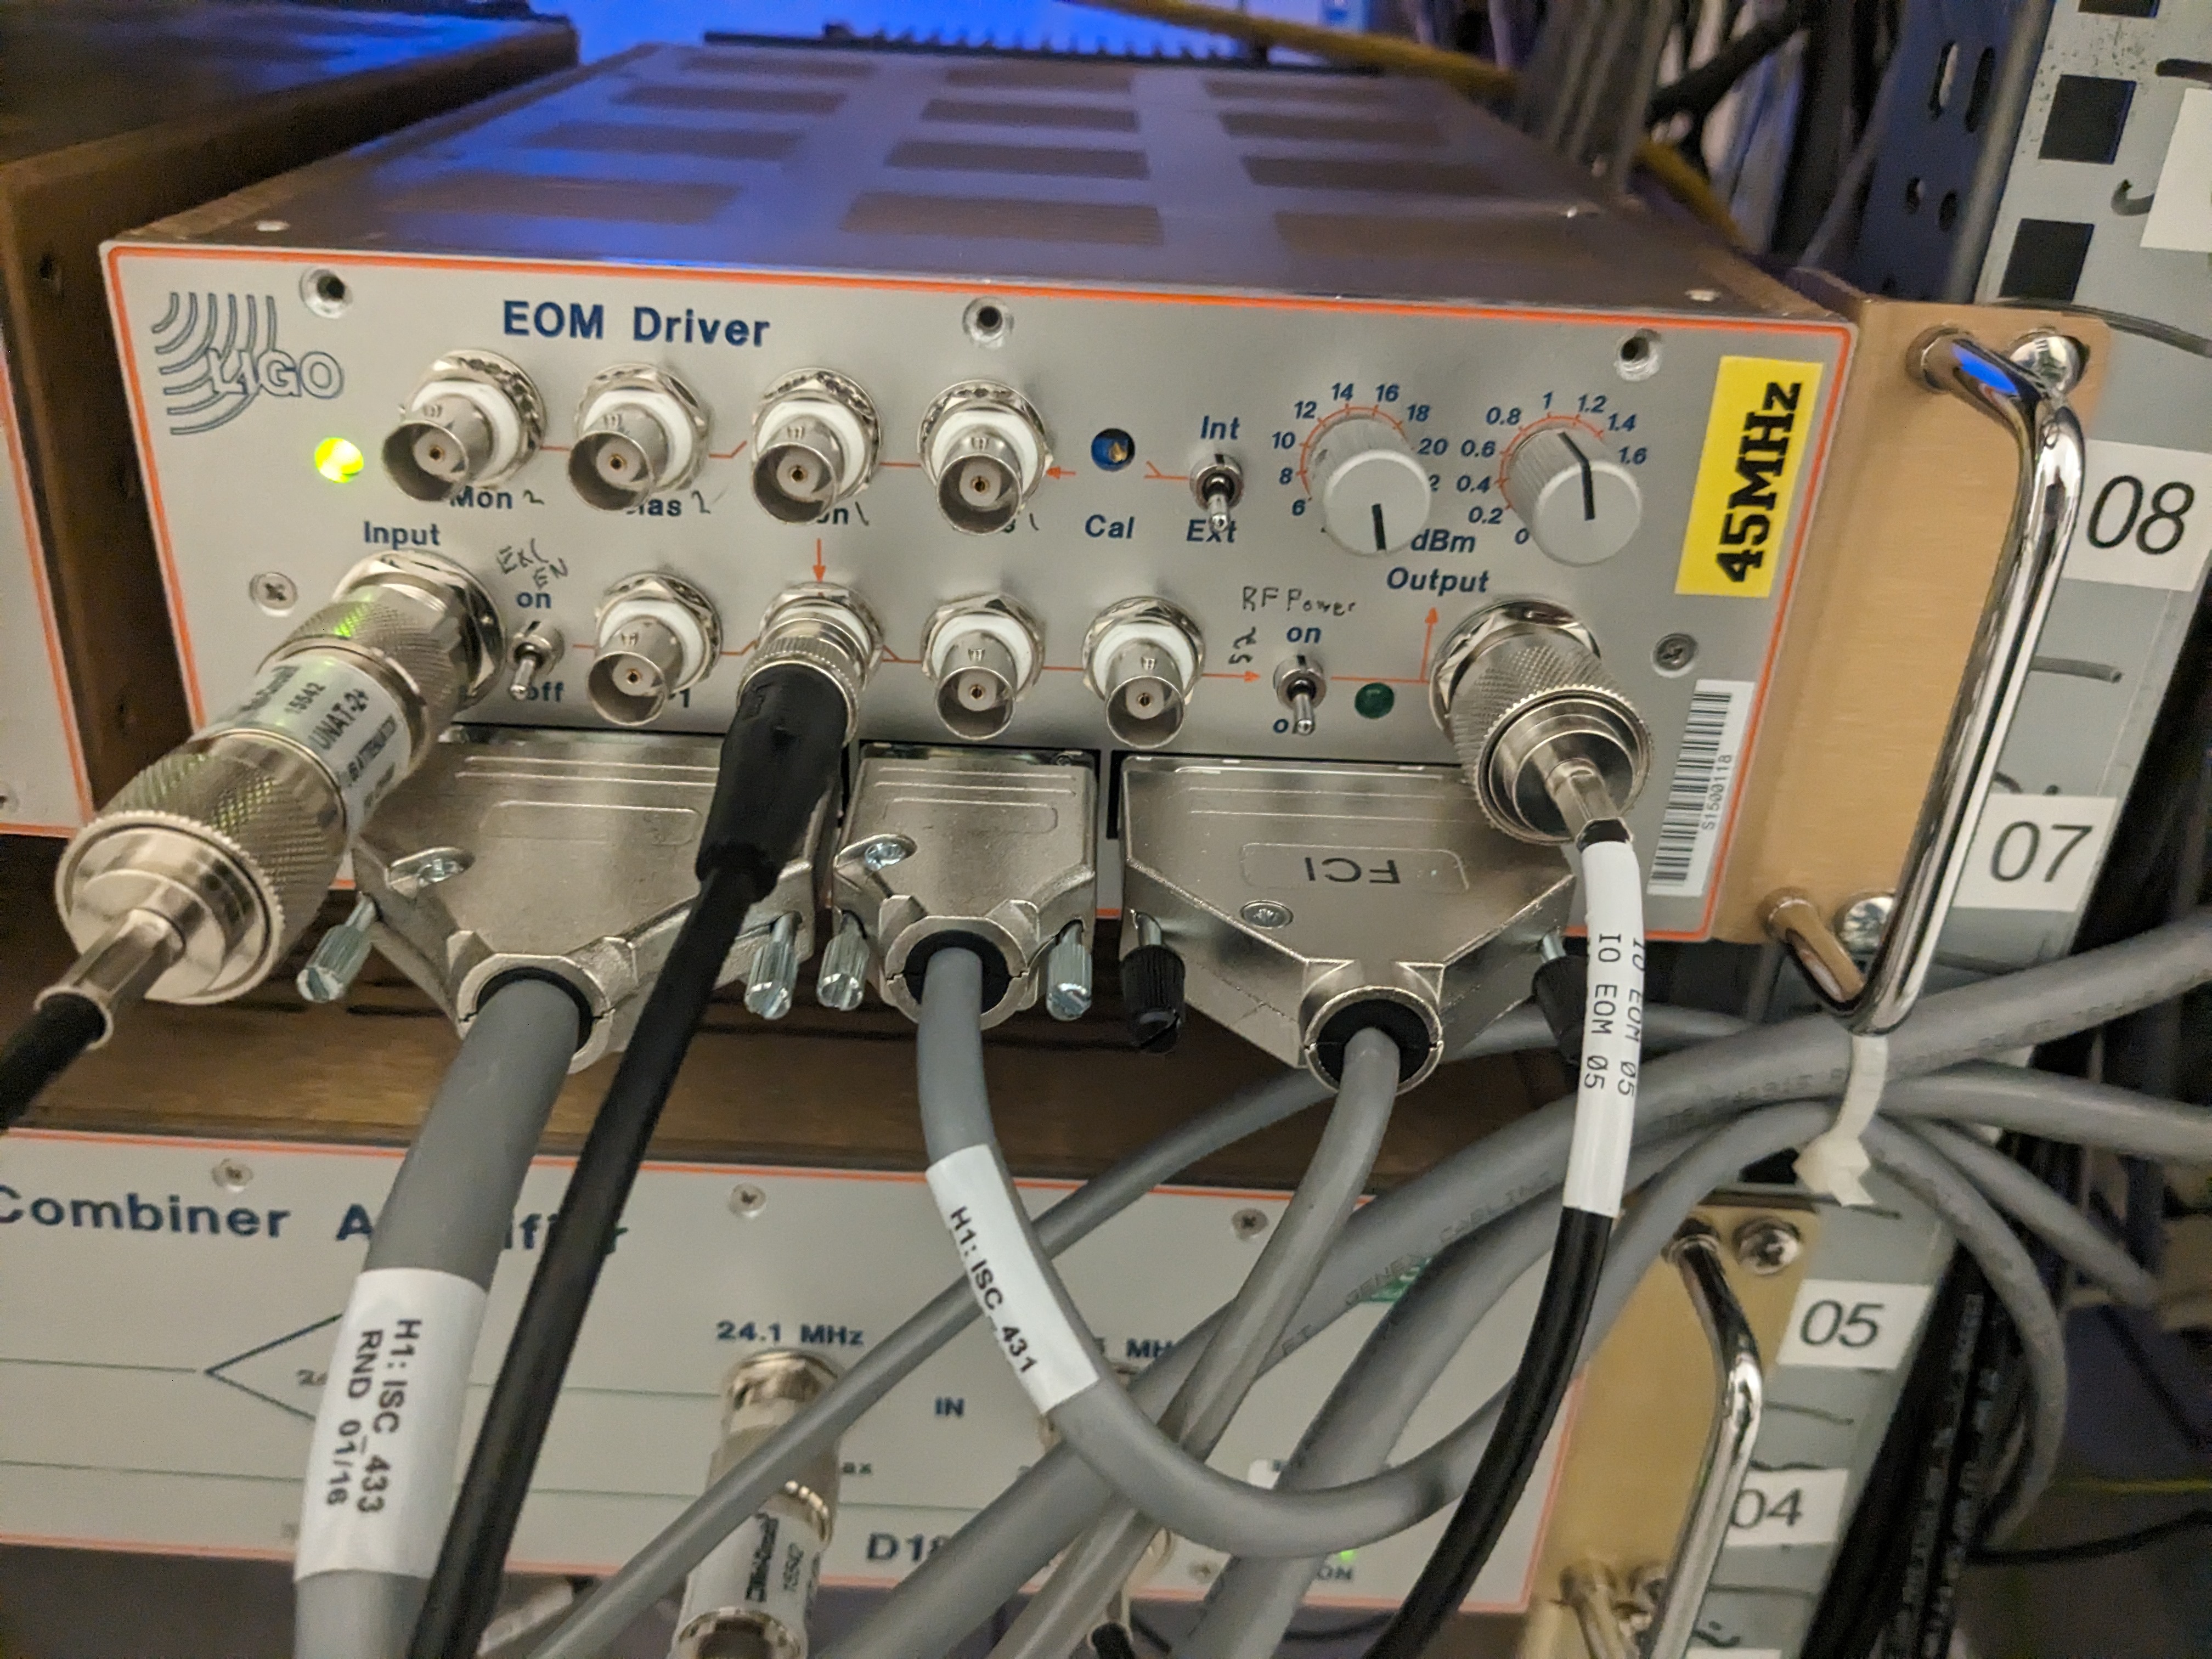
On top of the 24MHz thing, there are amplifiers for 9MHz and 45MHz. You will turn off the output of both (2nd picture showing the 45MHz unit with the RF output switch in OFF position).
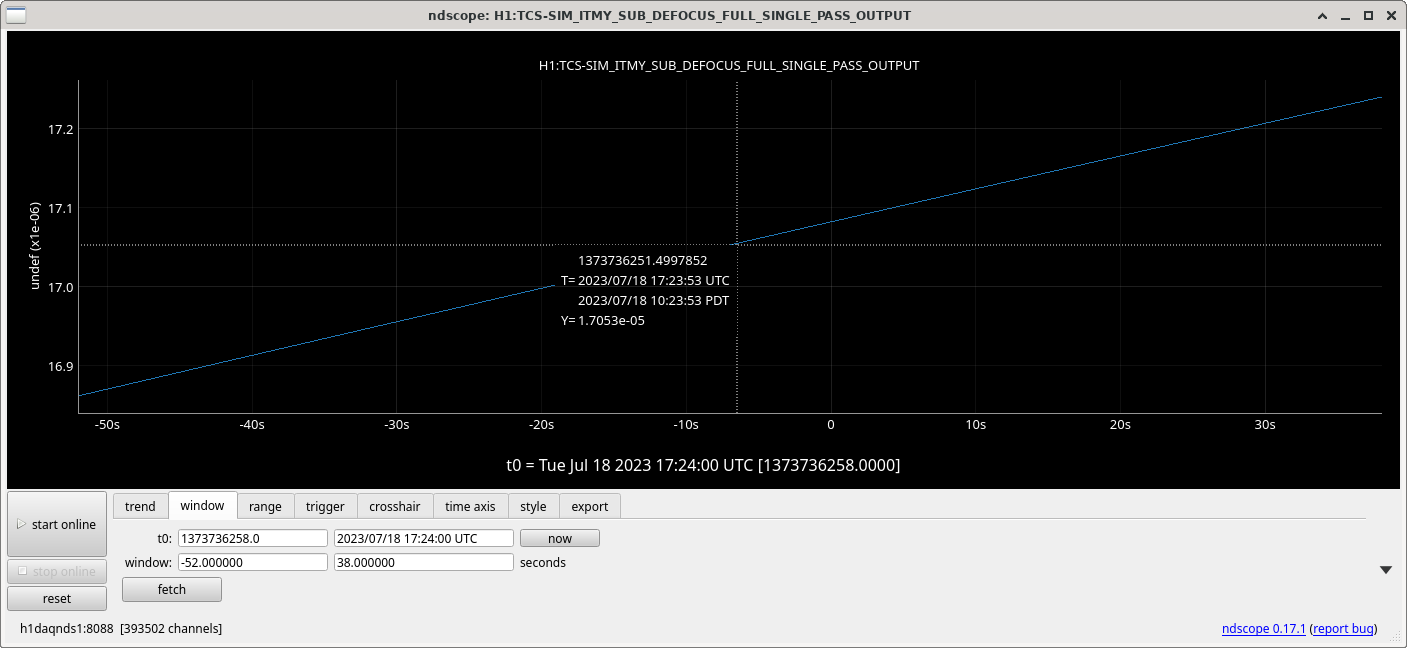
If we just believe TCS frontend simulation, H1:TCS-SIM_ITMY_SUB_DEFOCUA_FULL_SINGLE_PASS_OUTPUT was ~17.05uD during the last OMC scan before we gave up.
We might be able to use this to distinguish between the two patches in the MM parameter space (update in https://alog.ligo-wa.caltech.edu/aLOG/index.php?callRep=71477) but I'll wait for the OMC scan fitting results.
Executive Summary: The mode mis-match with no central heating on the ITM is 8.2%, the mode mis-match with central heating on the ITM is 3.6%.
For the first scan:
T0 = 1373734011
delta T = 87s
OMC scan is shown in the first png image.
Fitted C20/02 peak is shown in the first pdf.
We expect the HOM spacing to be 0.588 MHz as per this entry and DCC T1500060 Table 25.
The mode spacing is 148.796 - 149.388 = 0.592 MHz.
The ratio of second order to zeroth order carrier is (0.575 + 0.853)/(0.575 + 0.853 + 15.90) = 0.082 = 8.2 % mode mis-match
To run the code checkout git branch /dev of labutils and run measurement.
python OMCscan_nosidebands3.py 1373734011 87 "Sidebands off, 10W input, cold ITM + OM2" "single bounce" --verbose -m -o 2
and for the split peak fitting:
python fit_two_peaks_no_sidebands3.py
For the second scan:
T0 = 1373736206
delta T = 90s
OMC scan is shown in second png image.
Fitted C20/02 peak is shown in the second pdf.
The mode spacing is 148.741 - 149.338 = 0.597 MHz.
The ratio of second order to zeroth order carrier is (0.201 + 0.428)/(0.201 + 0.428 + 17.02) = 0.036 = 3.6 % mode mis-match
Run the following on the same git branch.
python OMCscan_nosidebands4.py 1373736206 90 "Sidebands off, 10W input, hot ITM + cold OM2" "single bounce" --verbose -m -o 2 -p 0.01
and for the split peak fitting:
python fit_two_peaks_no_sidebands4.py
data is in labutils/omc_scan/data/2023-07-18
files in labutils/omc_scan
figures in labutils/omc_scan/figures/2023-07-18


Summary:
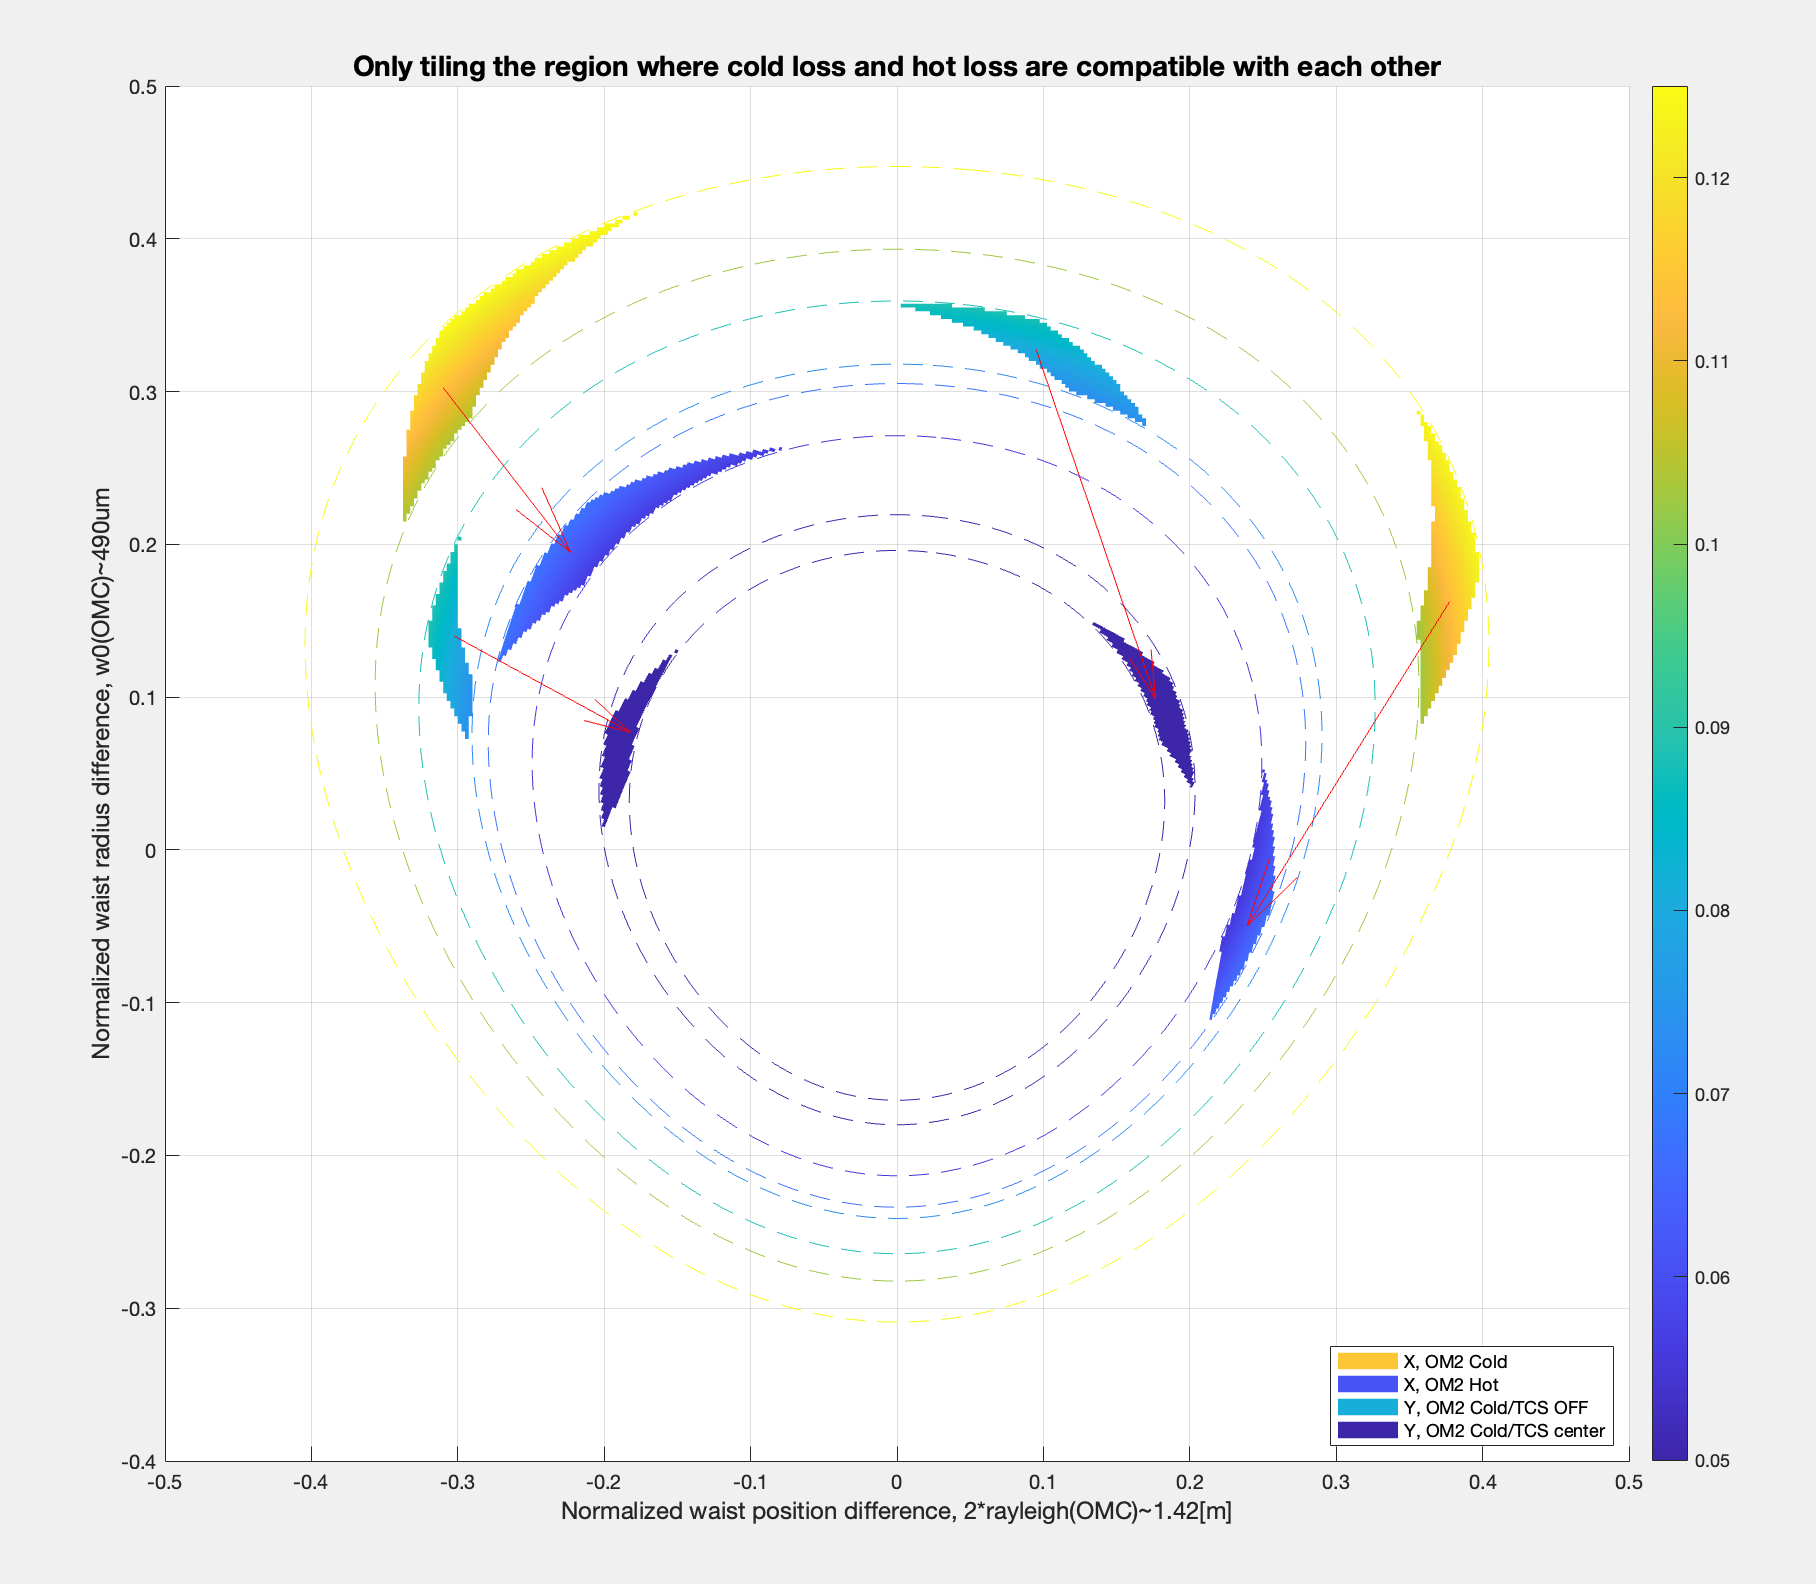
Incorporated the fit results and updated the plot. Original analysis is in alog 71145.
In the attached, there are two pairs of patches, each pair comprising yellow and lighter blue, that represent the previous measurement (alog 71145 where ITMX single bounce was used with no TCS, OM2 hot/cold) and two pairs, each pair comprising greenish blue and darker blue, that represent the measurent done this time (ITMY single bounce, cold OM2, TCS ON/OFF).
Since it's impossible that the beam parameters of ITMX single bounce beam on the OMC are totally different from those of ITMY single bounce, you can just look at the distance between pairs and judge which ones represent the reality. In this case, the patches in the left half plane are the clear winners.
Details and caveats:
Calculation done for the ITMY single bounce is exactly the same as ITMX except that the measured losses are different and the mode actuator is ITMY central TCS instead of OM2.
As for the TCS optical power I used H1:TCS-SIM_ITMY_SUB_DEFOCUS_FULL_SINGLE_PASS_OUTPUT~17uD for the central heating (zero for no heating). I simply doubled the number for double-pass effect. If this is grossly off the result might look different.
Since 1st order HOM power was not negligible in ITMY single bouncer scan, as a first order approximation, I used P2/(P0+P1+P2) as the measured mode matching loss where P0, P1 and P2 are the power of 00, 1st order and 2nd order mode (for the 2nd order mode, 20 and 02 were resolved by the fit code). I've done this to ITMX single bounce scan too just for consistency.
If the model is perfect and has everything, the difference between yellow "X, OM2" and greenish-blue "Y, OM2 Cold/TCS OFF" should be explained by the difference in the ITM ROC, substrate lensing/heating including the TCS (and IFO heating prior to lock loss, since we haven't waited for hours and hours after the IFO was unlocked). It would be interesting to see if ITM difference will make the plot look any different.
However, the model doesn't have ITMX and ITMY, it's just a single ITM at the average location. Though it's easy to implement that feature in principle, I have a suspicion that the numbers used for ITM substrate lens effect in the past could be off, and I've contacted GariLynn. Wait for the conclusion of that discussion.
A big caveat is that you cannot quickly draw conclusion about the full IFO mode matching from this. At the very least, you have to take into account that the arm mode is primarily determined by the HR and that the carrier coming to OMC from inside the arms only experience the ITM lensing once (-ish).
Another big caveat is that the ADC was railing for the 00 mode peak. Look at the 2nd attachment bottom where H1:OMC-DCPD_B_STAT_MIN=-(2^19). It's not as bad as the finesse measurement (alog 71888) as the scan was slower, but if we want a better data we need to redo it with lower power or w/o x10 gain.
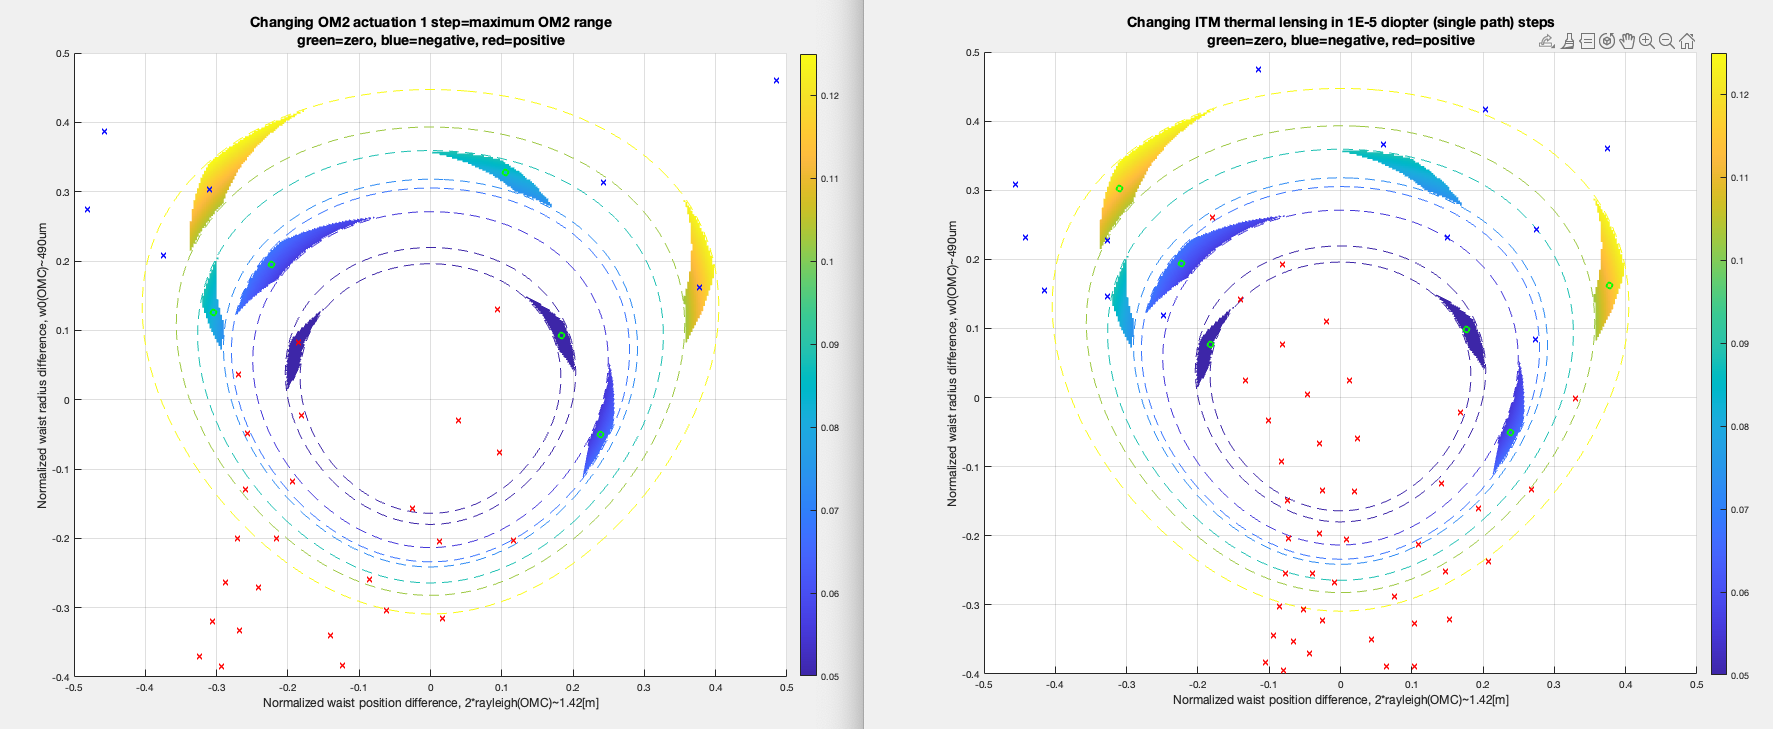
Last attachment shows what happens when you change OM2 (left, 1 step in the plot = maximum range of the T-SAMS) or ITM heating (right, 1 step = 10uD single pass).