jane.glanzer@LIGO.ORG - posted 09:57, Thursday 27 July 2023 (71762)
O4 and O3 glitch rate comparison
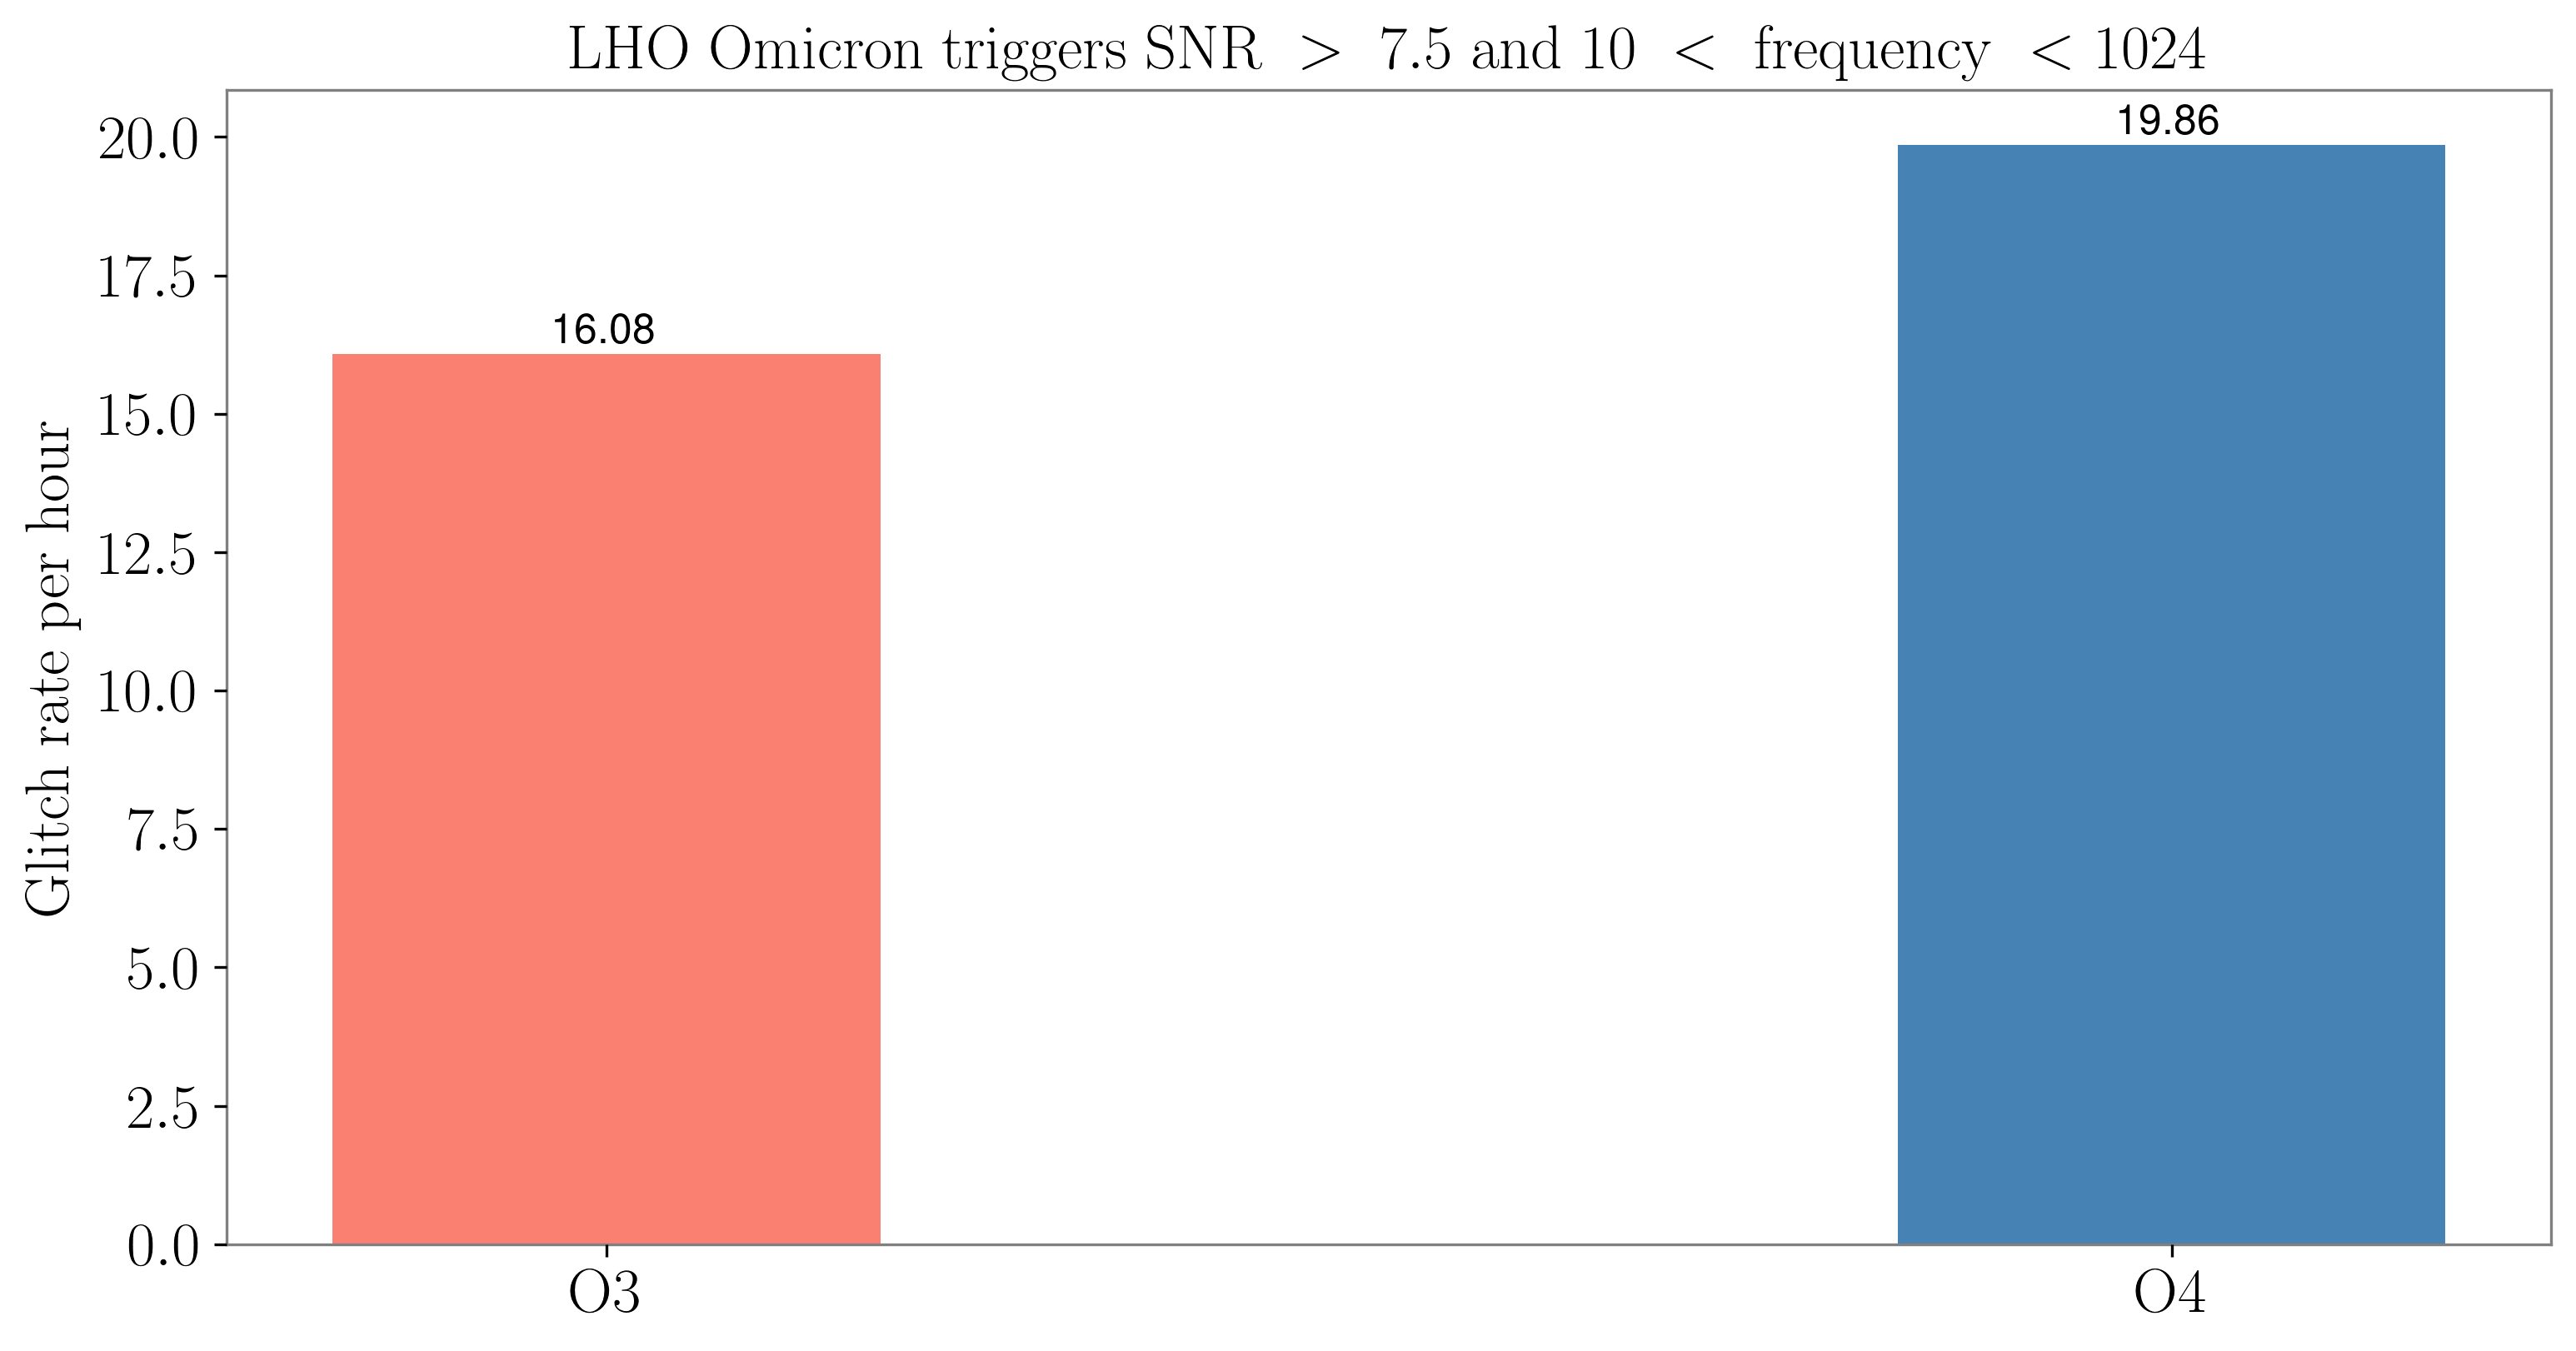
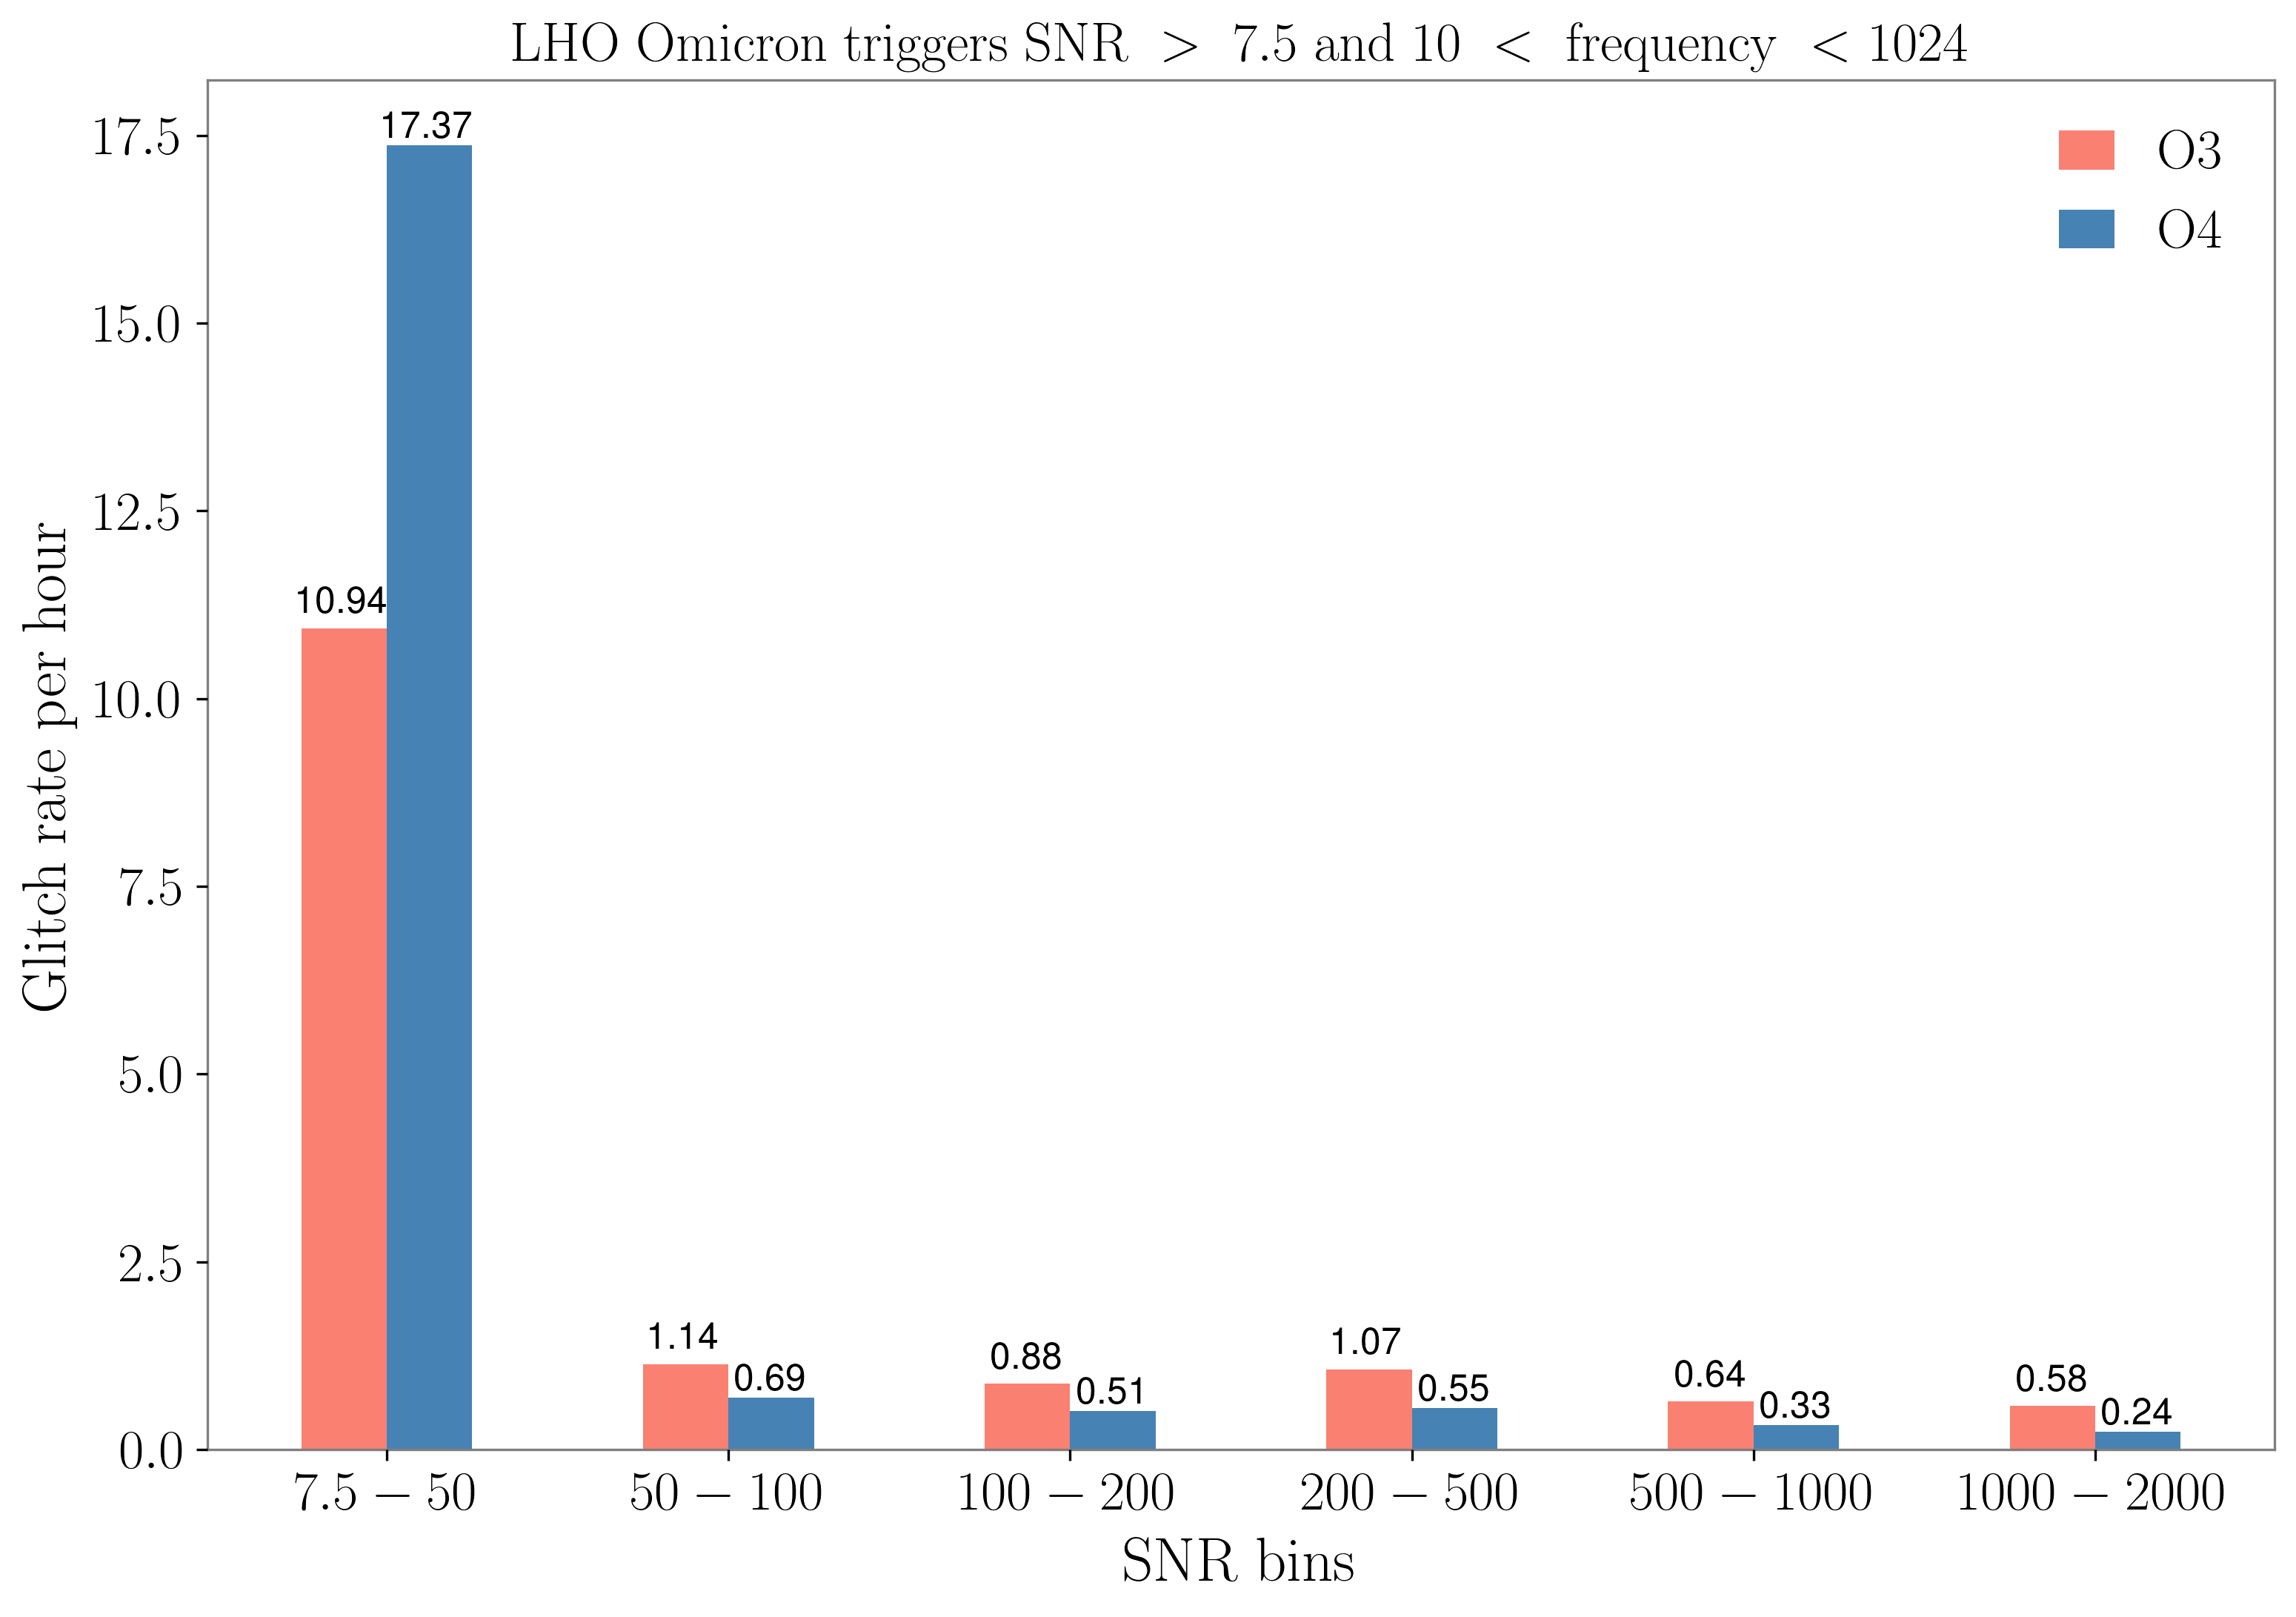
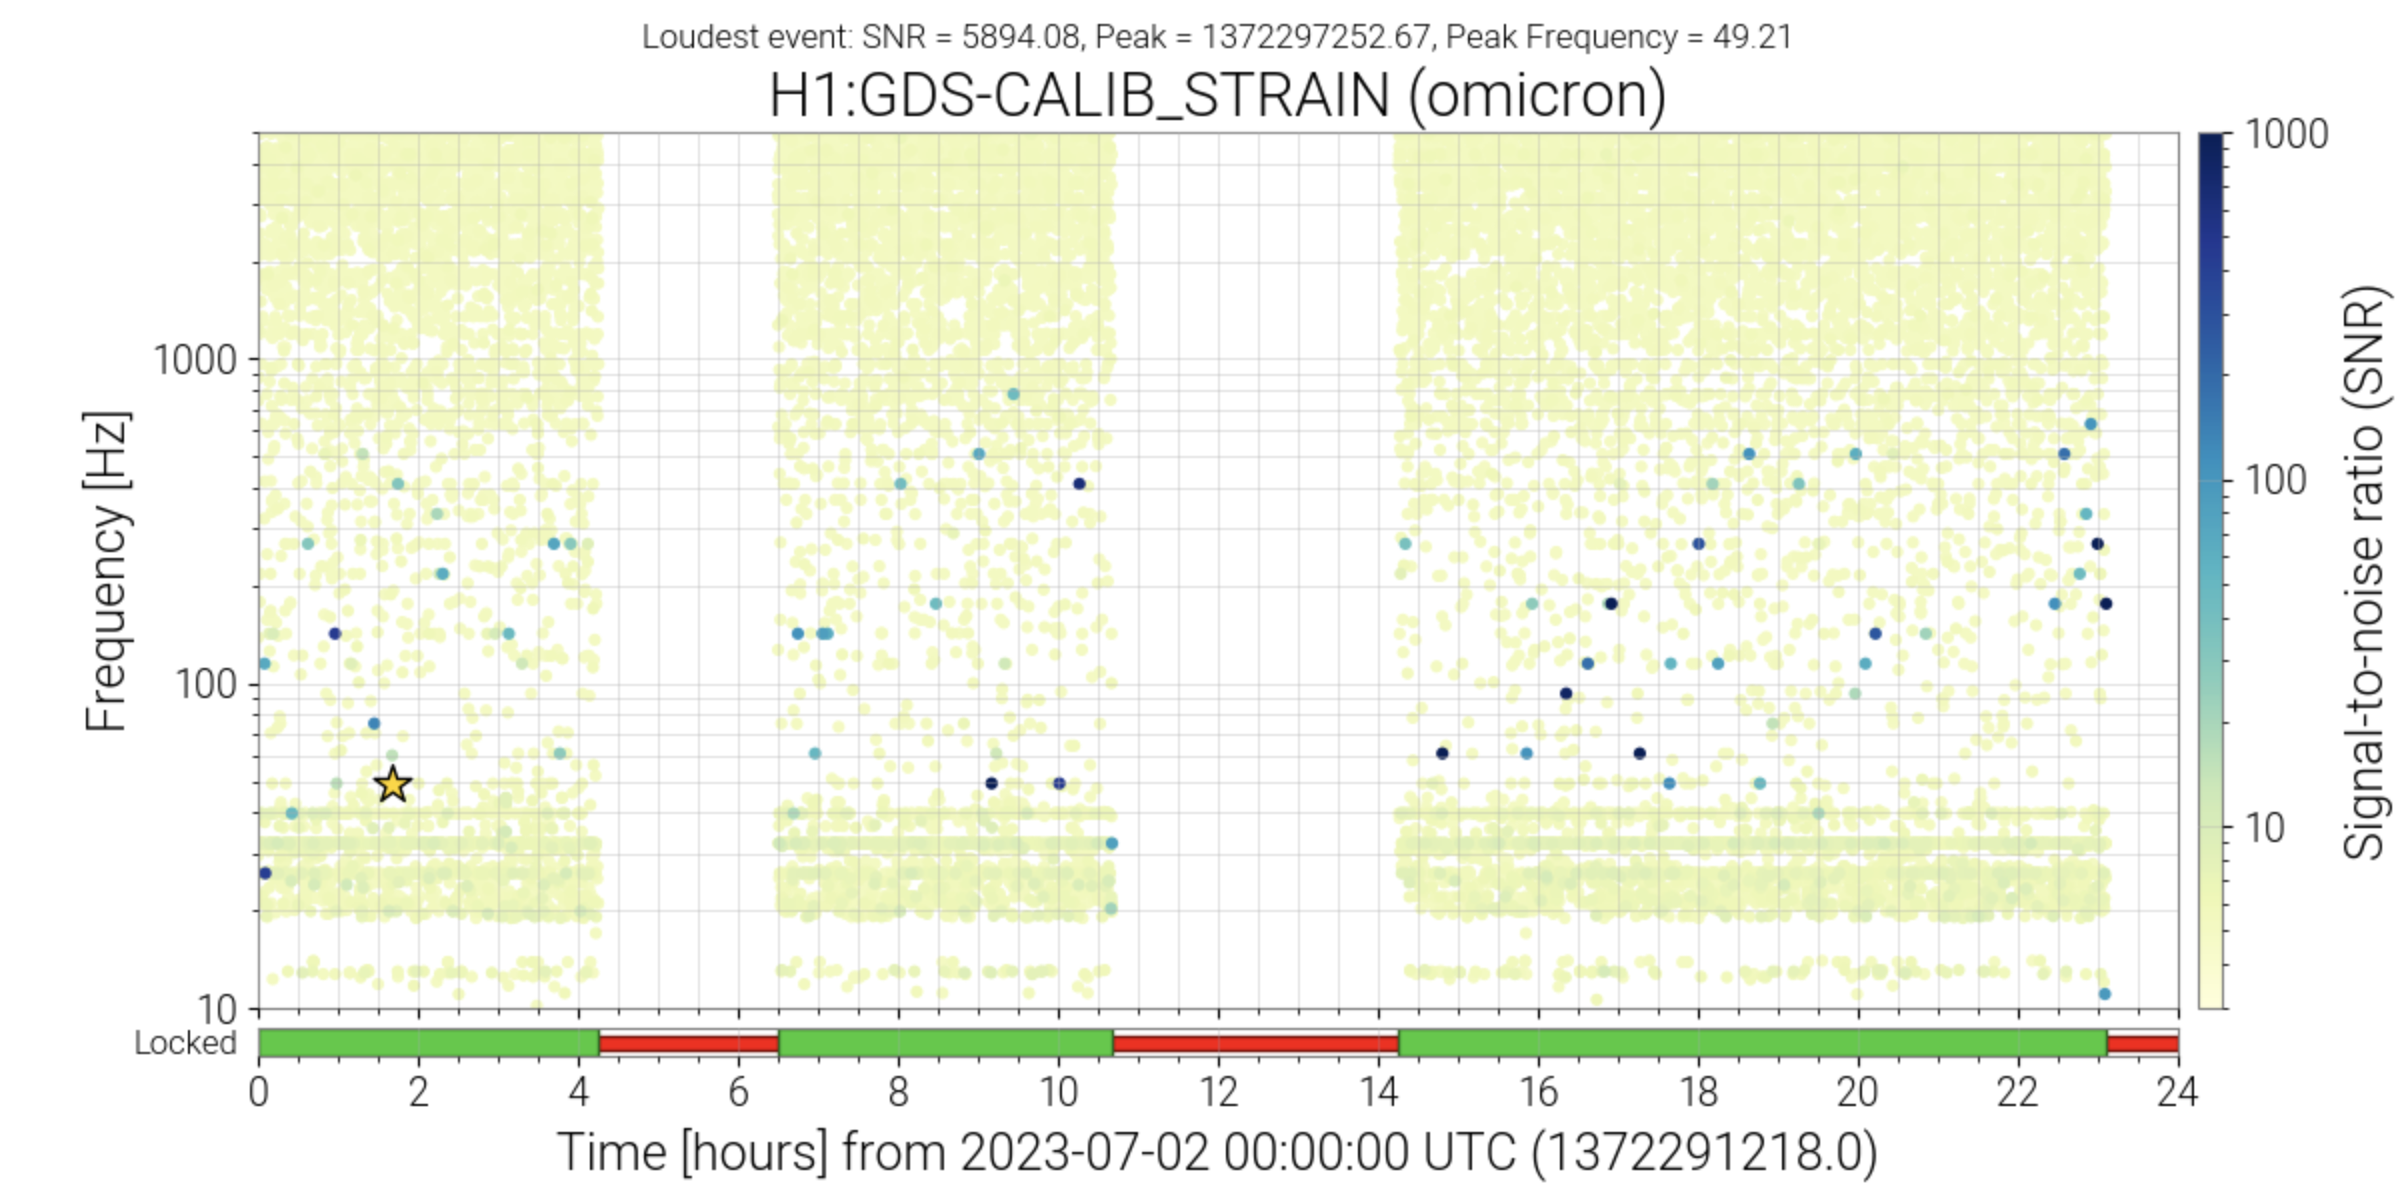
Sidd, Jane

We used available data to look at the glitch rates so far during the run and compare to O3.

The times used in the analysis were:

O3: May 24th - July 10th (observing duration 2912751 secs)
O4: May 24th - July 18th (observing duration 2922144 secs)

The Omicron triggers used in this analysis were SNR above 7.5 and frequency between 10 Hz and 1024 Hz.
The first plot shows the glitch rate between O3 and O4 during the times mentioned above.

O3 May 24th - July 10th glitch rate: 16.08 per hour
O4 May 24th - July 18th glitch rate: 19.86 per hour

The second plot shows the glitch rate as a function of various SNR bins. We can see in this plot a reduction in the noise above an SNR of 50, whereas below 50 the rate has almost doubled as compared to O3. In the third image I've include the Gravity Spy classifications of the glitches (with confidence > 90%) and we can see that fast scattering is the dominating class. The increase in the fast scatter seems to be related to the increase in low frequency noise at around 20-40 Hz, shown in the fourth image of an Omicron glitchgram.
Images attached to this report