genevieve.connolly@LIGO.ORG - posted 16:04, Tuesday 01 August 2023 (71868)
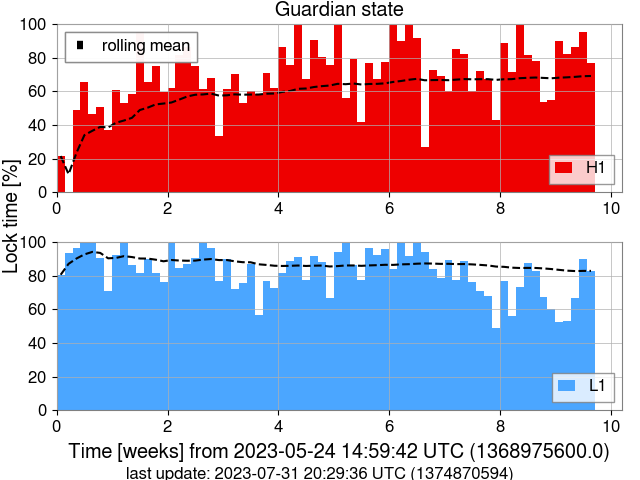
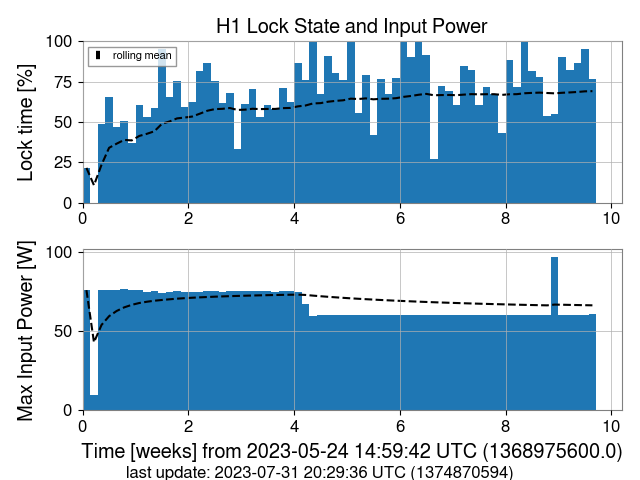
Guardian state & input power plots
These plots show the Gaurdian states of H1 and L1, and the lock time of H1 compared to the (maximum) input power. The Guardian state plot is similar to this one on the summary pages, but specifically shows what percentage of time the Guardian state was ≥600 (≥2000 for L1), regardless of whether or not we were observing. Based on the input power plot, it looks like there may be a bit of improvement in the Guardian state after the power was decreased.
Images attached to this report