I noticed in the most recent cps famis task that there is a very sharp peak in a number of ITMY ISI sensors. It's visible in a number of dofs, but trolling through the spectrograms on the summary pages, it seems like it's not always visible, so I never noticed it on the wall foms. This peak seems to be very coherent with at least DARM and CHARD when it is visible, so it's I will try to figure out a configuration that will let us avoid it. It hasn't been visible today,so I haven't been able to try anything, but suspect that using a blend that doesn't use the sensor that I suspect is failing. This makes 3 "bad" l4cs in the IFO all ST1 H1 L4Cs, I don't have an explanation, but that is very suspicious.
As far as which sensor, I suspect it is the St1 H1 L4C. Looking at tranfer functions among the various mostly co-aligned sensors, the H1 L4C consistently has diferent behaviour from the other sensors, particularly around and below the L4C pendulum frequency.
First image, shows the corner ITMY ground sensor and the ITMY St1 Y T240. Red is the ground sts, blue is the ITMY St1Y, green is the ITMX St1Y. The peak at 1.32hz on ITMY is more than a factor of 10 above the ground motion, but this was at 9 utc on the 20th, asds don't show the peak right now.
Looking at the some of the ground and ISI motion blrms channels this peak has been coming and going over the last couple of weeks. Second image compares the ground, itmy st1, bs st1 and itmx st1 y 1-3hz blrms over the last couple weeks. It certainly seems like about the time that the ITMY st2 h2 cps started glitching, the ITMY ST1 H1 L4C started to intermittently get noisy. Seems like a reasonable explanation is the L4C is failing some way internally and the multiple trips from the CPS glitching made that get worse.
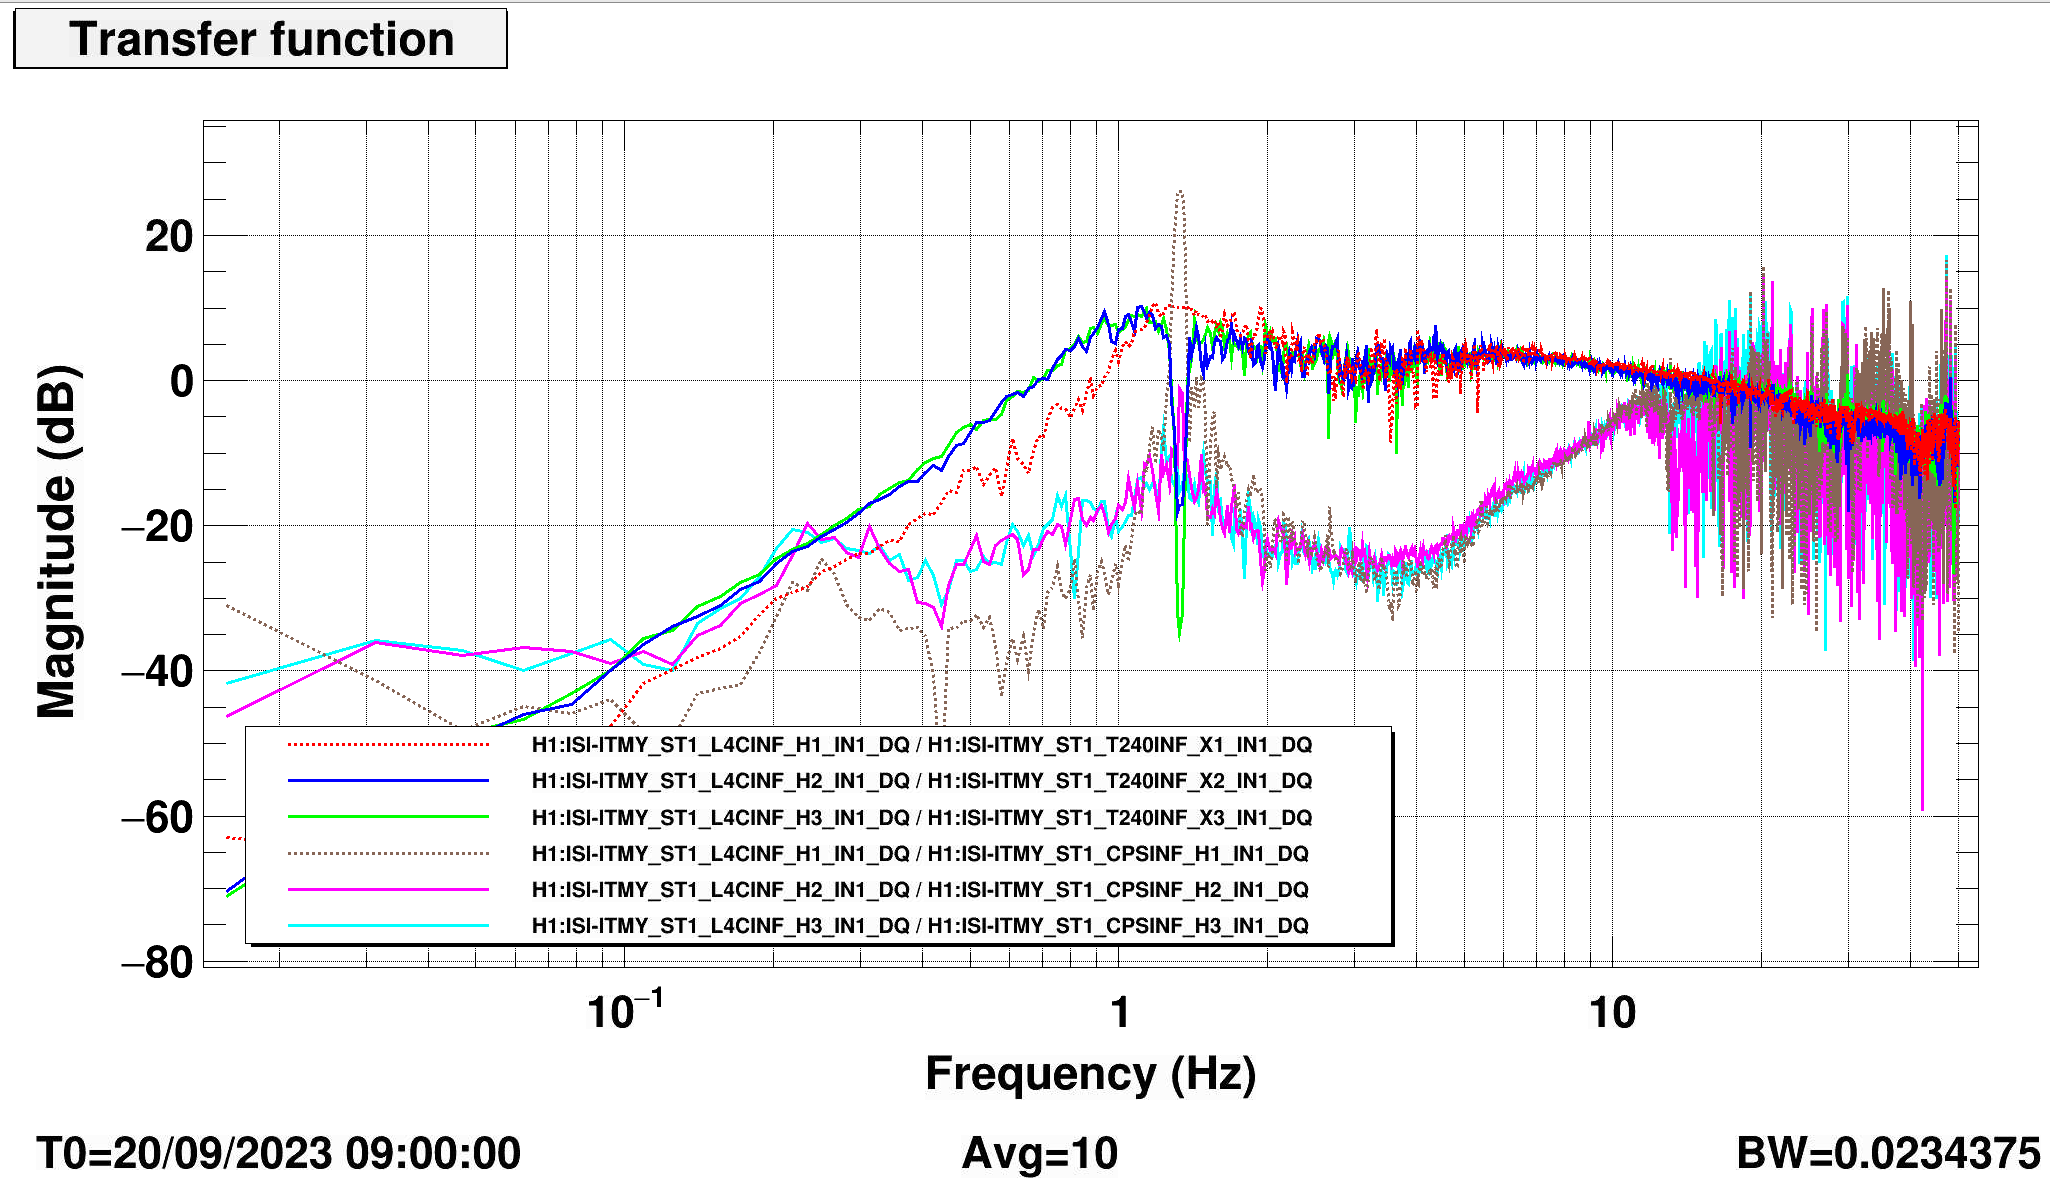
Third tf plot shows the co-located passive sensor tfs for the L4Cs, the dashed lines are the H1 l4c to H1 cps and X1 T240 tfs, the other traces are the H2 and H3 l4cs. Red, blue and green should all be pretty similar and look something like the typical 1hz seismometer response, but the dashed red trace looks like something has changed the low frequency response of the H1 L4C. There's a notch in the blue and green traces, I think because the peak in the H1 sensor is so loud it's all the other sensor can see. The brown, light blue and pink traces are the local L4C to CPS tfs. Kind of similar, kind of different, the low frequency reponse of the H1 sensor is different from the other 2 sensor pairs, and but the peak doesn't show up as much in the other sensors because of CPS noise or something. Need to think about that.
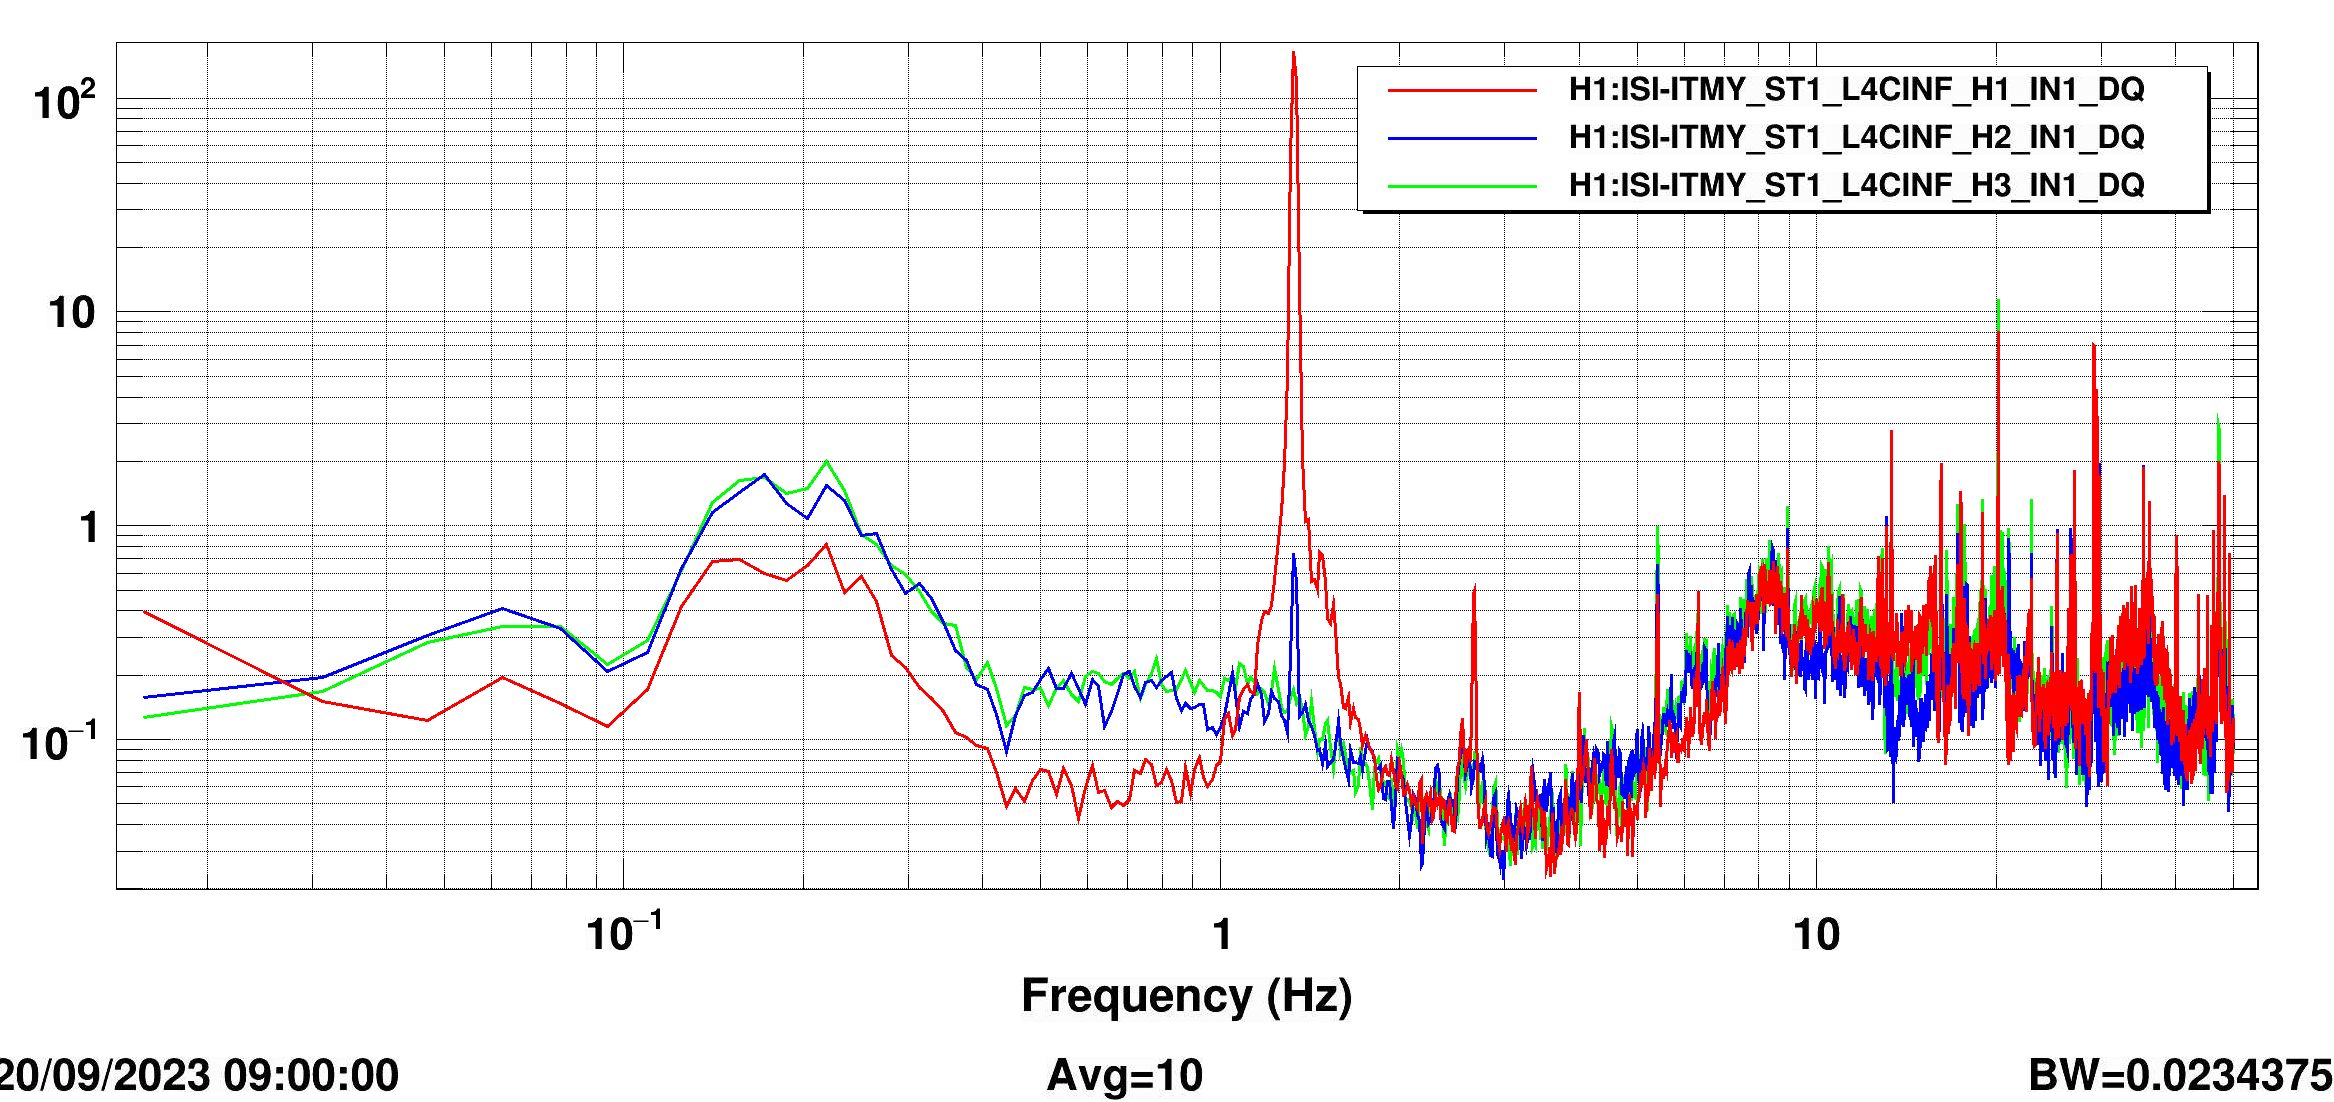
Fourth asd plot shows the peak shows up the most in the H1 L4C, less visible in the other L4Cs.
Last tf plot shows the local CPS to T240 tfs. Peak is equally visible in all these sensor pairs, transfer functions all look generally the same.
Probably the best shot for fixing this at the moment is switching to blends that don't used the H1 L4C, but the peak needs to be visible to test that and it hasn't been cooperating so far today. The channel H1:ISI-ITMY_ST1_FFB_LOG_Y_1_3 has been the easiest to trend witness so far, peak is active when that channel hits ~1.


Attaching a dtt measurement to show the peak is visible in the St2 gs13s, is coherent with DARM and CHARD P, and lines up with peaks in both.
