ryan.crouch@LIGO.ORG - posted 16:03, Friday 06 October 2023 (73275)
Inlock and OPLEV charge comparison with Kappa trend
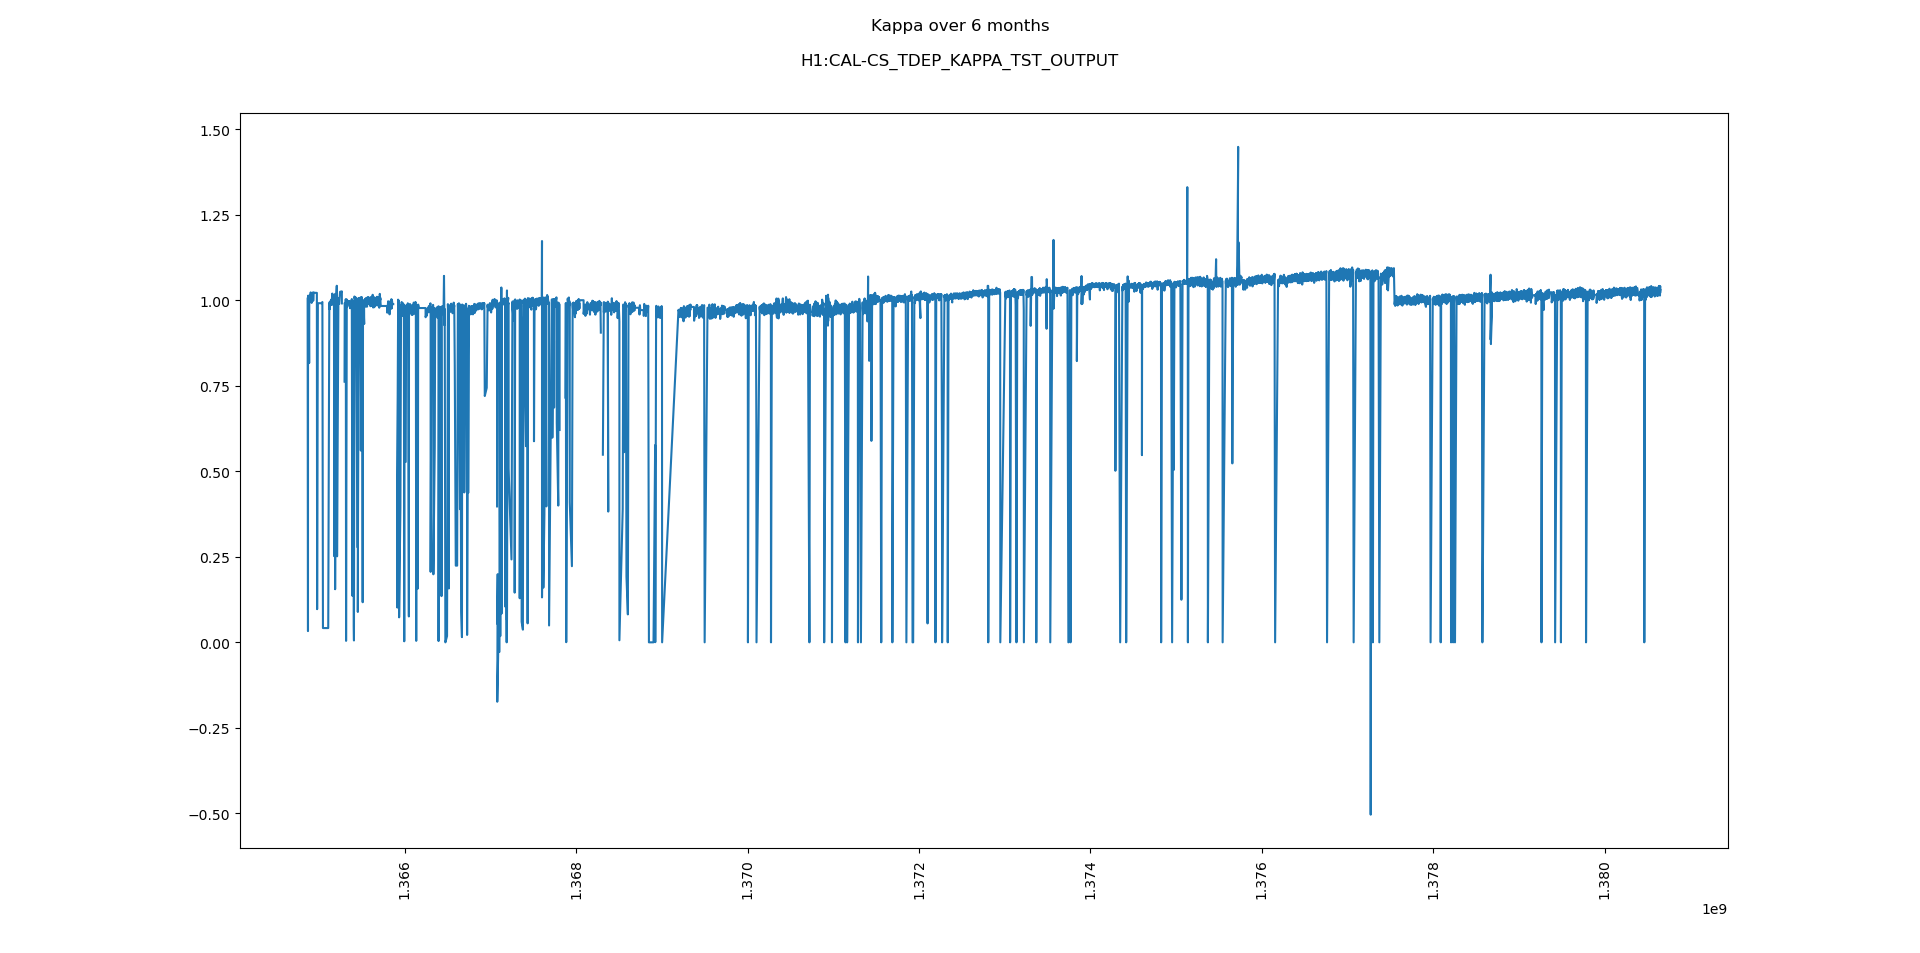
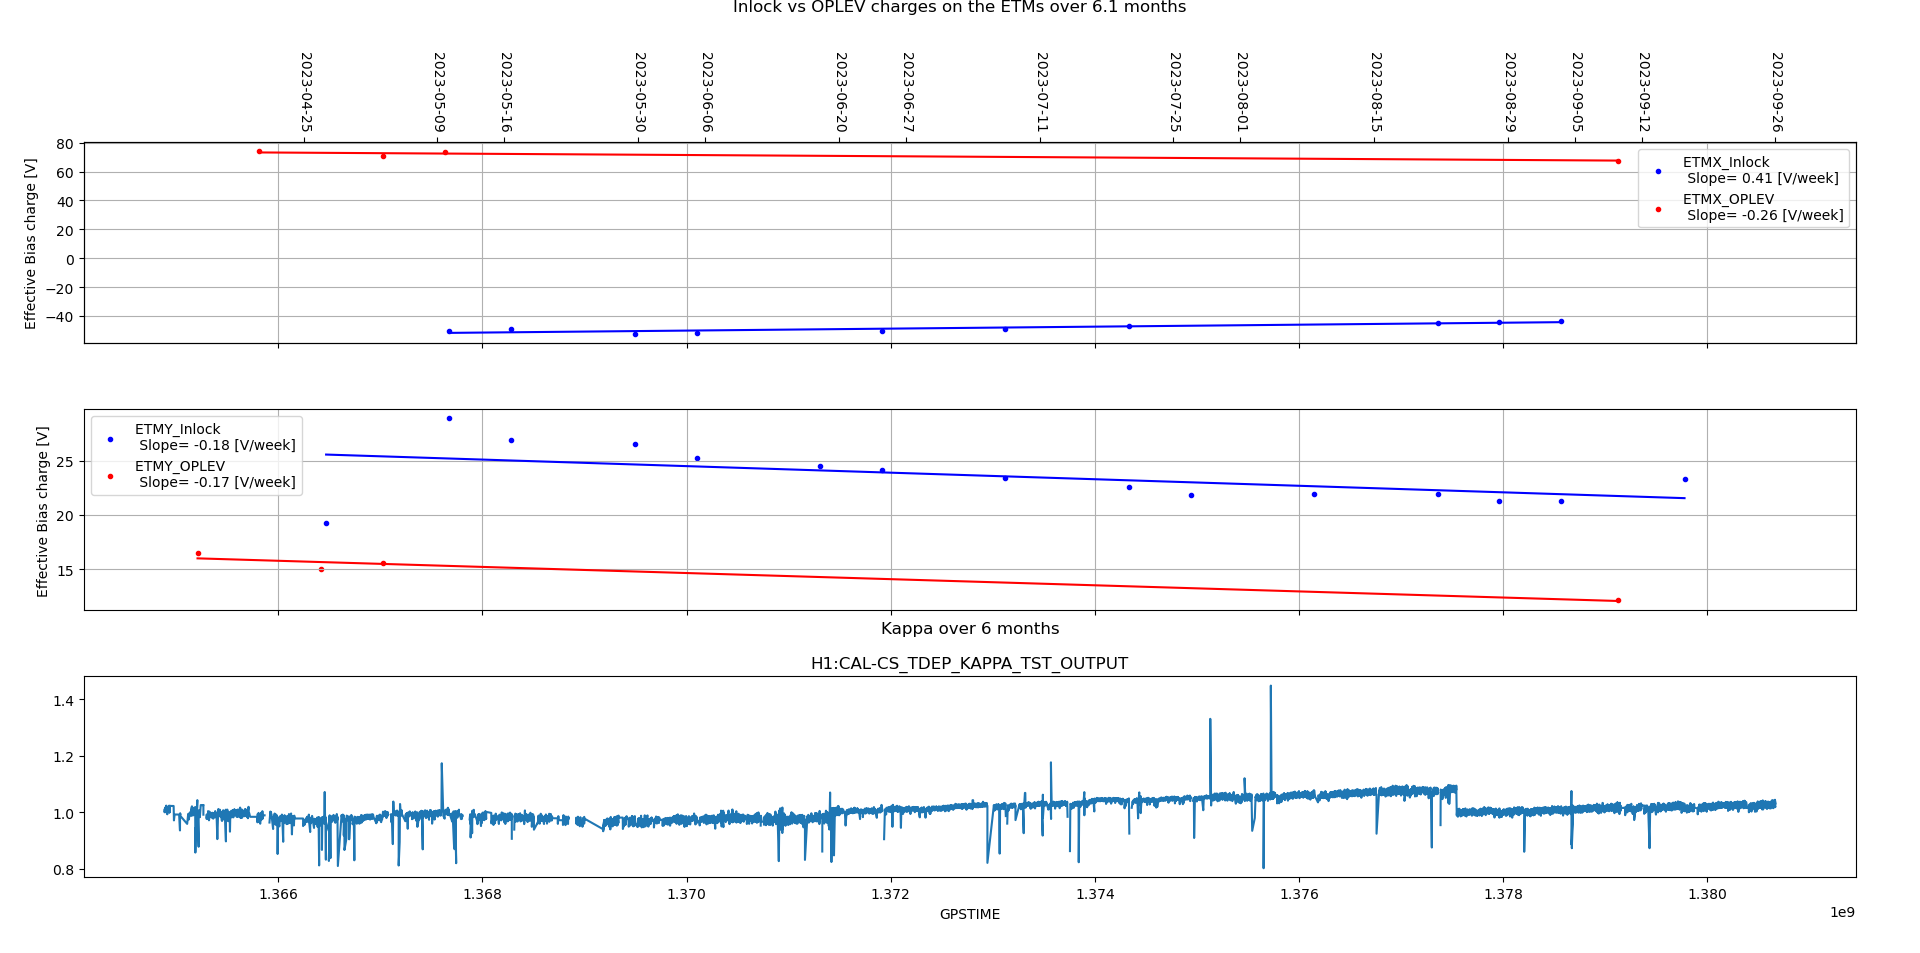
I've made a few updates to my script that graphs the Inlock and OPLEV charges and I've run the code with the latest measurements and included a same time scale (6 months) minute trend of Kappa TST (H1:CAL-CS_TDEP_KAPPA_TST_OUTPUT) that I've scaled the Y-axis a bit for better readability. The codes located at /ligo/home/ryan.crouch/Desktop/Charge_measurements/compare.py and you need to be in the nds2utils environment to run it (conda activate nds2utils). I've also included a solo unmodified Kappa trend.
| Test Mass | Inlock slope | Oplev slope |
| ETMY | -0.18 [V/week] | -0.17 [V/week] |
| ETMX | +0.41 [V/week] | -0.26 [V/week] |
The ETMY charge values seem to be trending down towards zero. The ETMX charge values seem to be converging towards zero as well now (yay?). Kappa_TST appears to be slowly increasing, or slowly decaying with a sign flip.
Images attached to this report