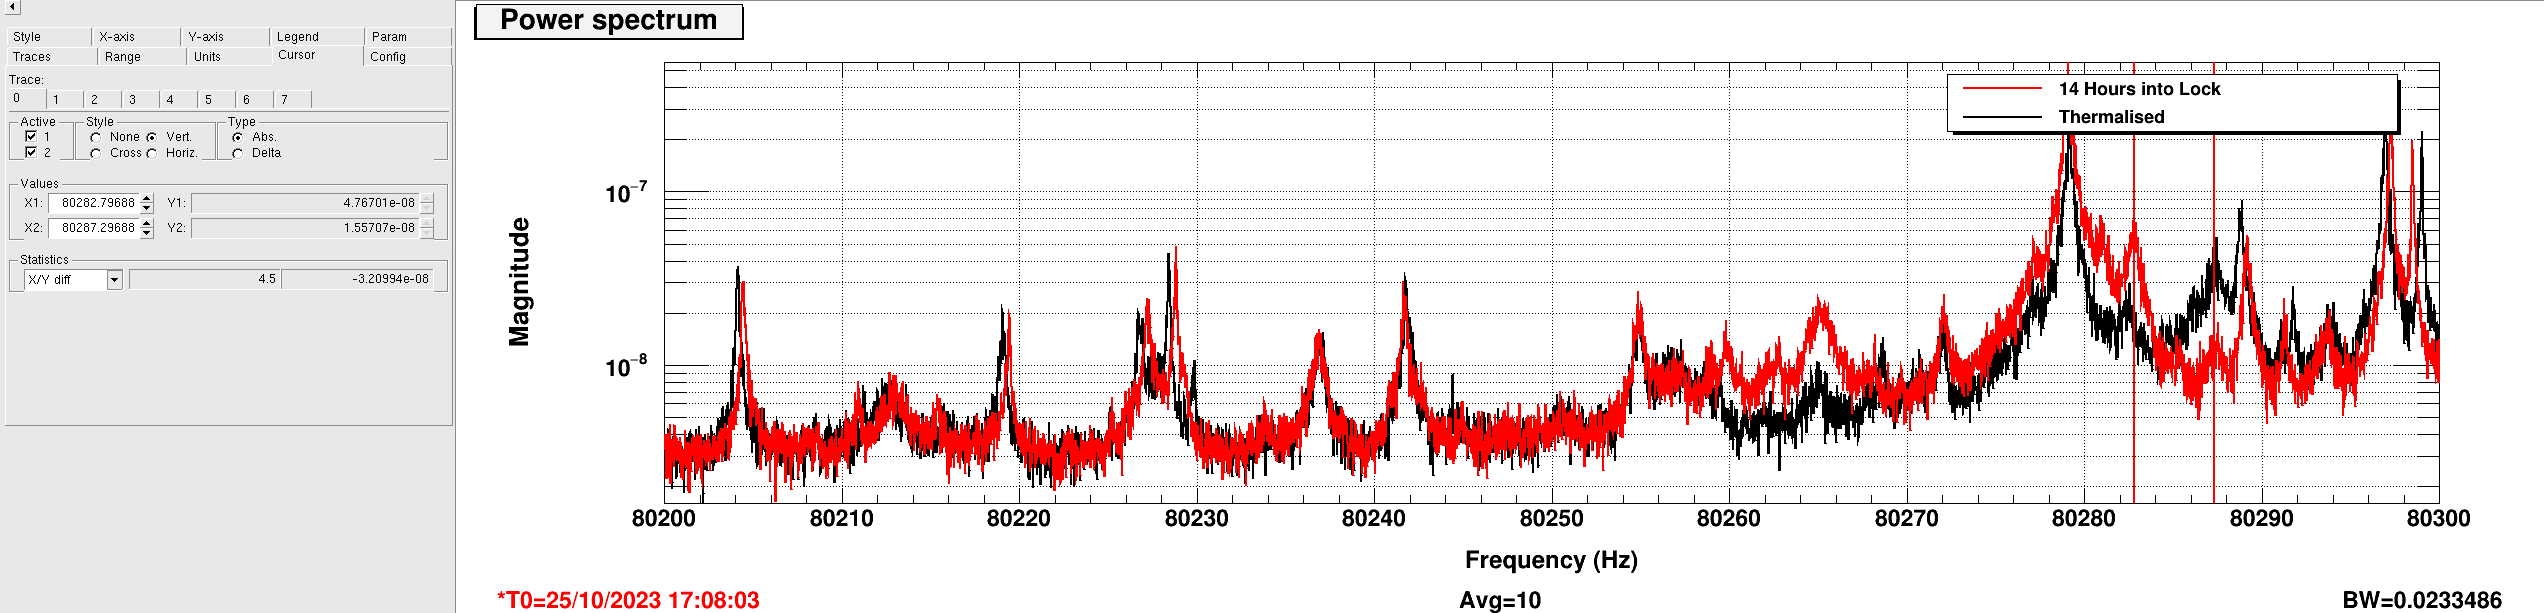
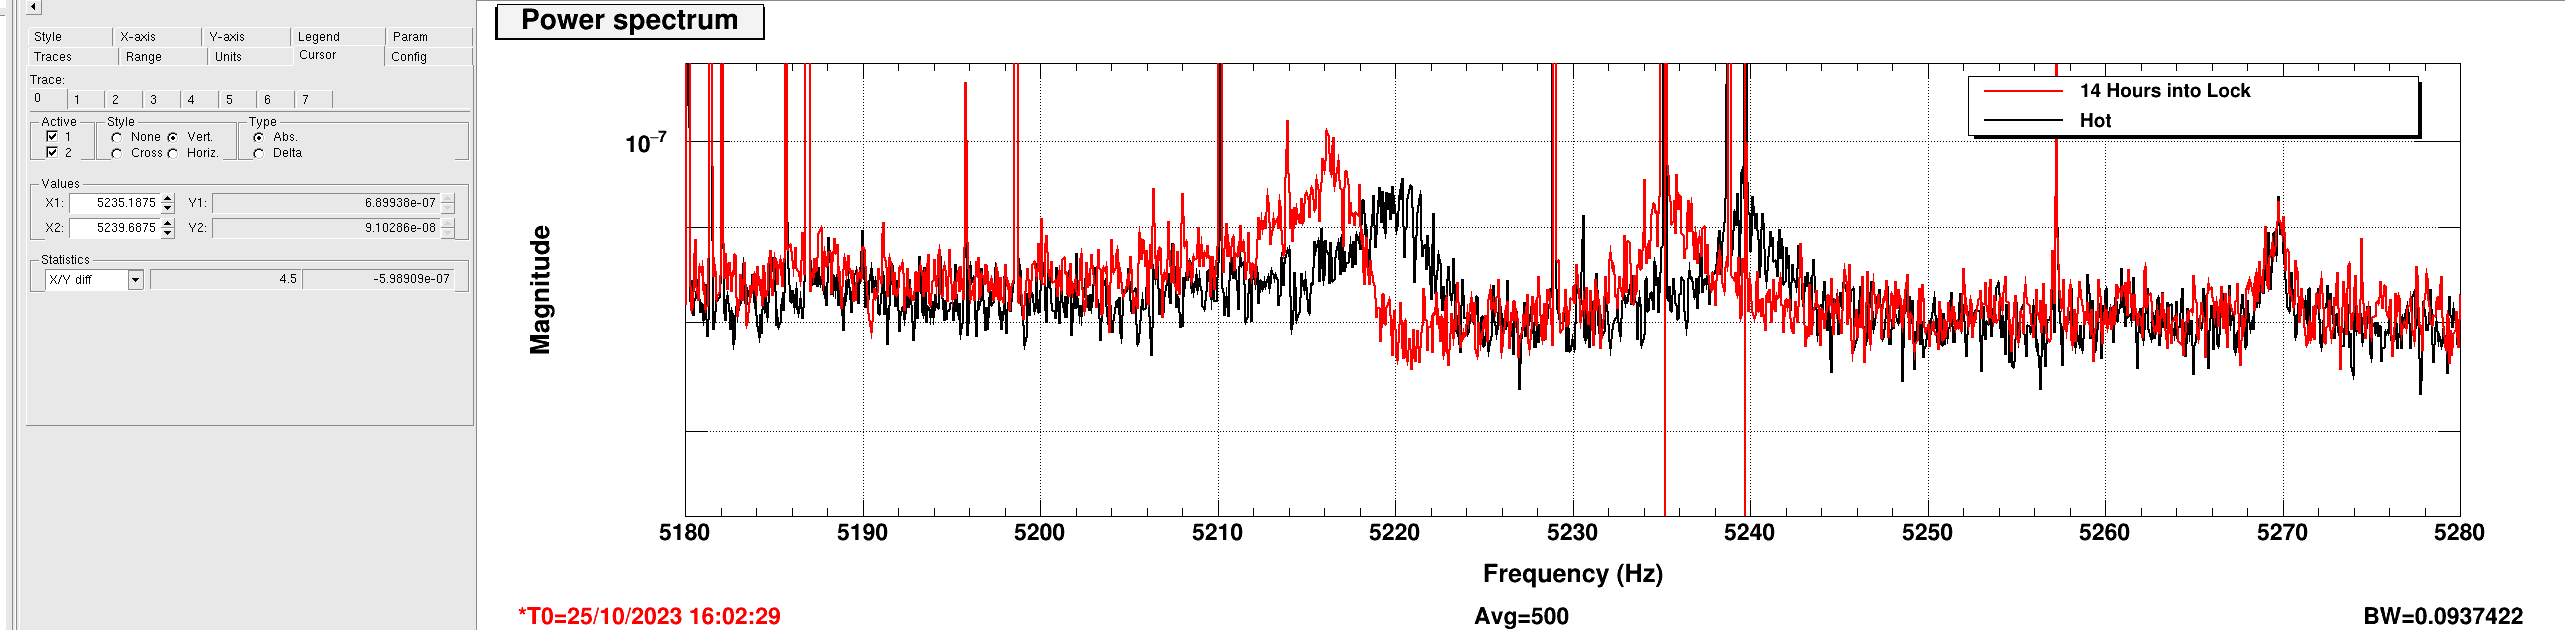
I measured the optical modes moving in the OMC-DCPD-SUM signal where, with A LOT of averaging (when the optical modes are pseudo stable), the optical high order mode (HOM) spacing can be observed as its changing through a lock stretch.
I look at the spectrum visible in the 5.2kHz range; and the spectrum visible in the 80.3 kHz range.
There are 2 sets of optical modes easily visible. Currently I assume the one I need to worry about is the higher one that is substantially closer to 80297 kHz of the PI.
The 2 two times plotted correspond to:
- [Red] 14 Hours locking as of end of Tuesday Maintenance
- [Black] 28 locking as of the end of the lock just before Tuesday Maintenance
This should, in principle, correspond to 2*FSRx + HOM_spacing, but there is a slight discrepancy at both LLO and LHO (roughly 4 Hz by my estimates), which may be related to the small Gouy phase impact of the PRC, but I'm not sure exactly how.
For these measurements, the difference in frequency is 75047.61 Hz
For completeness, 2*FSRx = 75051.87 Hz (X-arm length is 3994.4704 m)
This is relevant to being able to track how far away we are in terms of optical mode spacing, from the mechanical mode Frequency in a DQ channel for post processing.