artem.basalaev@LIGO.ORG - posted 16:26, Monday 20 November 2023 - last comment - 10:20, Tuesday 28 November 2023(74315)
Projection of ESD quadratic noise
Artem, Gabriele, Sheila, Louis Plots and Jupyter notebook with these results are also available here.ESD quadratic noise
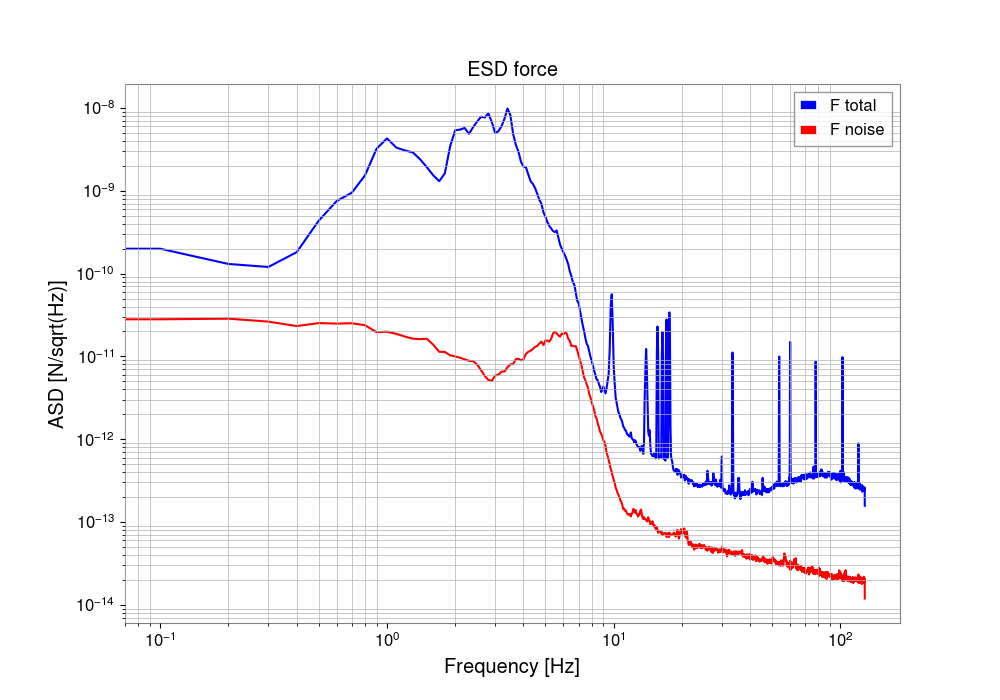
This is a follow up on investigation of potential non-stationary noise at Handford introduced by the ESD drive, reported in 73913 and previous entries linked from there. The idea is that from the ESD signal, Vs, and bias, Vb, voltages we can reconstruct ESD force applied to the mirror, using equations in LIGO-T1700446. The force component linear in Vs gets subtracted by the control loop and therefore does not affect DARM. But the force component quadratic in Vb and both linear and quadratic in Vb can couple to DARM. Therefore in this report, we are calculating respective force components and projecting them to DARM. Then respective ASDs and spectrograms are compared.Selection of input channels
The ESD drive voltages are recorded by Monitors, H1:SUS-ETMX_L3_LVESDAMON_LL_OUT_DQ for Vs and H1:SUS-ETMX_L3_ESDAMON_DC_OUT_DQ for Vb. Important note here: we initially tried channel H1:SUS-ETMX_L3_ESDAMON_UL_OUT_DQ to get Vb, but it looks like it's not connected to anything and recording ASD noise... The H1:SUS-ETMX_L3_ESDAMON_DC_OUT_DQ seems to be fine. Also, LIGO-T1700446 specifies calibrations for voltage channels (equations 13 and 16), but currently the channels mentioned above are already calibrated to voltage.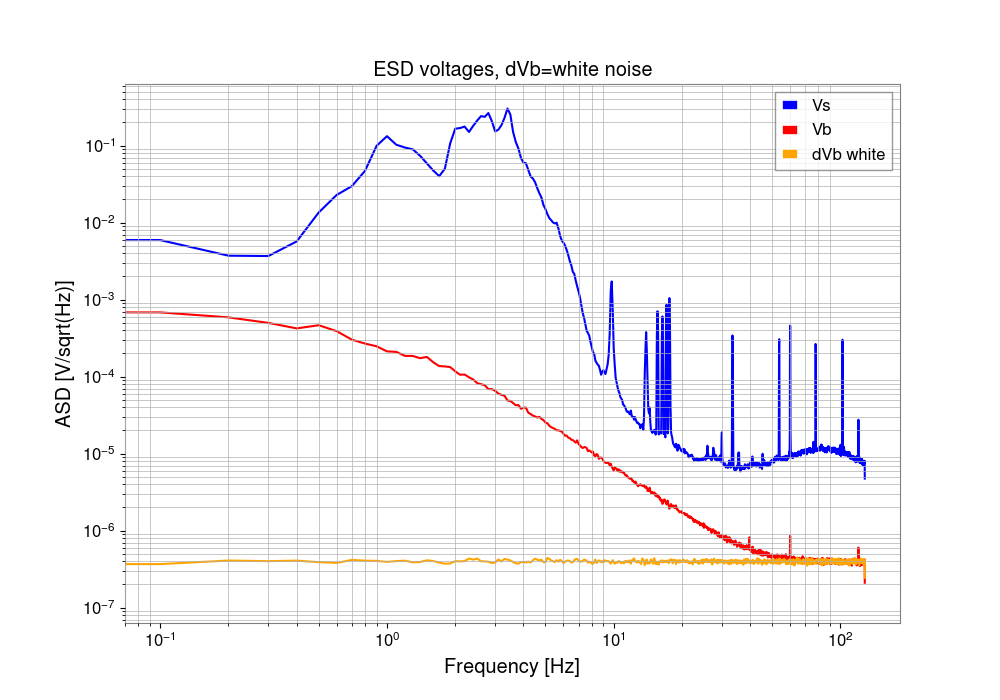
Calculating force terms
Calculation is based on equation 3 in LIGO-T1700446, but this equation is modified in the following way:
- Bias voltage is decomposed into DC and varying part, to avoid propagating DC term through the calculation (DC term will not affect DARM). So the following substitution is applied: Vb = Vb_DC + dVb. The term Vb_DC is simply median of Vb time series, and dVb is Vb time series with median subtracted
- Brackets are then opened to gather all the terms linear in Vs, quadratic in Vs, linear in dVb, quadratic in dVb, and mixed dVb*Vs term. Noise term is then quadratic in Vs + linear and quadratic in dVb + mixed dVb*Vs
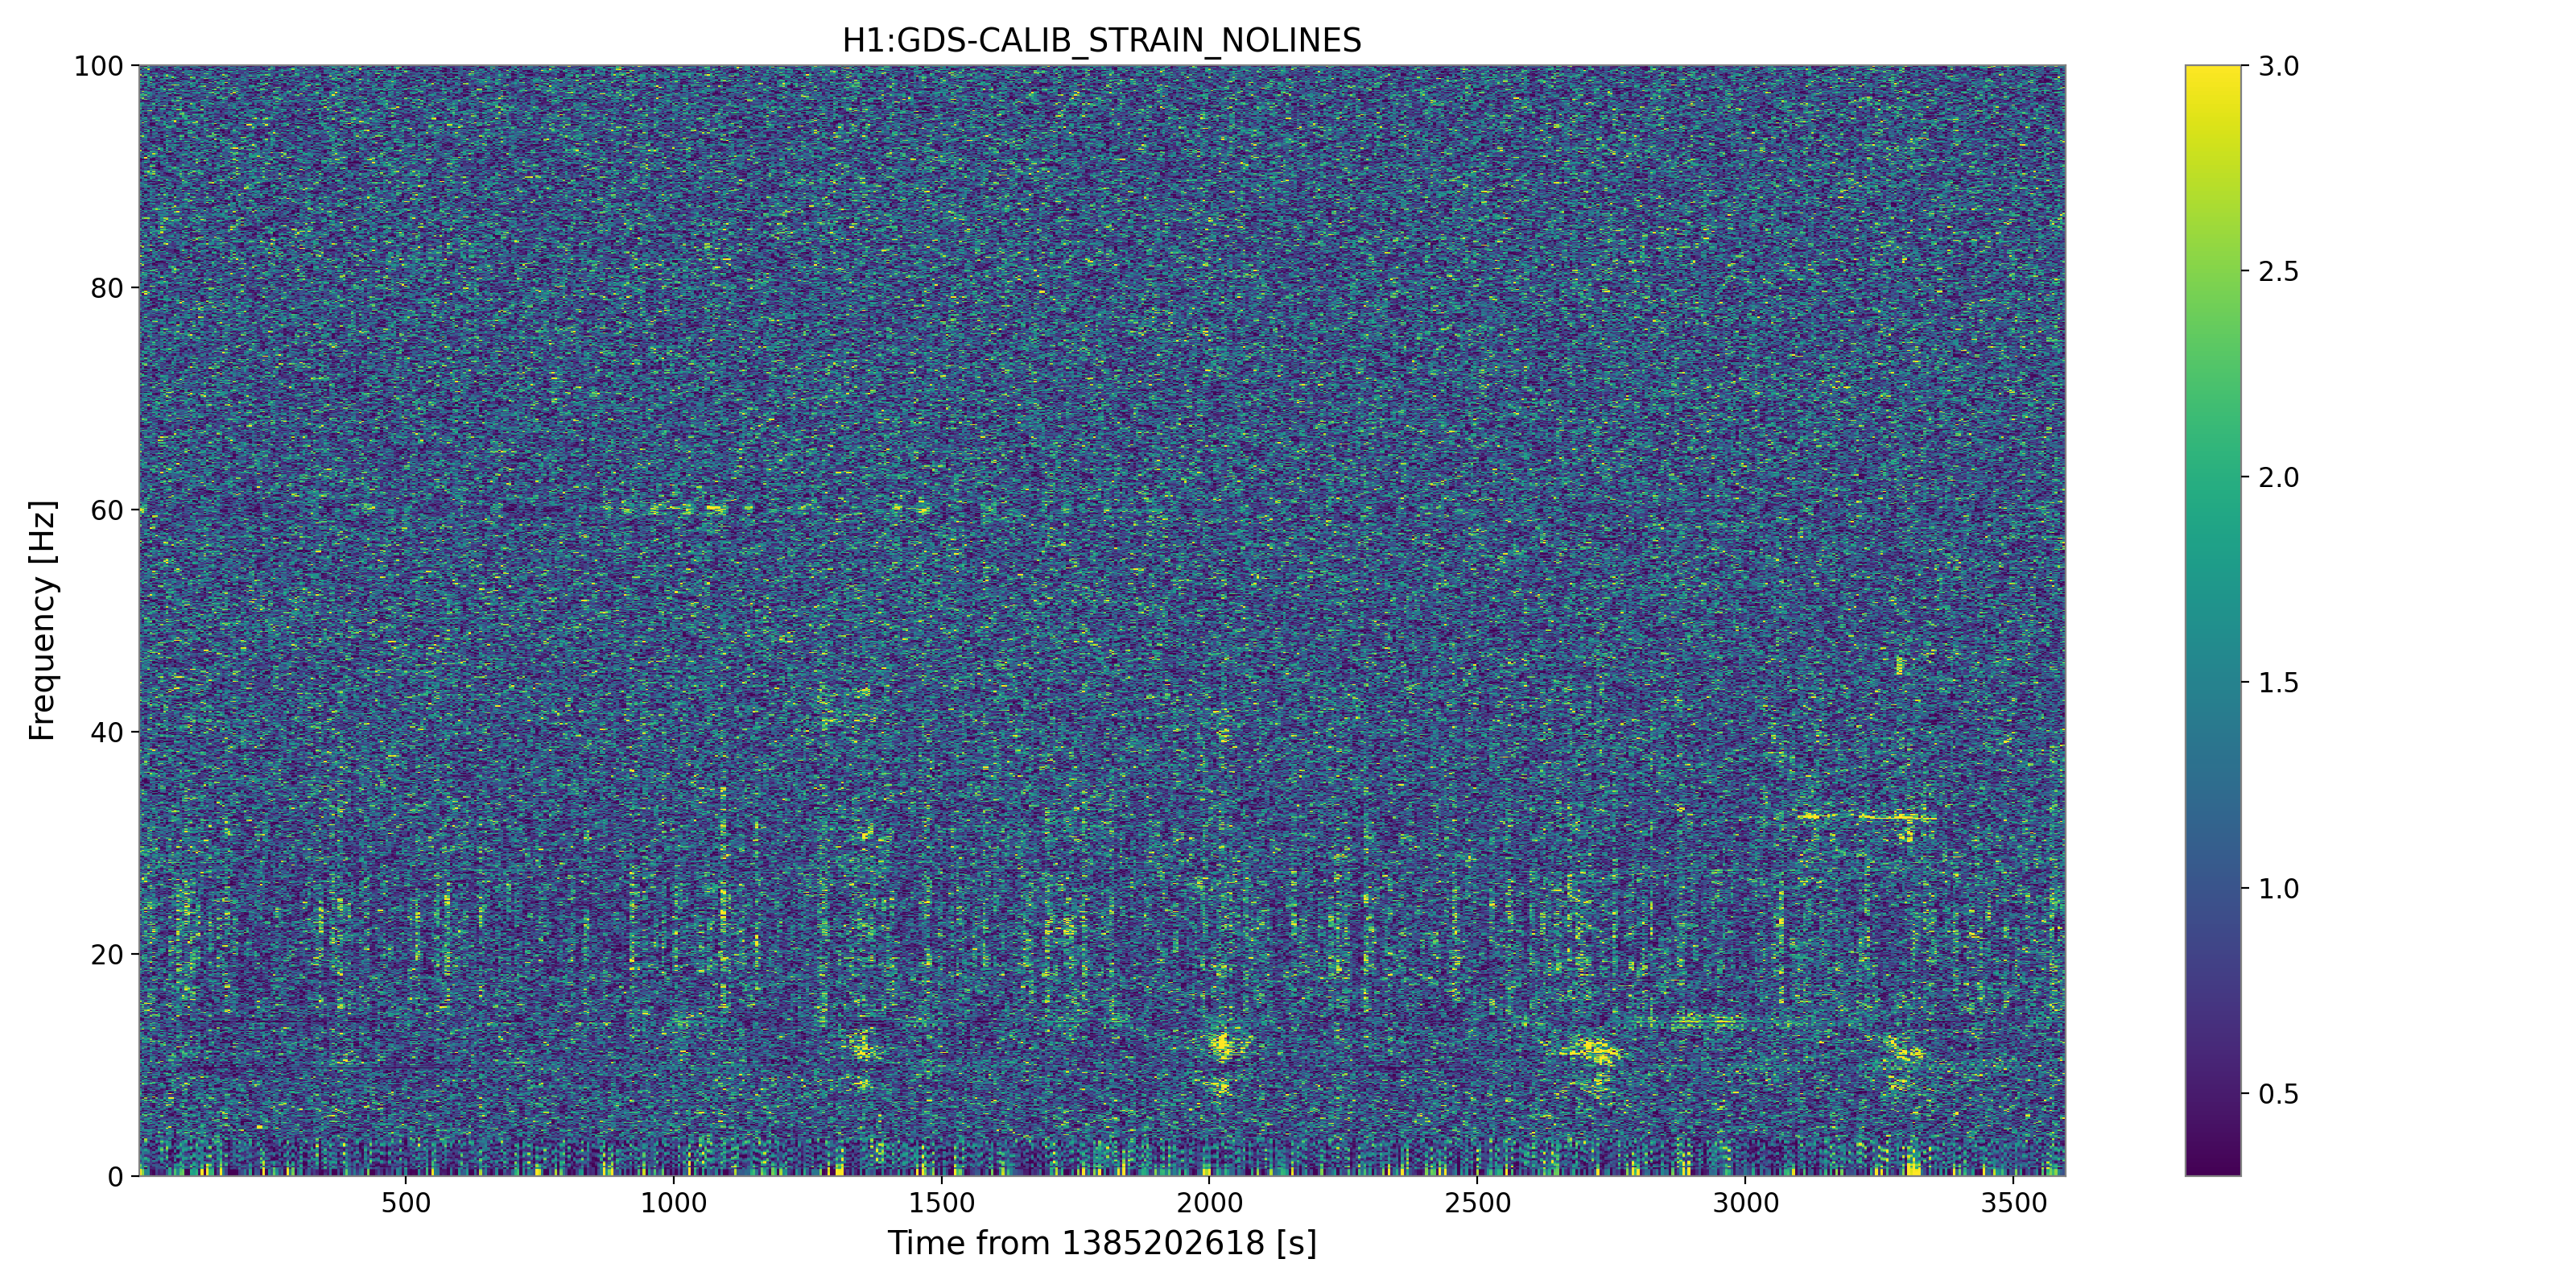
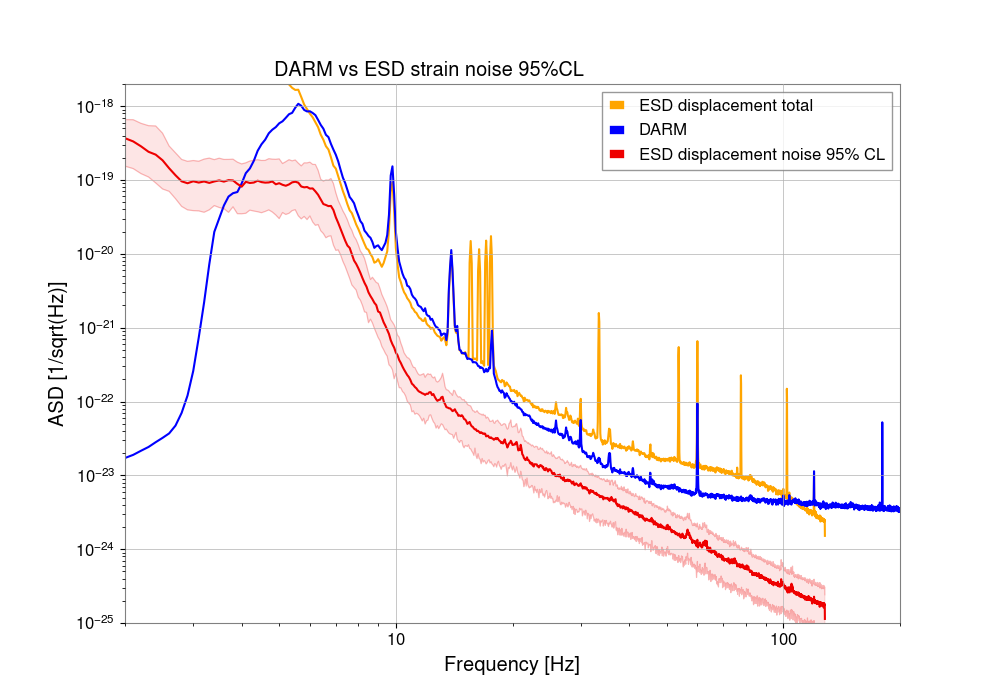
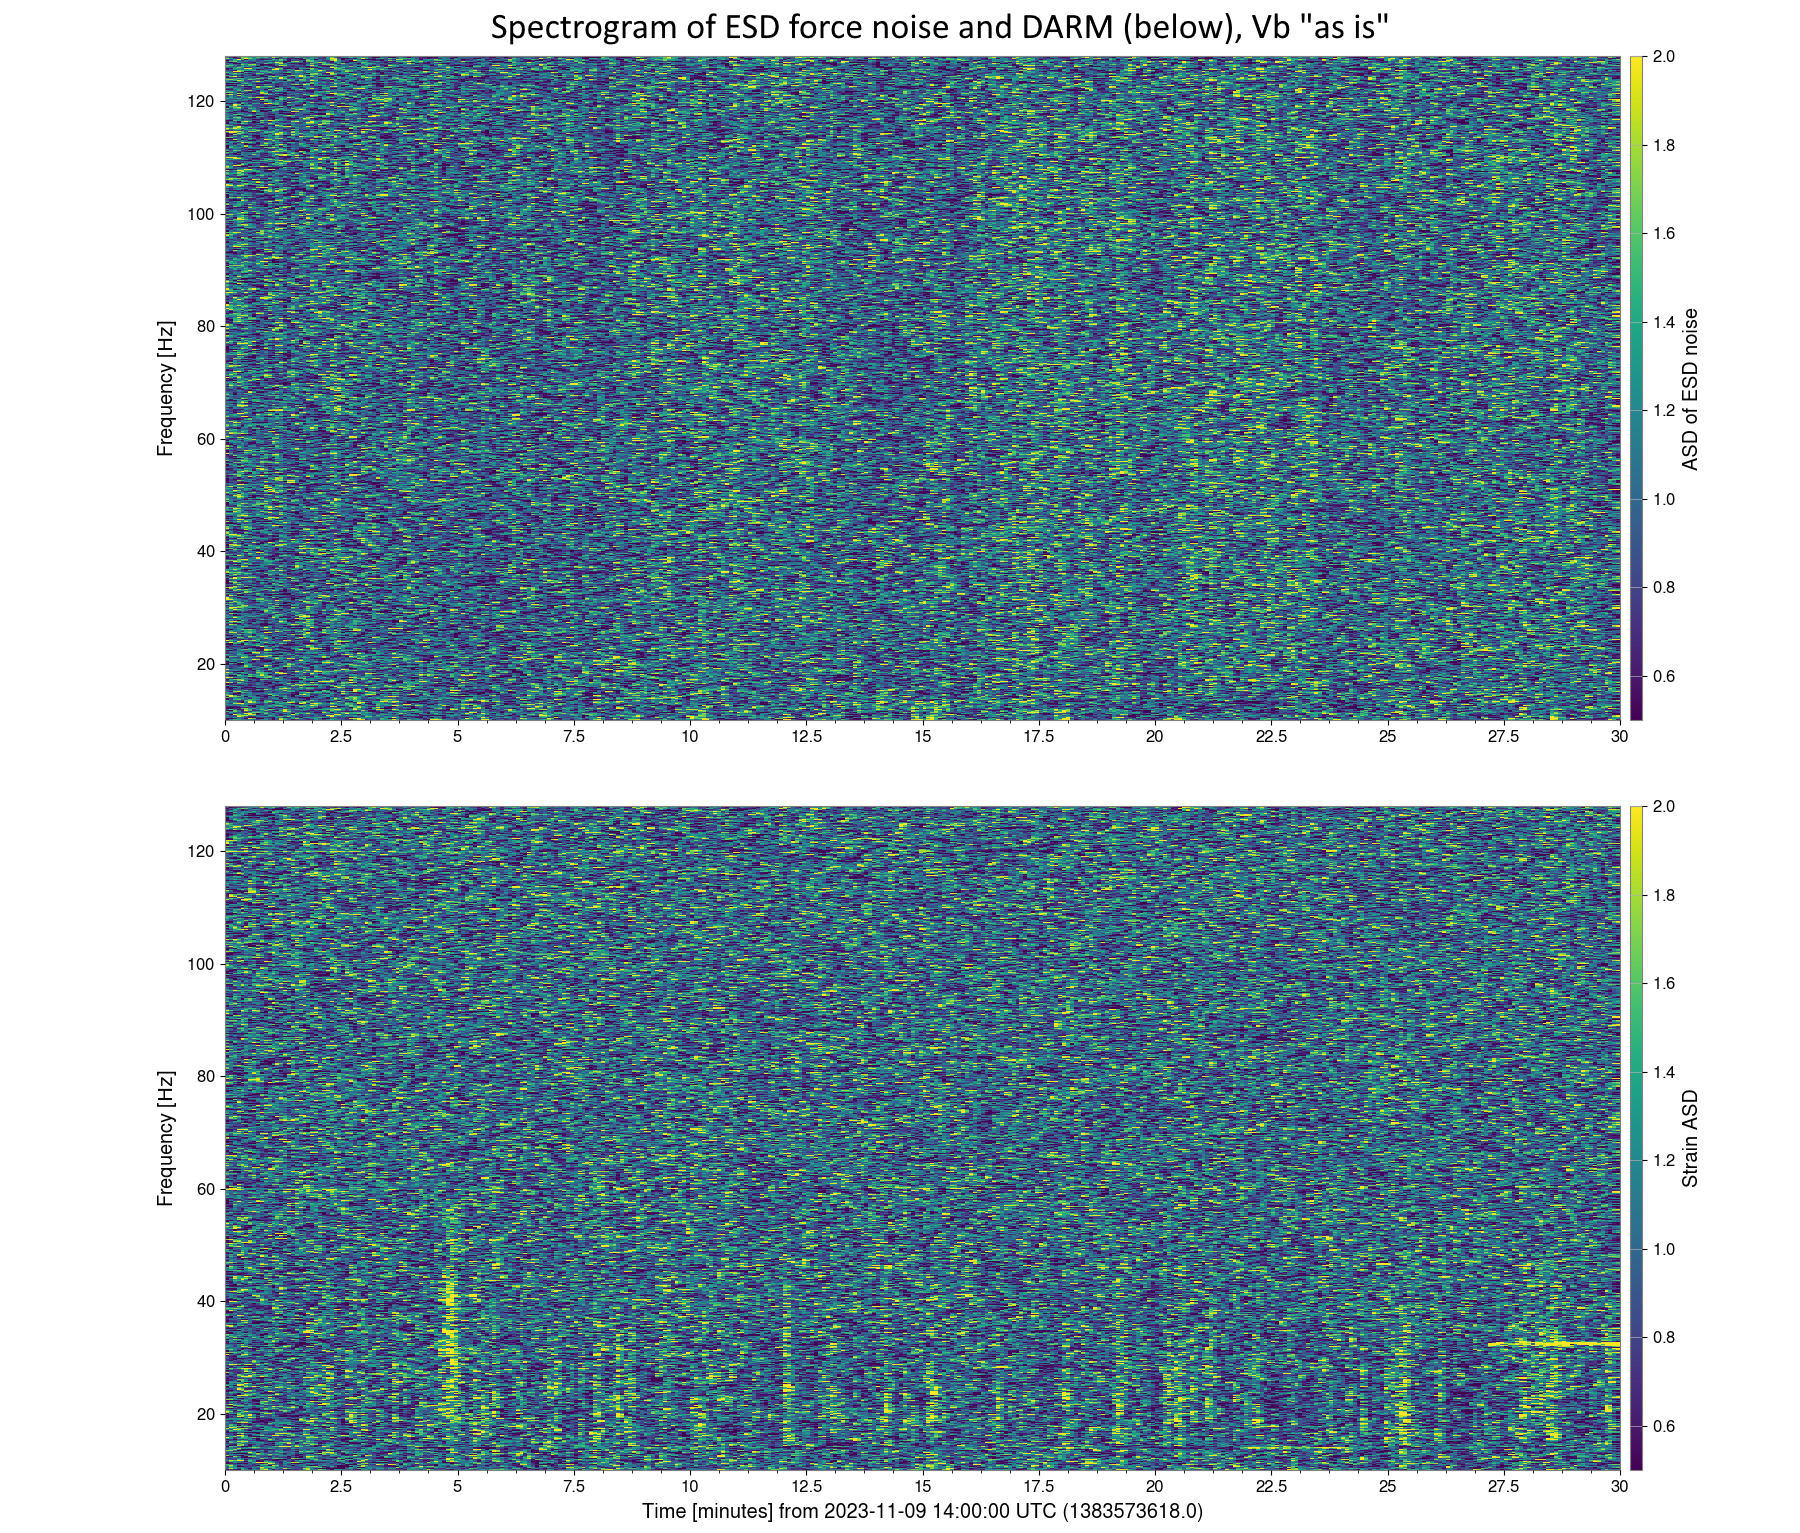
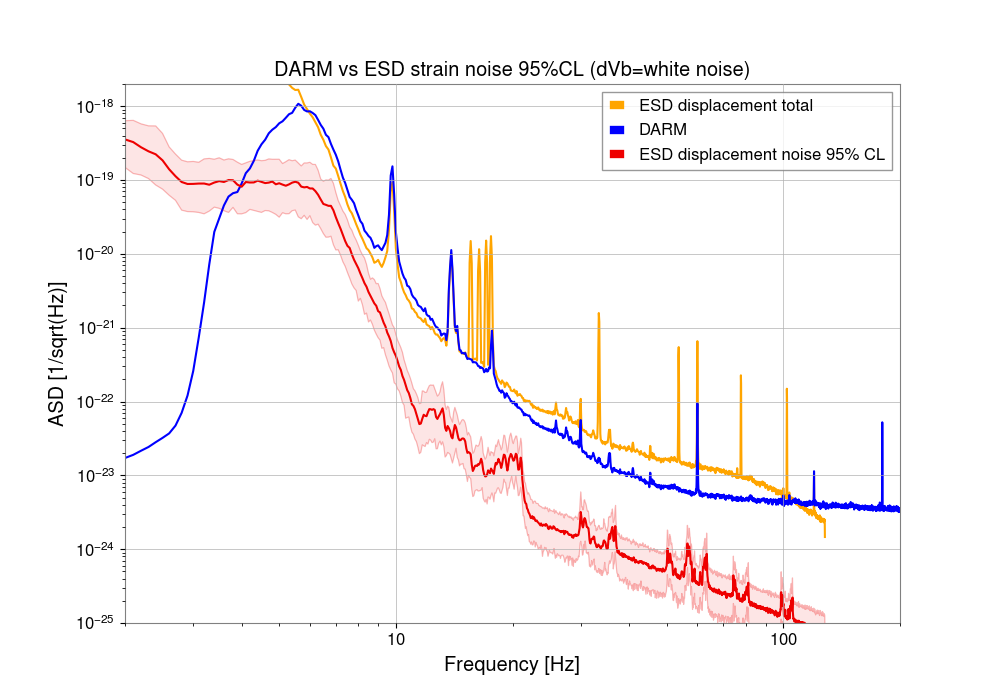
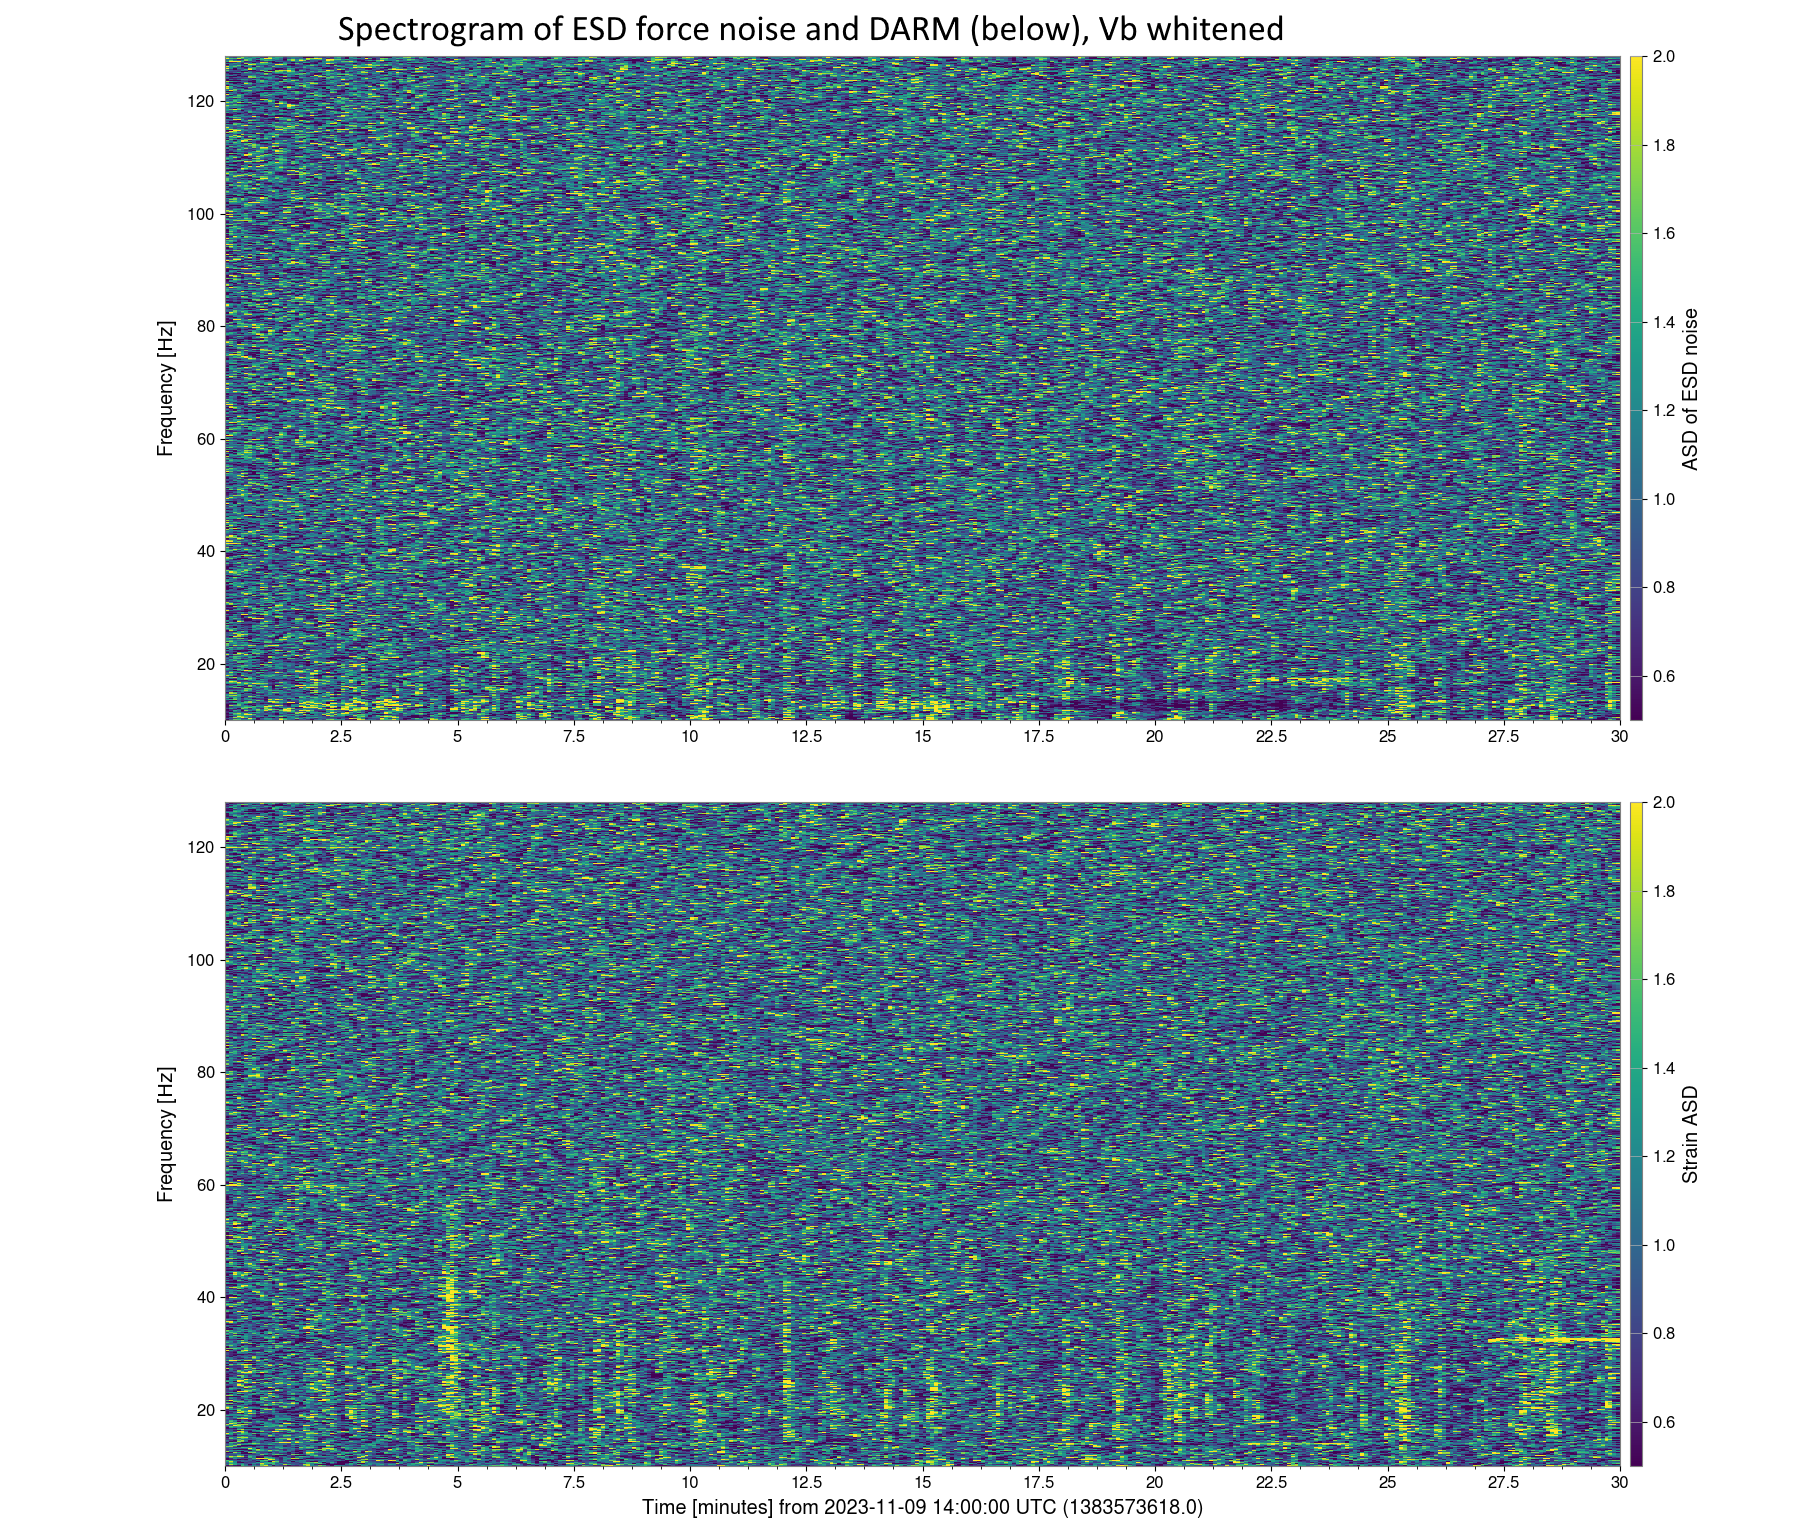
Results: 95%CL ASD and spectrograms for ESD noise converted to equivalent strain
- Force is converted to acceleration by dividing by the mirror mass (40 kg).
- Subsequently acceleration is divided by omega^2 to convert to displacement.
- Finally displacement is converted to equivalent strain by dividing by arm length (4 km). Now the spectrum can be compared to DARM channel.
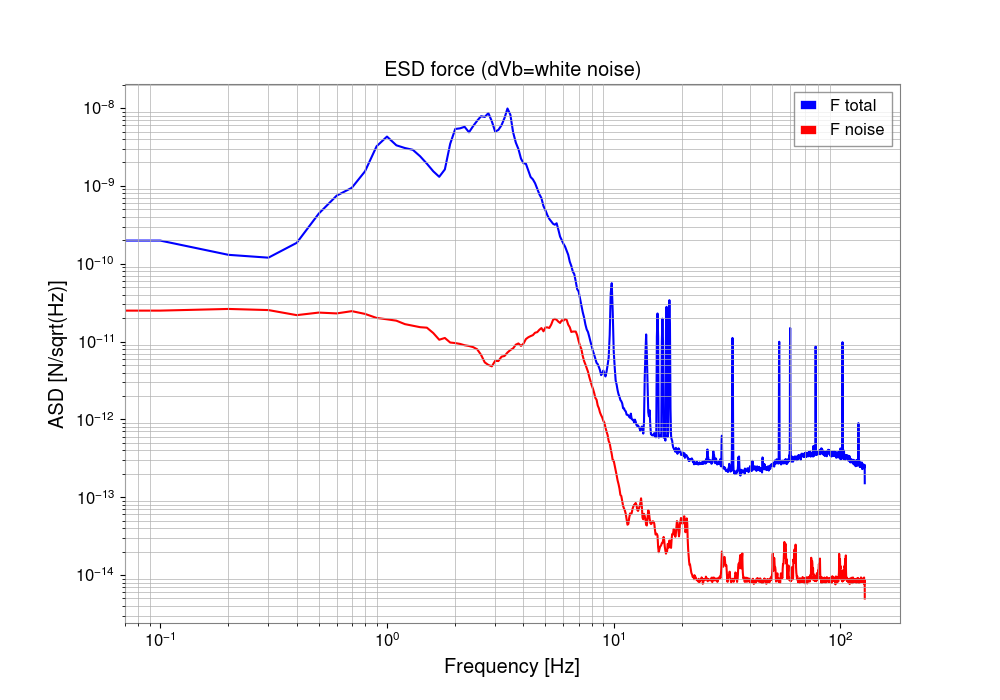
Replacing Vb with white noise at typical level, to avoid projecting Monitor's ADC noise
Gabriele made a plot showing ASD of Vb for different levels of bias and when the bias is off. What we can see is a shoulder of additional noise which we believe is coming from ADC of the monitor. To get rid of that, we generate white noise time series for dVb at the level of Vb where it is not dominated by additional noise. The new dVb term is then plugged into the equation for the force term and a new set of plots is produced.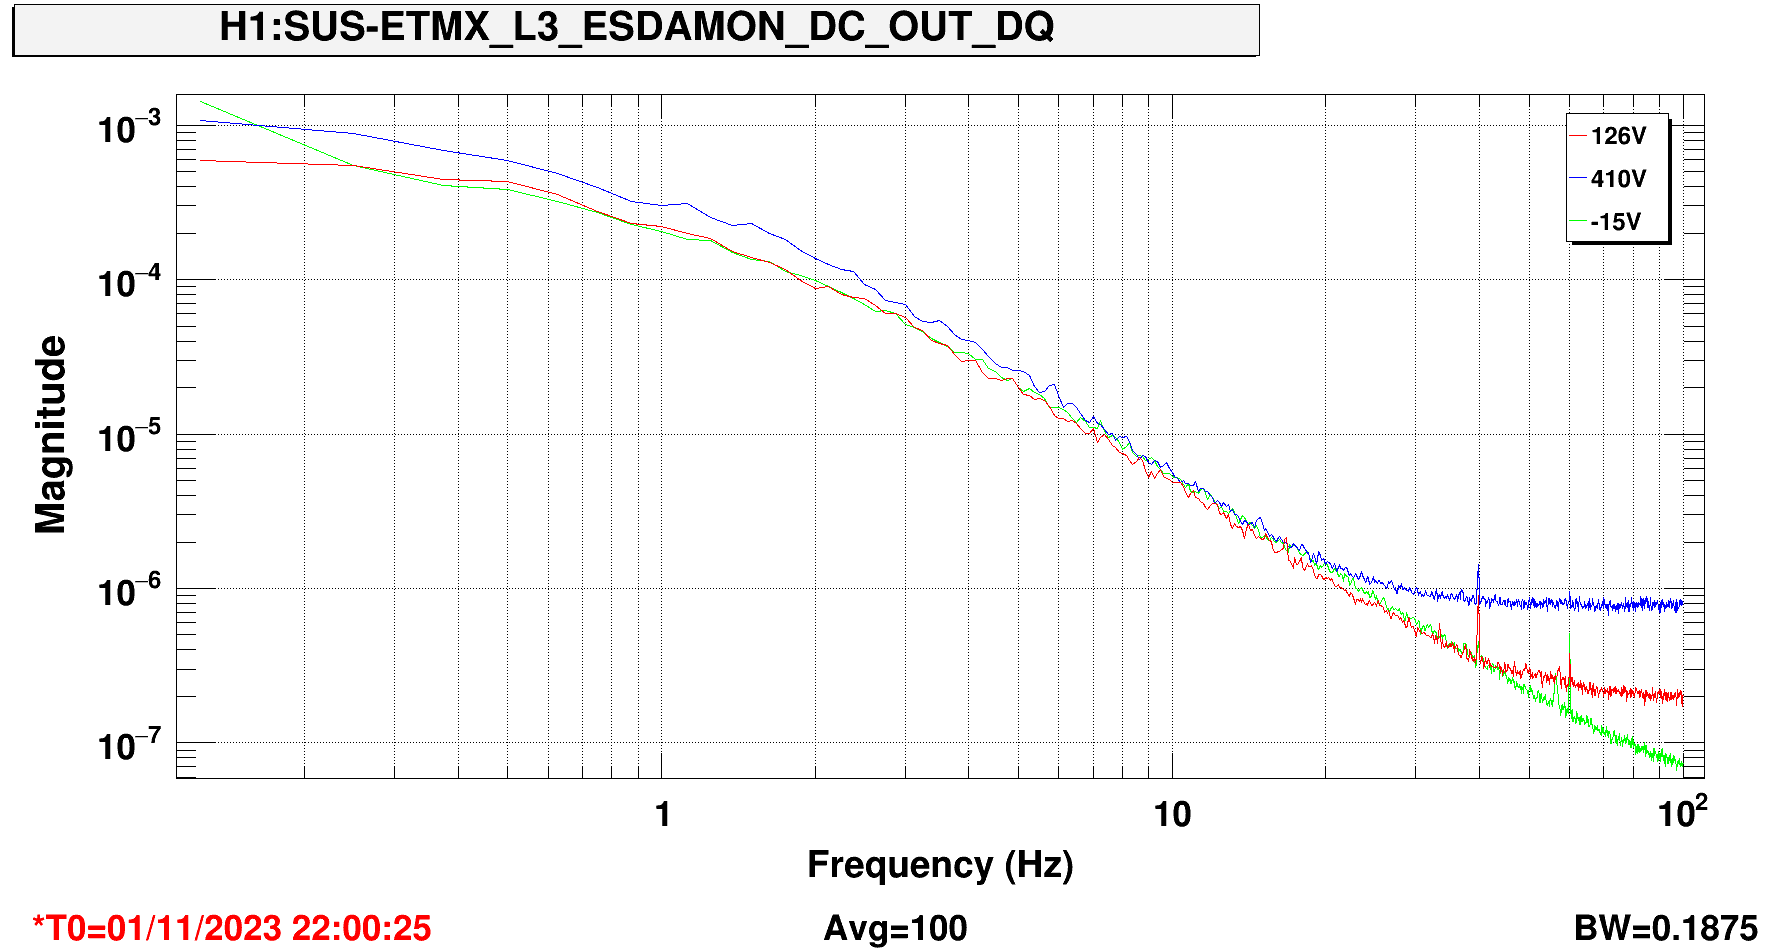
Results: 95%CL ASD and spectrograms for ESD noise converted to equivalent strain (dVb replaced with white noise - see above)
Images attached to this report
Comments related to this report
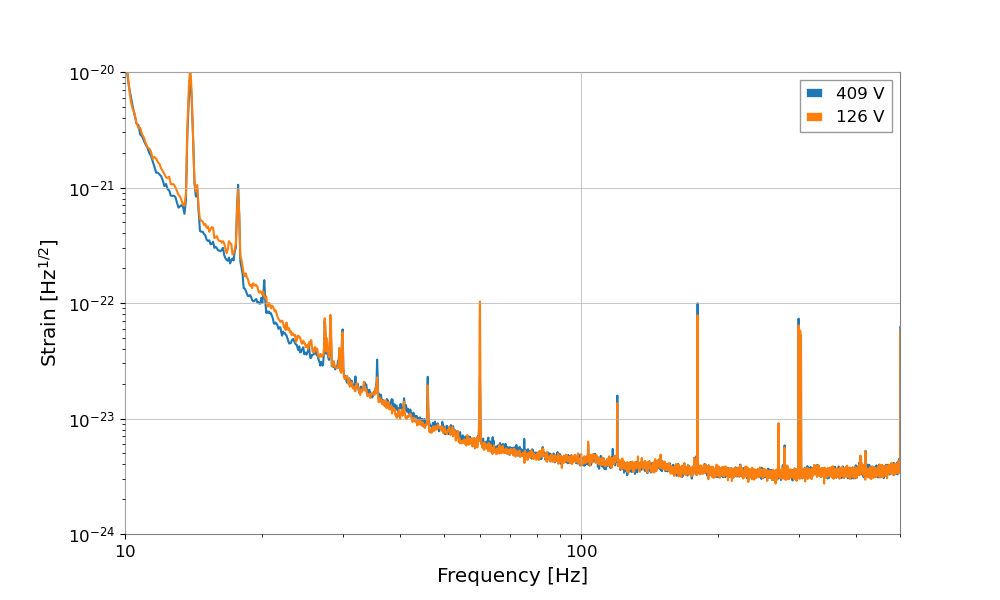
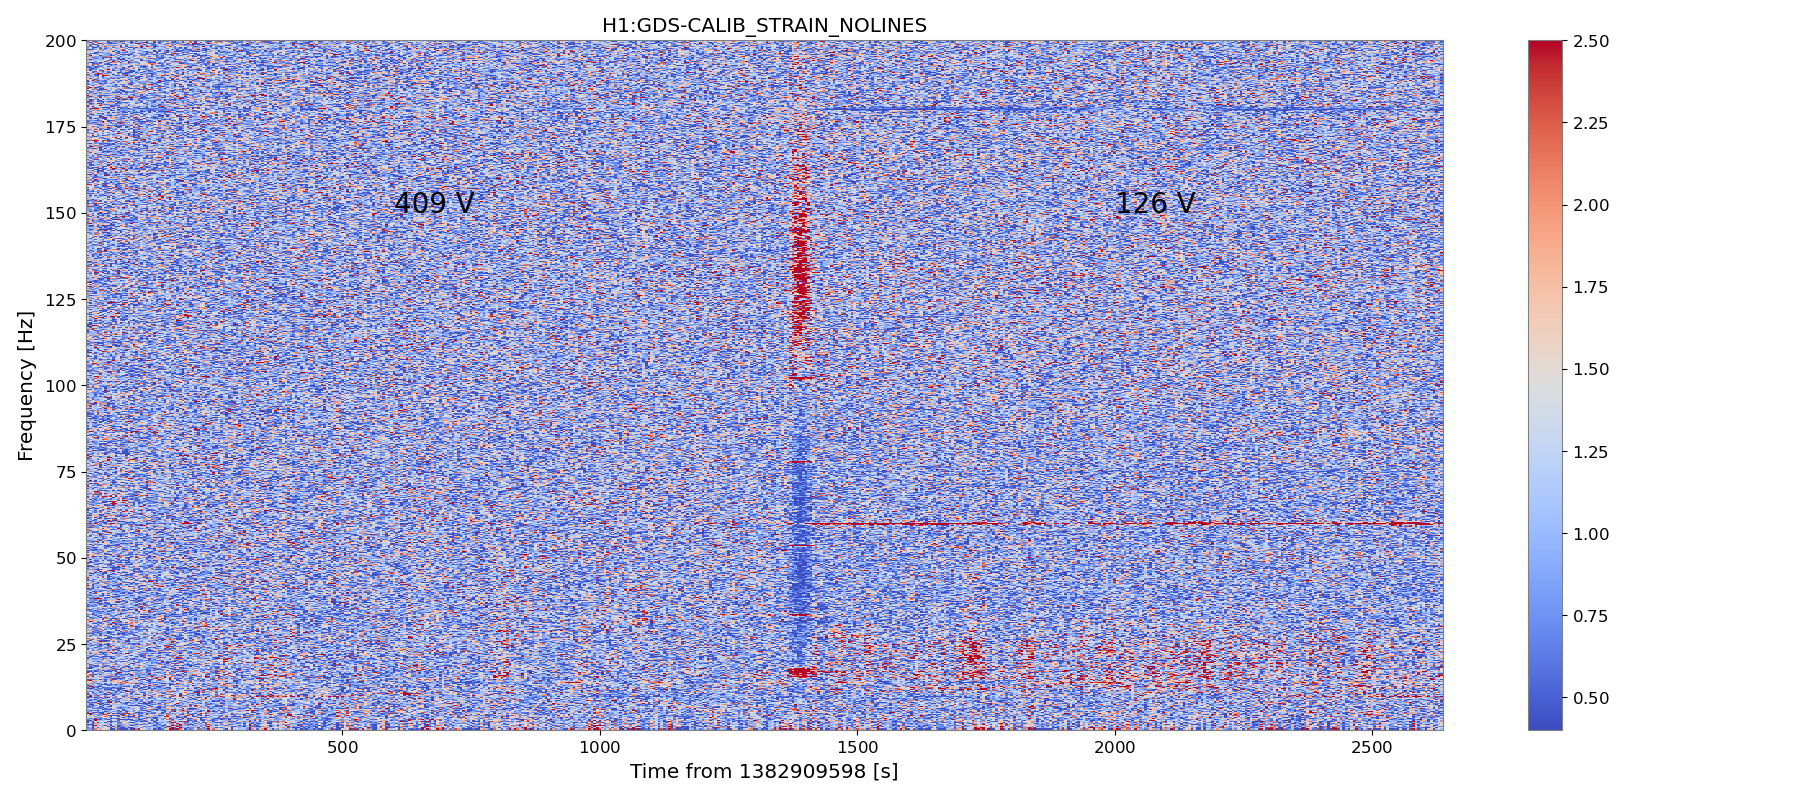
I did the same exercise but now for GPS time 1382909598 (and up to +22 mins from it), where bias voltage was set at 409V. Below you find plots where you can see that noise went up* (ASD) but apparent non-stationarity is reduced (spectrograms), which is consistent with Gabriele's findings in comment in 73935, specifically this and this plots.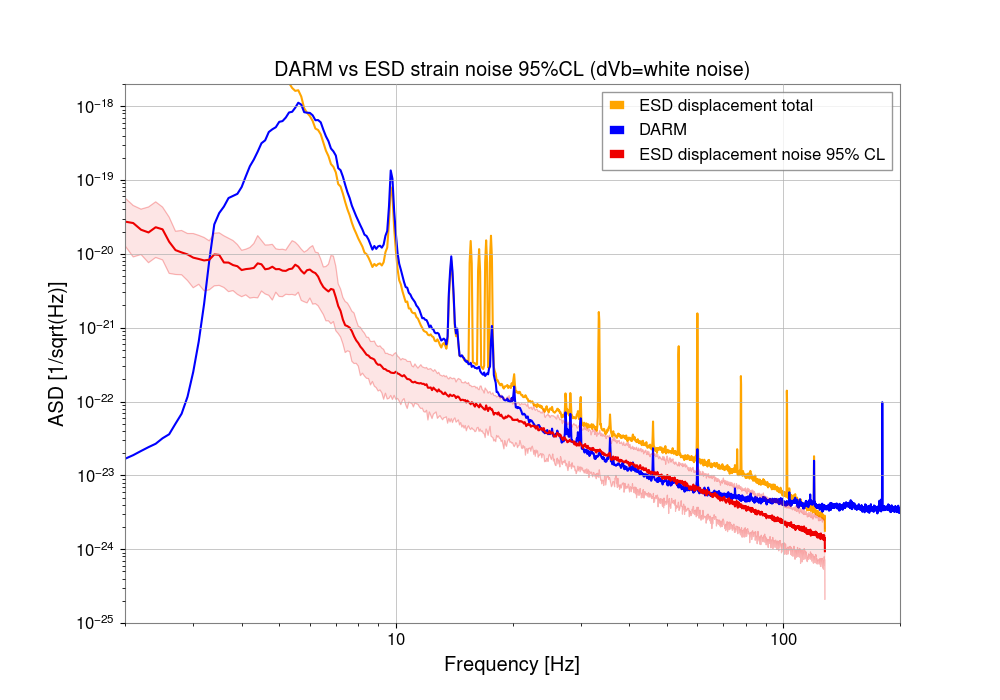
* Currently noise ASD is actually higher than DARM, this is not realistic but the modelling is not 100% precise. What is important here is relative changes with respect to results with "standard" level of bias voltage. Plots and Jupyter notebook with these results are also available here.
Images attached to this comment
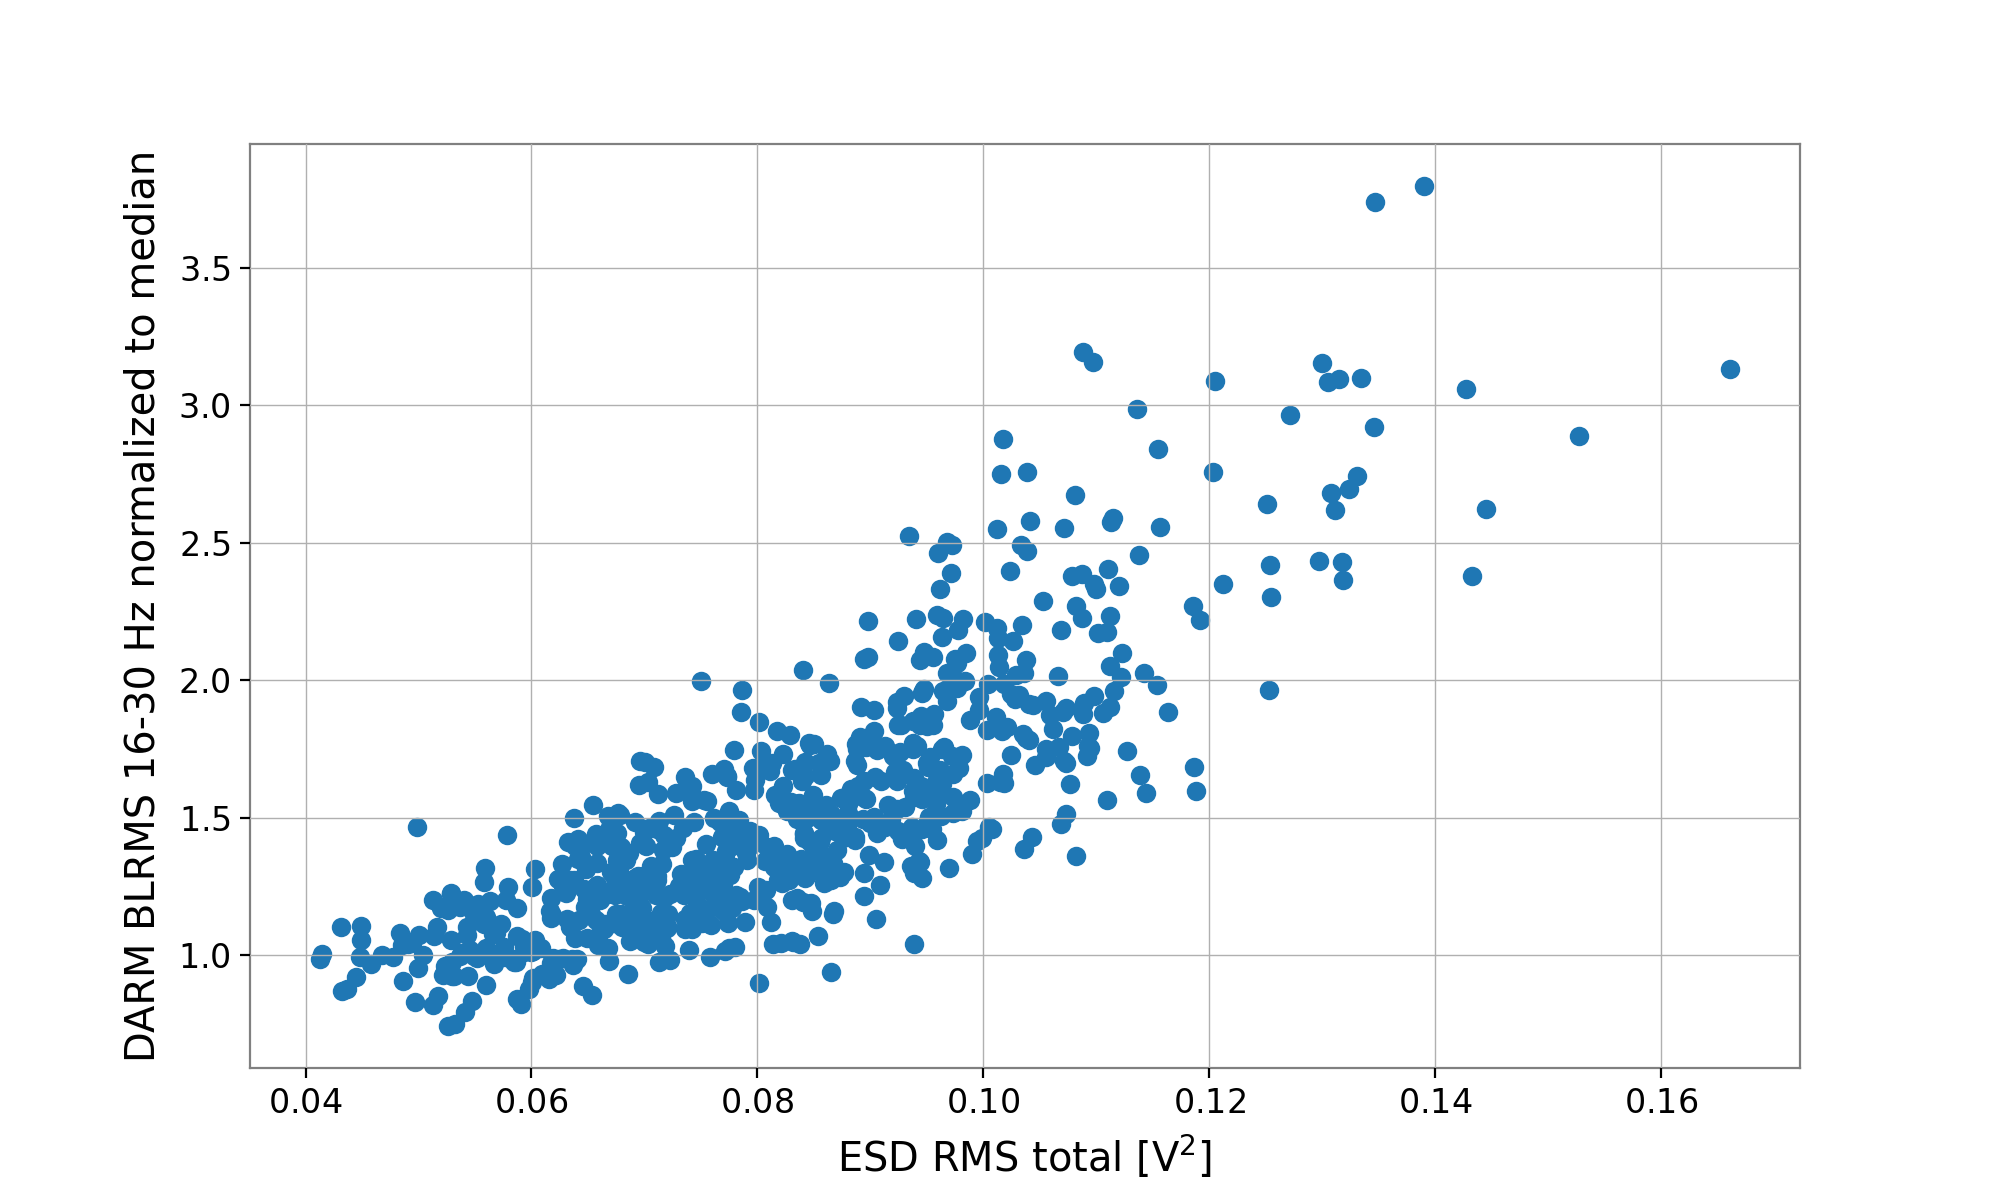
Another way to look at ESD quadratic noise. The DARM strain band-limited RMS (computed between 16 and 30 Hz and normalized to the median over time) is correlated to the total RMS of the ESD drive (dominated by the low frequency component, below 10 Hz)
Images attached to this comment