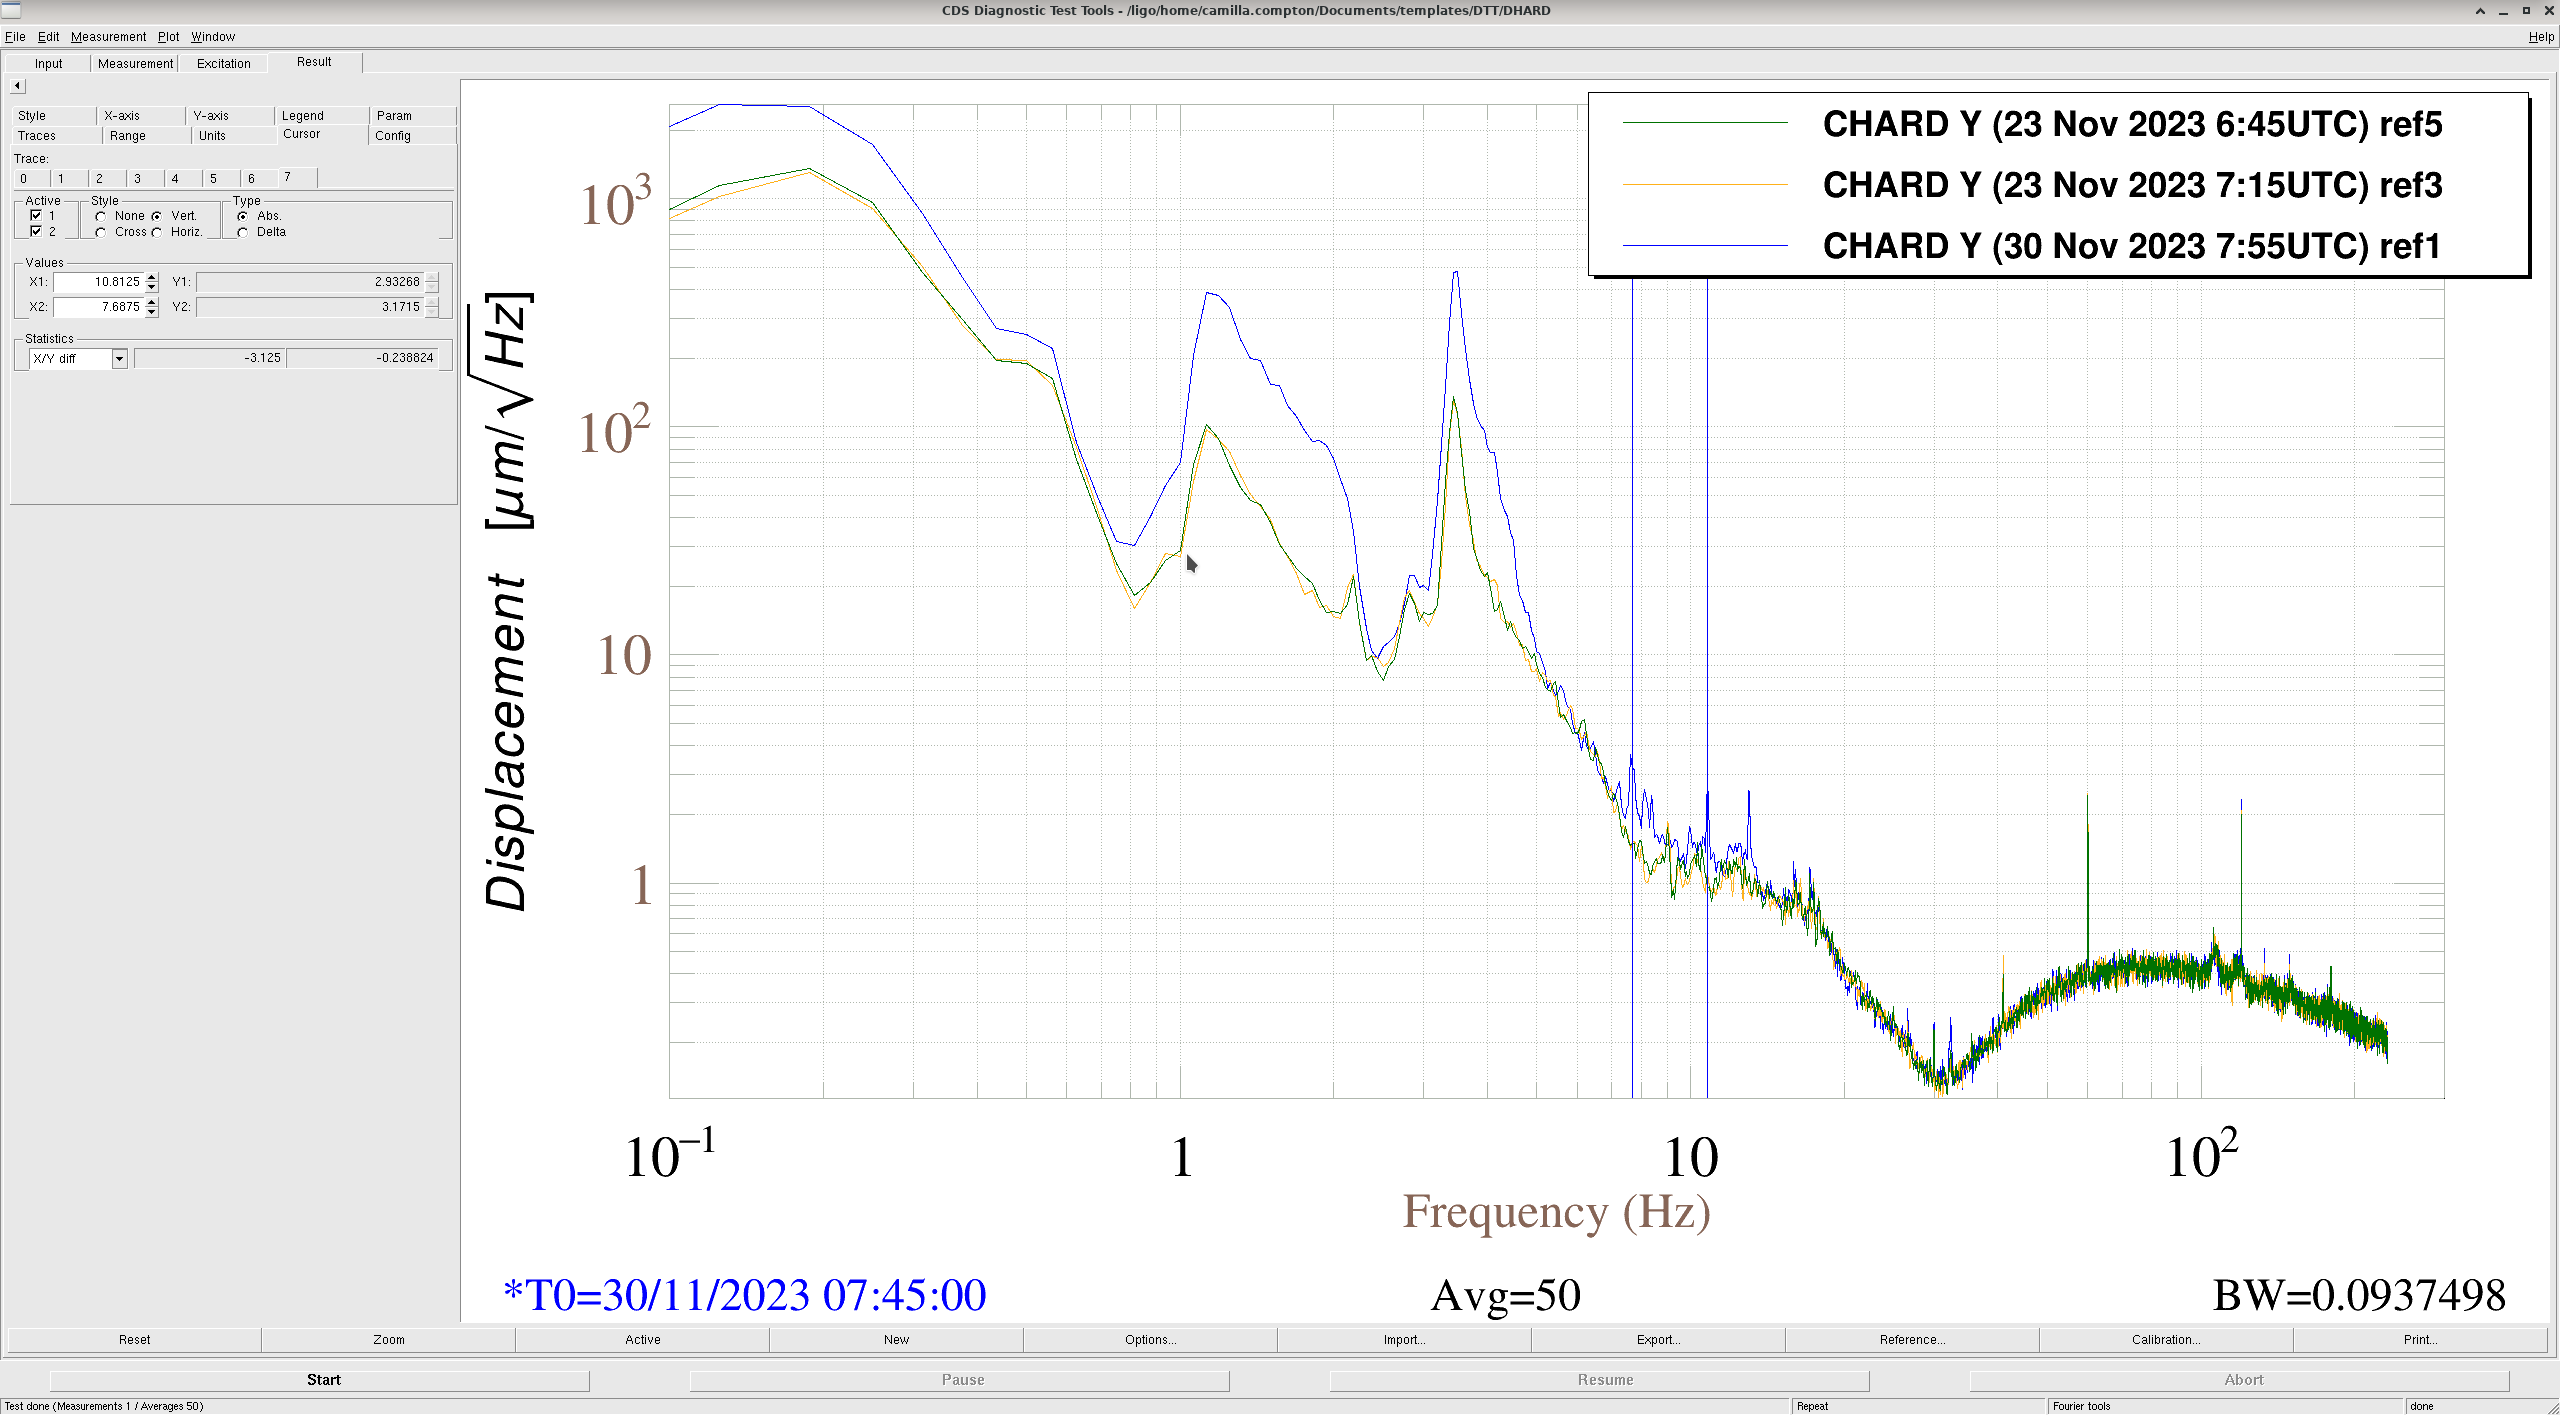
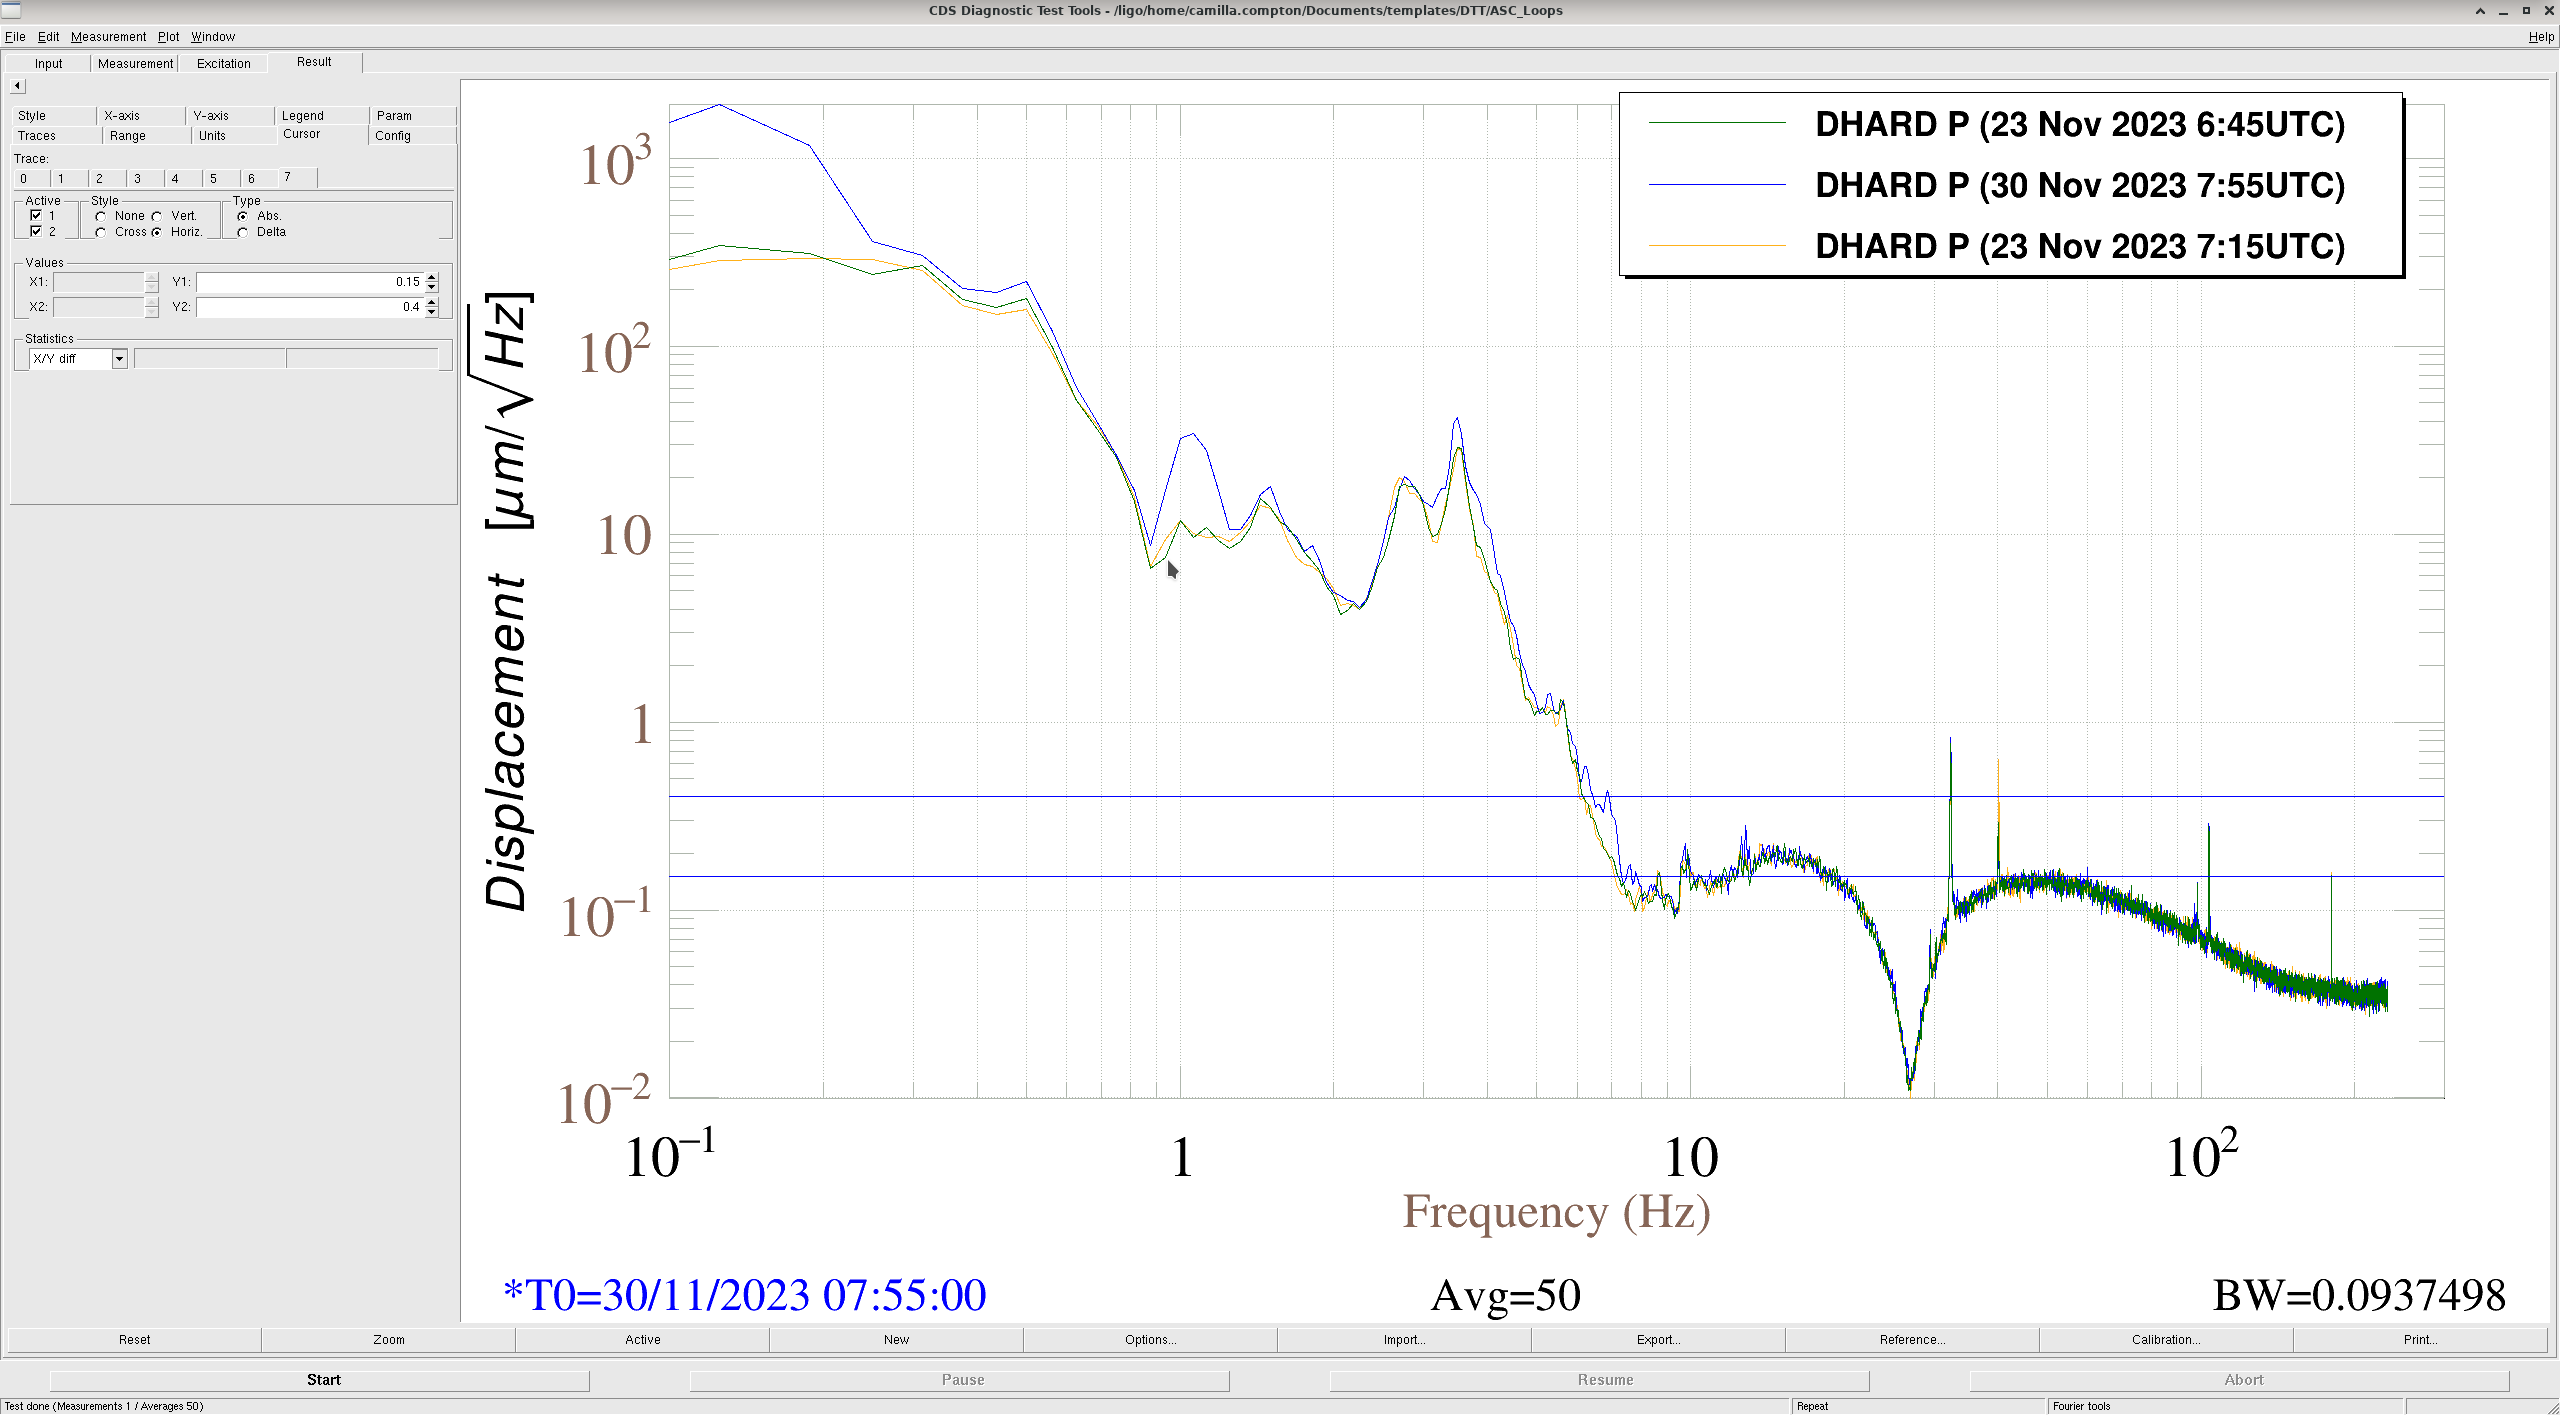
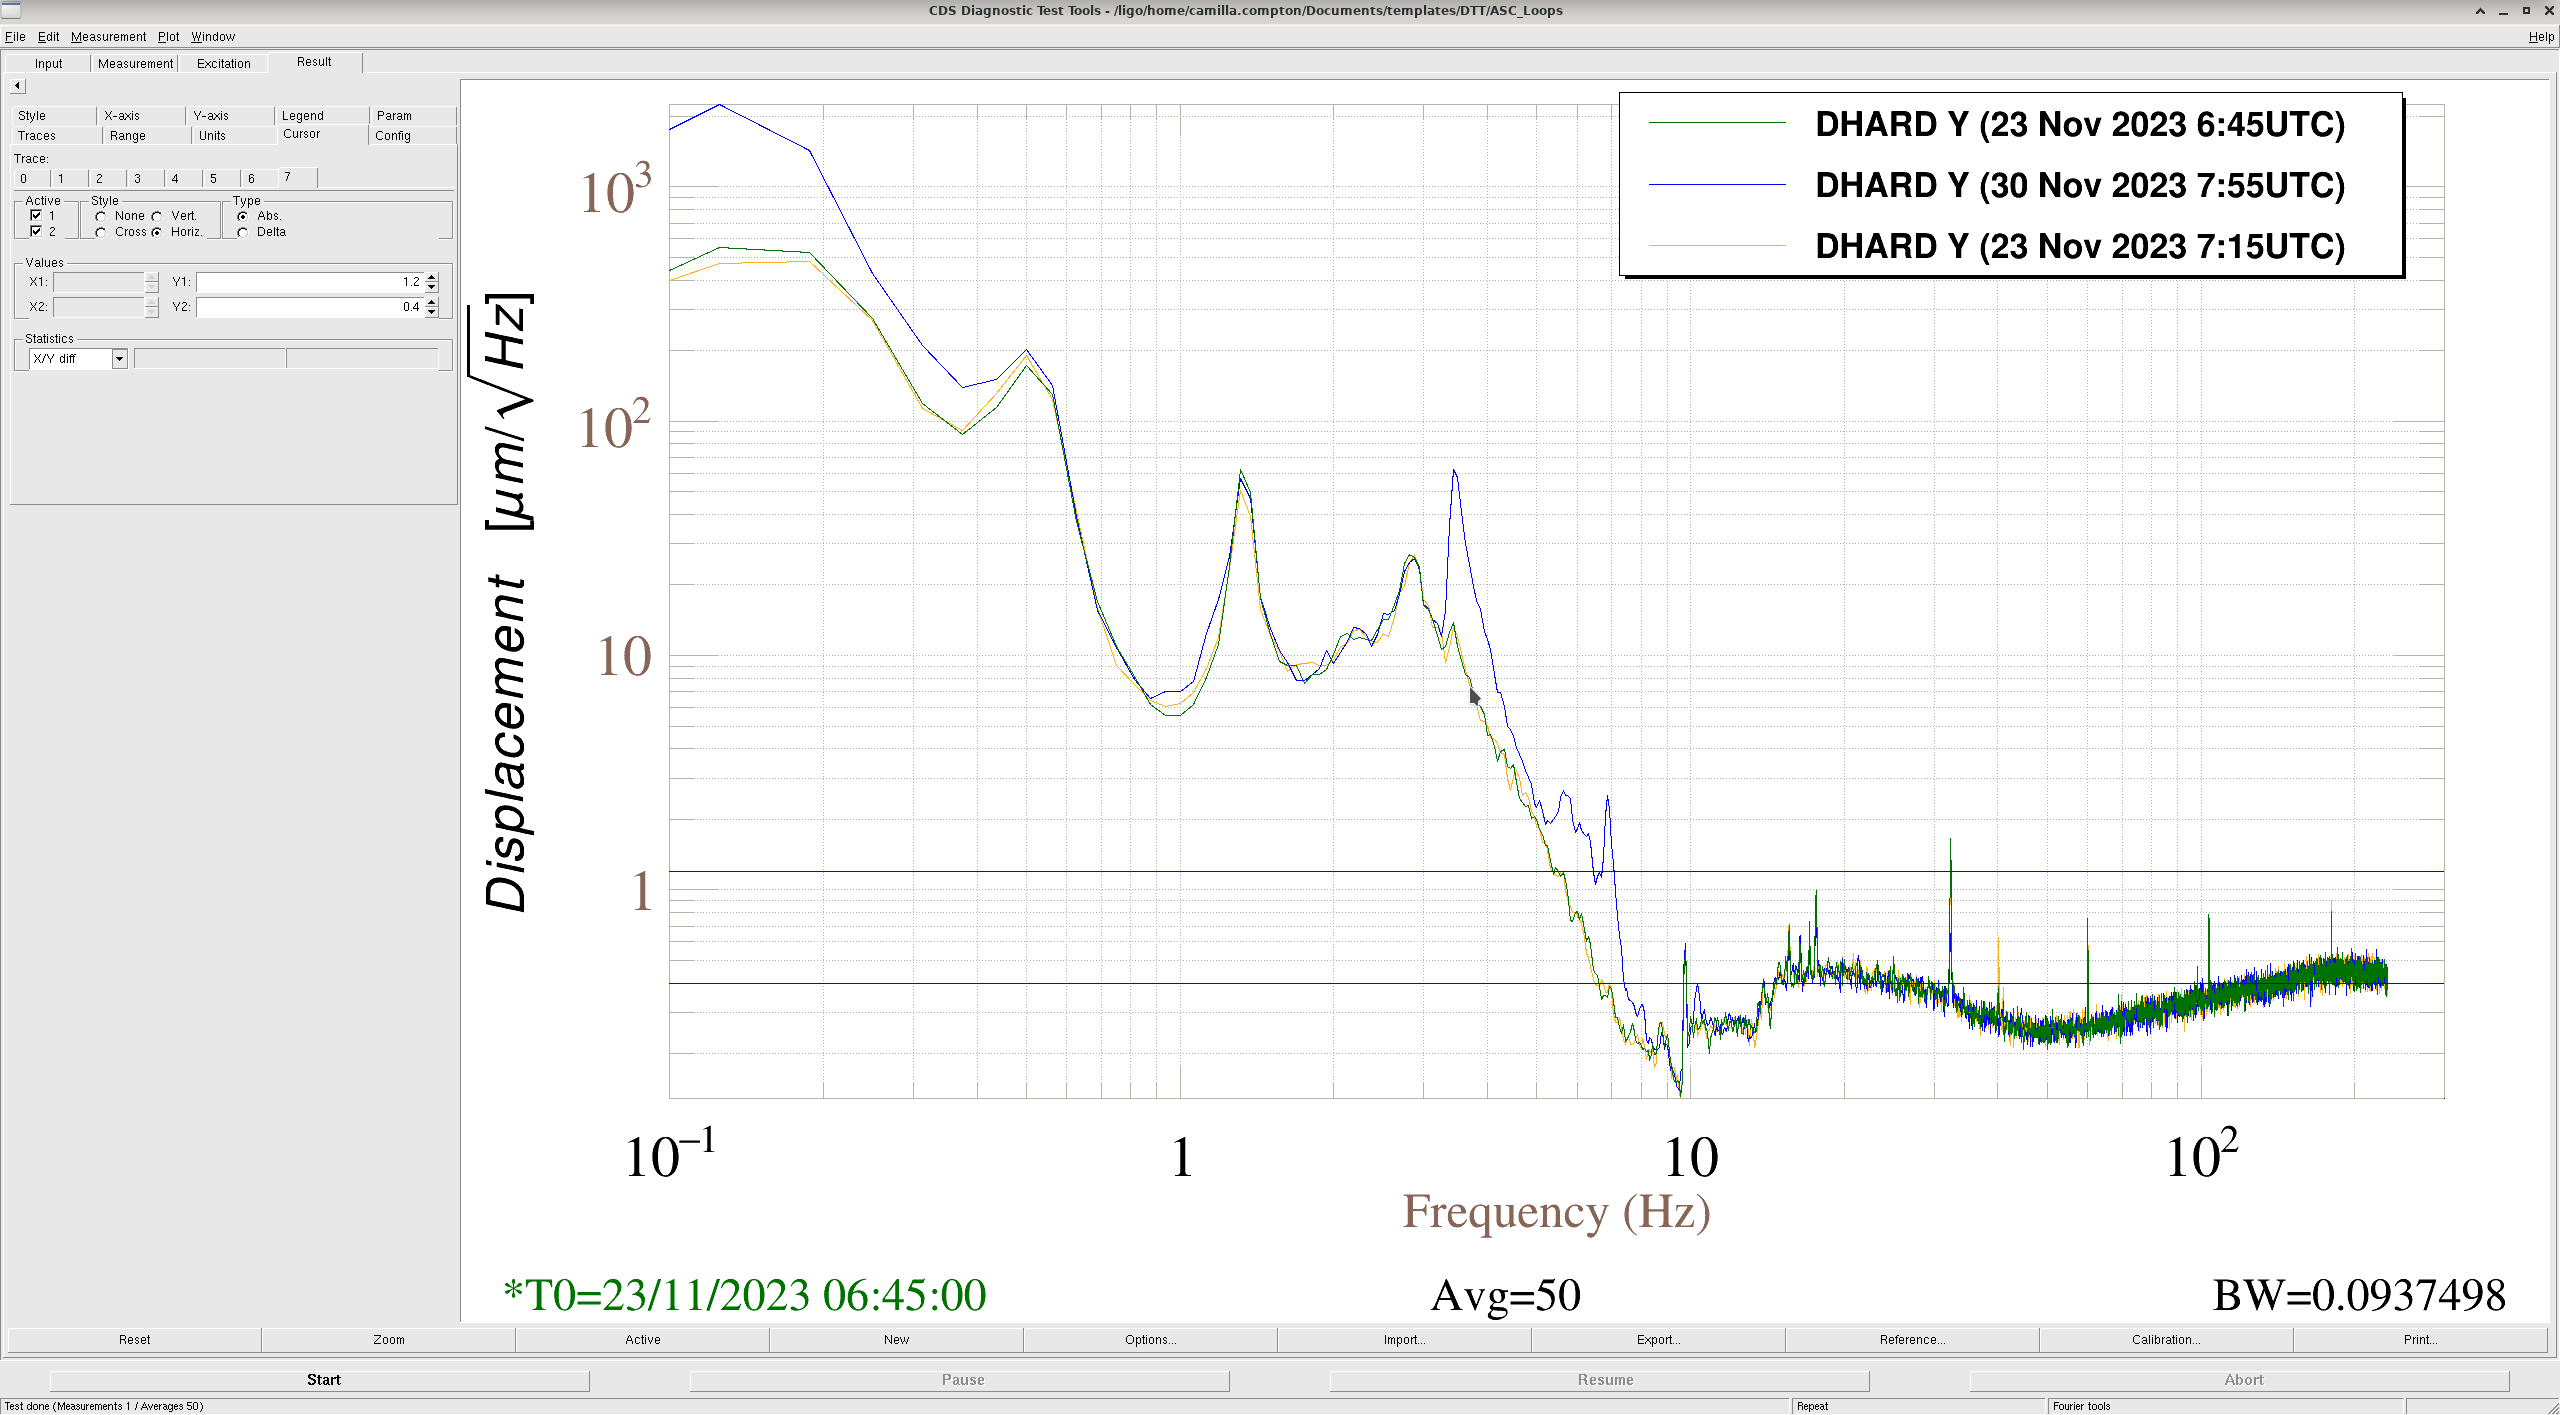
ASC loops at three times are compared are below in DTT, all 0-232Hz, 0.05Hz BW with 50 averages and 45% overlap for ~ 8 minutes of data used. Good DARM: 2023/11/23 6:45UTC; Fuzzy Darm: 2023/11/23 7:15UTC; Bad Low Freq DARM: 2023/11/30 7:45UTC (useism high) range 140MPc.
- DHARD P and DHARD Y can see factor of 2 increase in P and Y between 5-8Hz on 11/30, on DTT (doesn't look as bad on ipynb?!) Some peaks in DHARD Y.
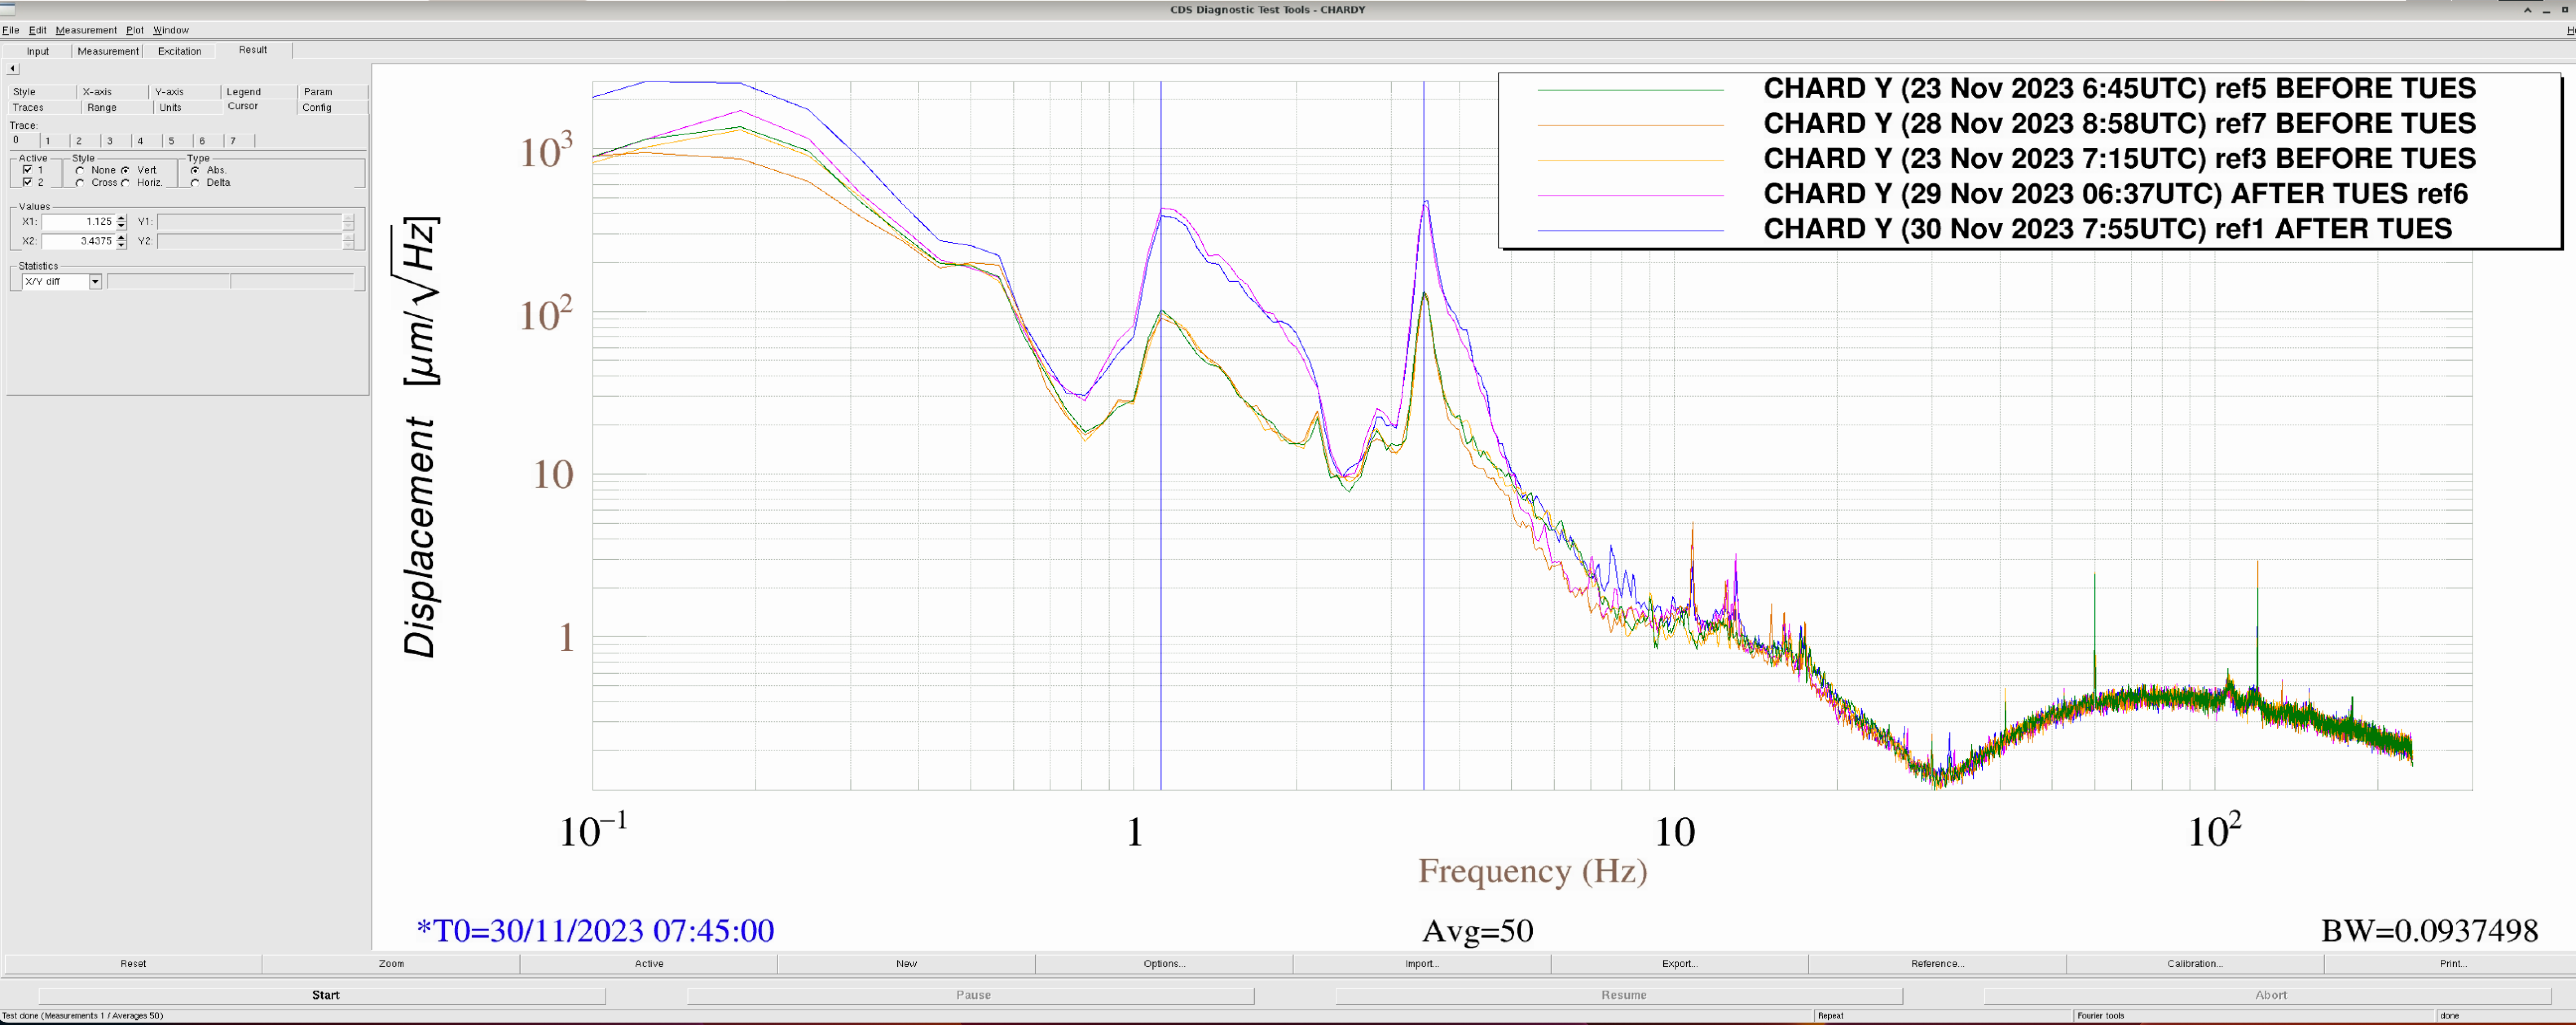
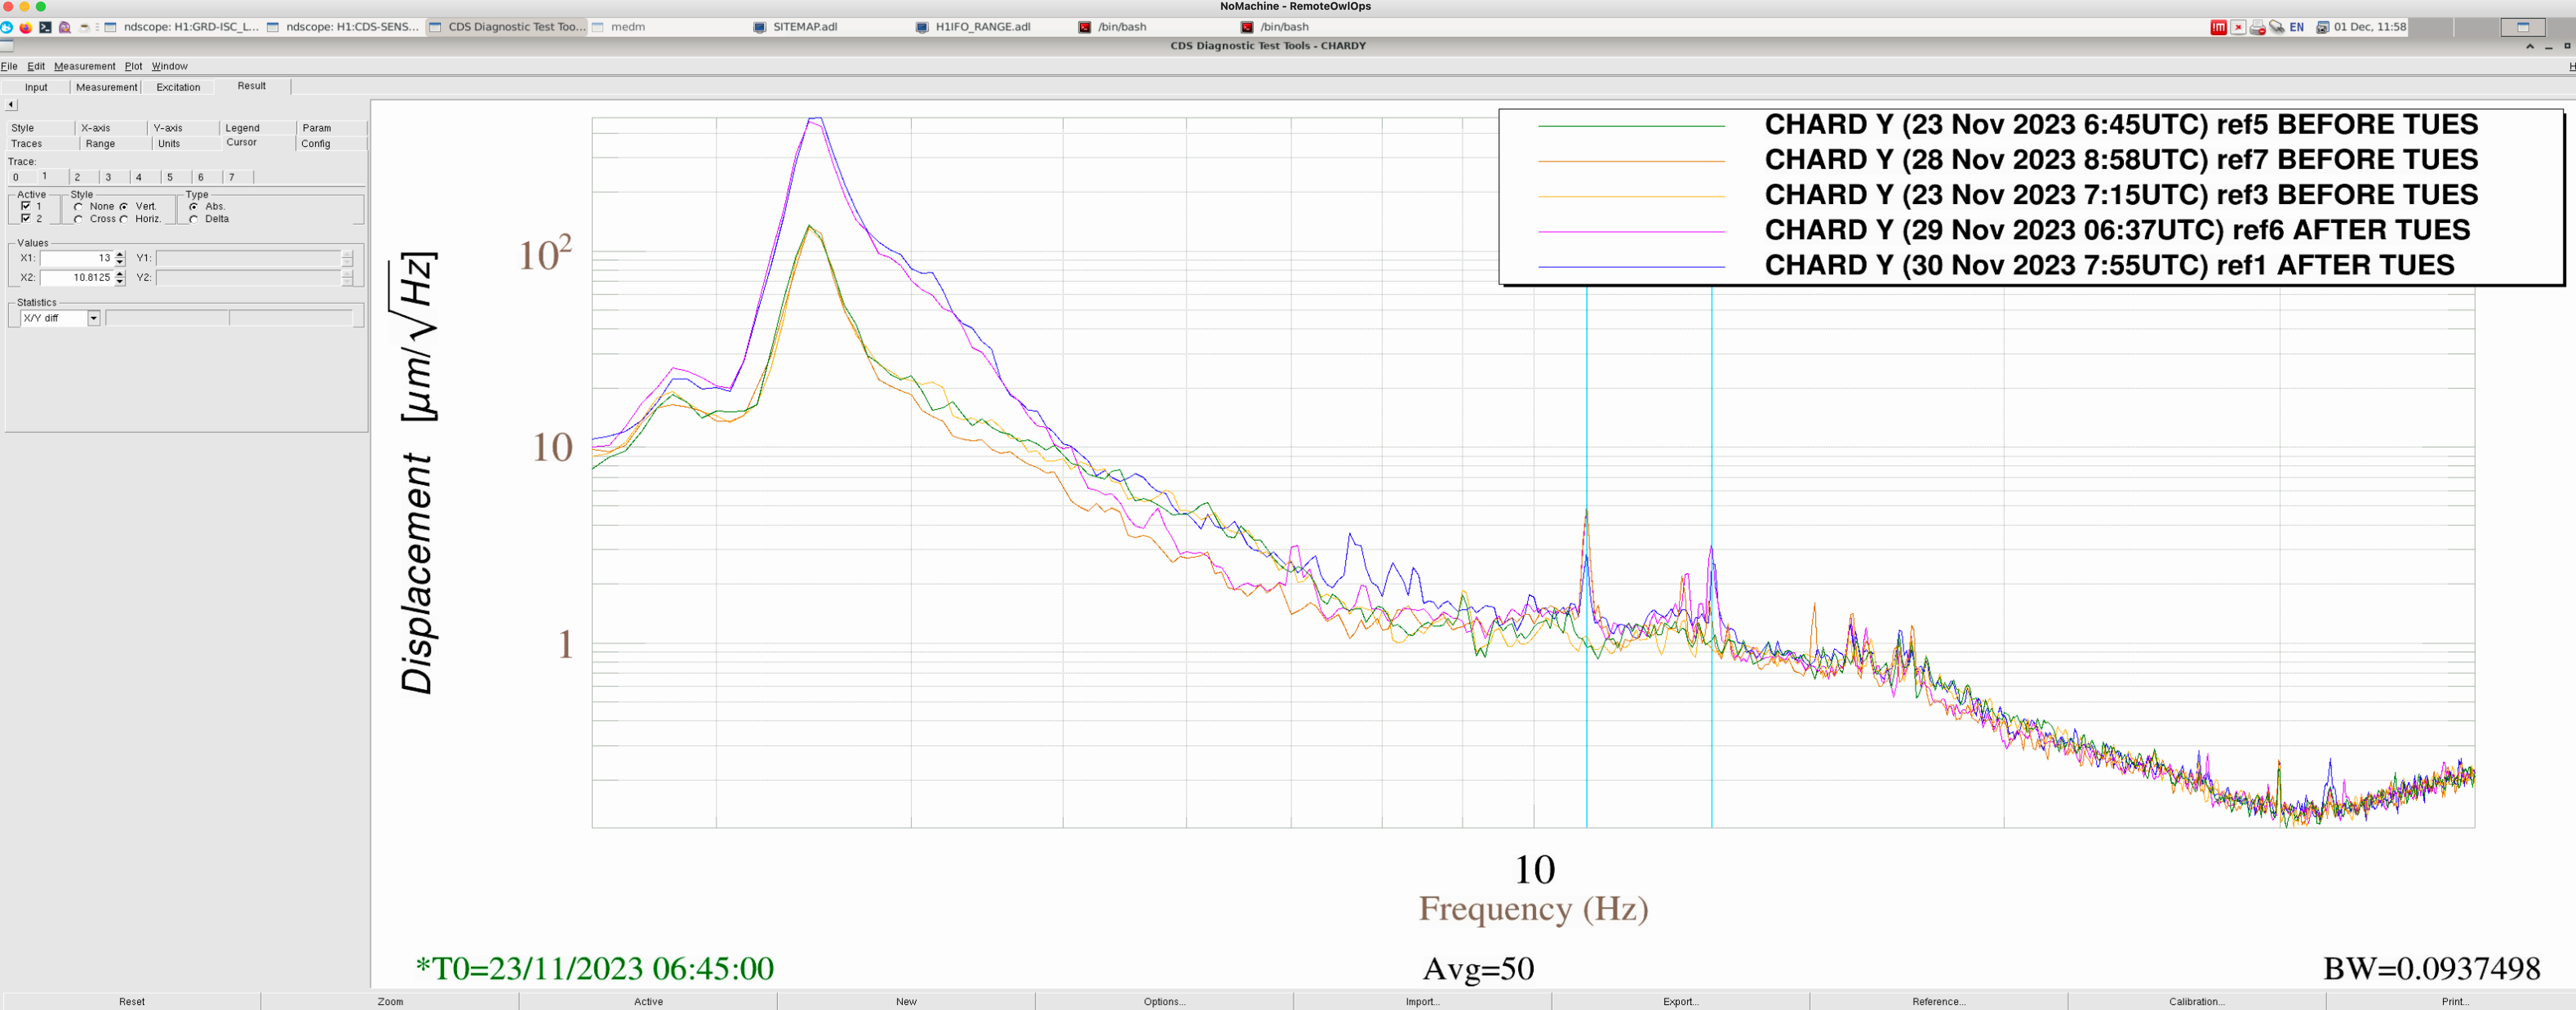
- CHARD Y has some peaks around 7.7, 10.8, Hz
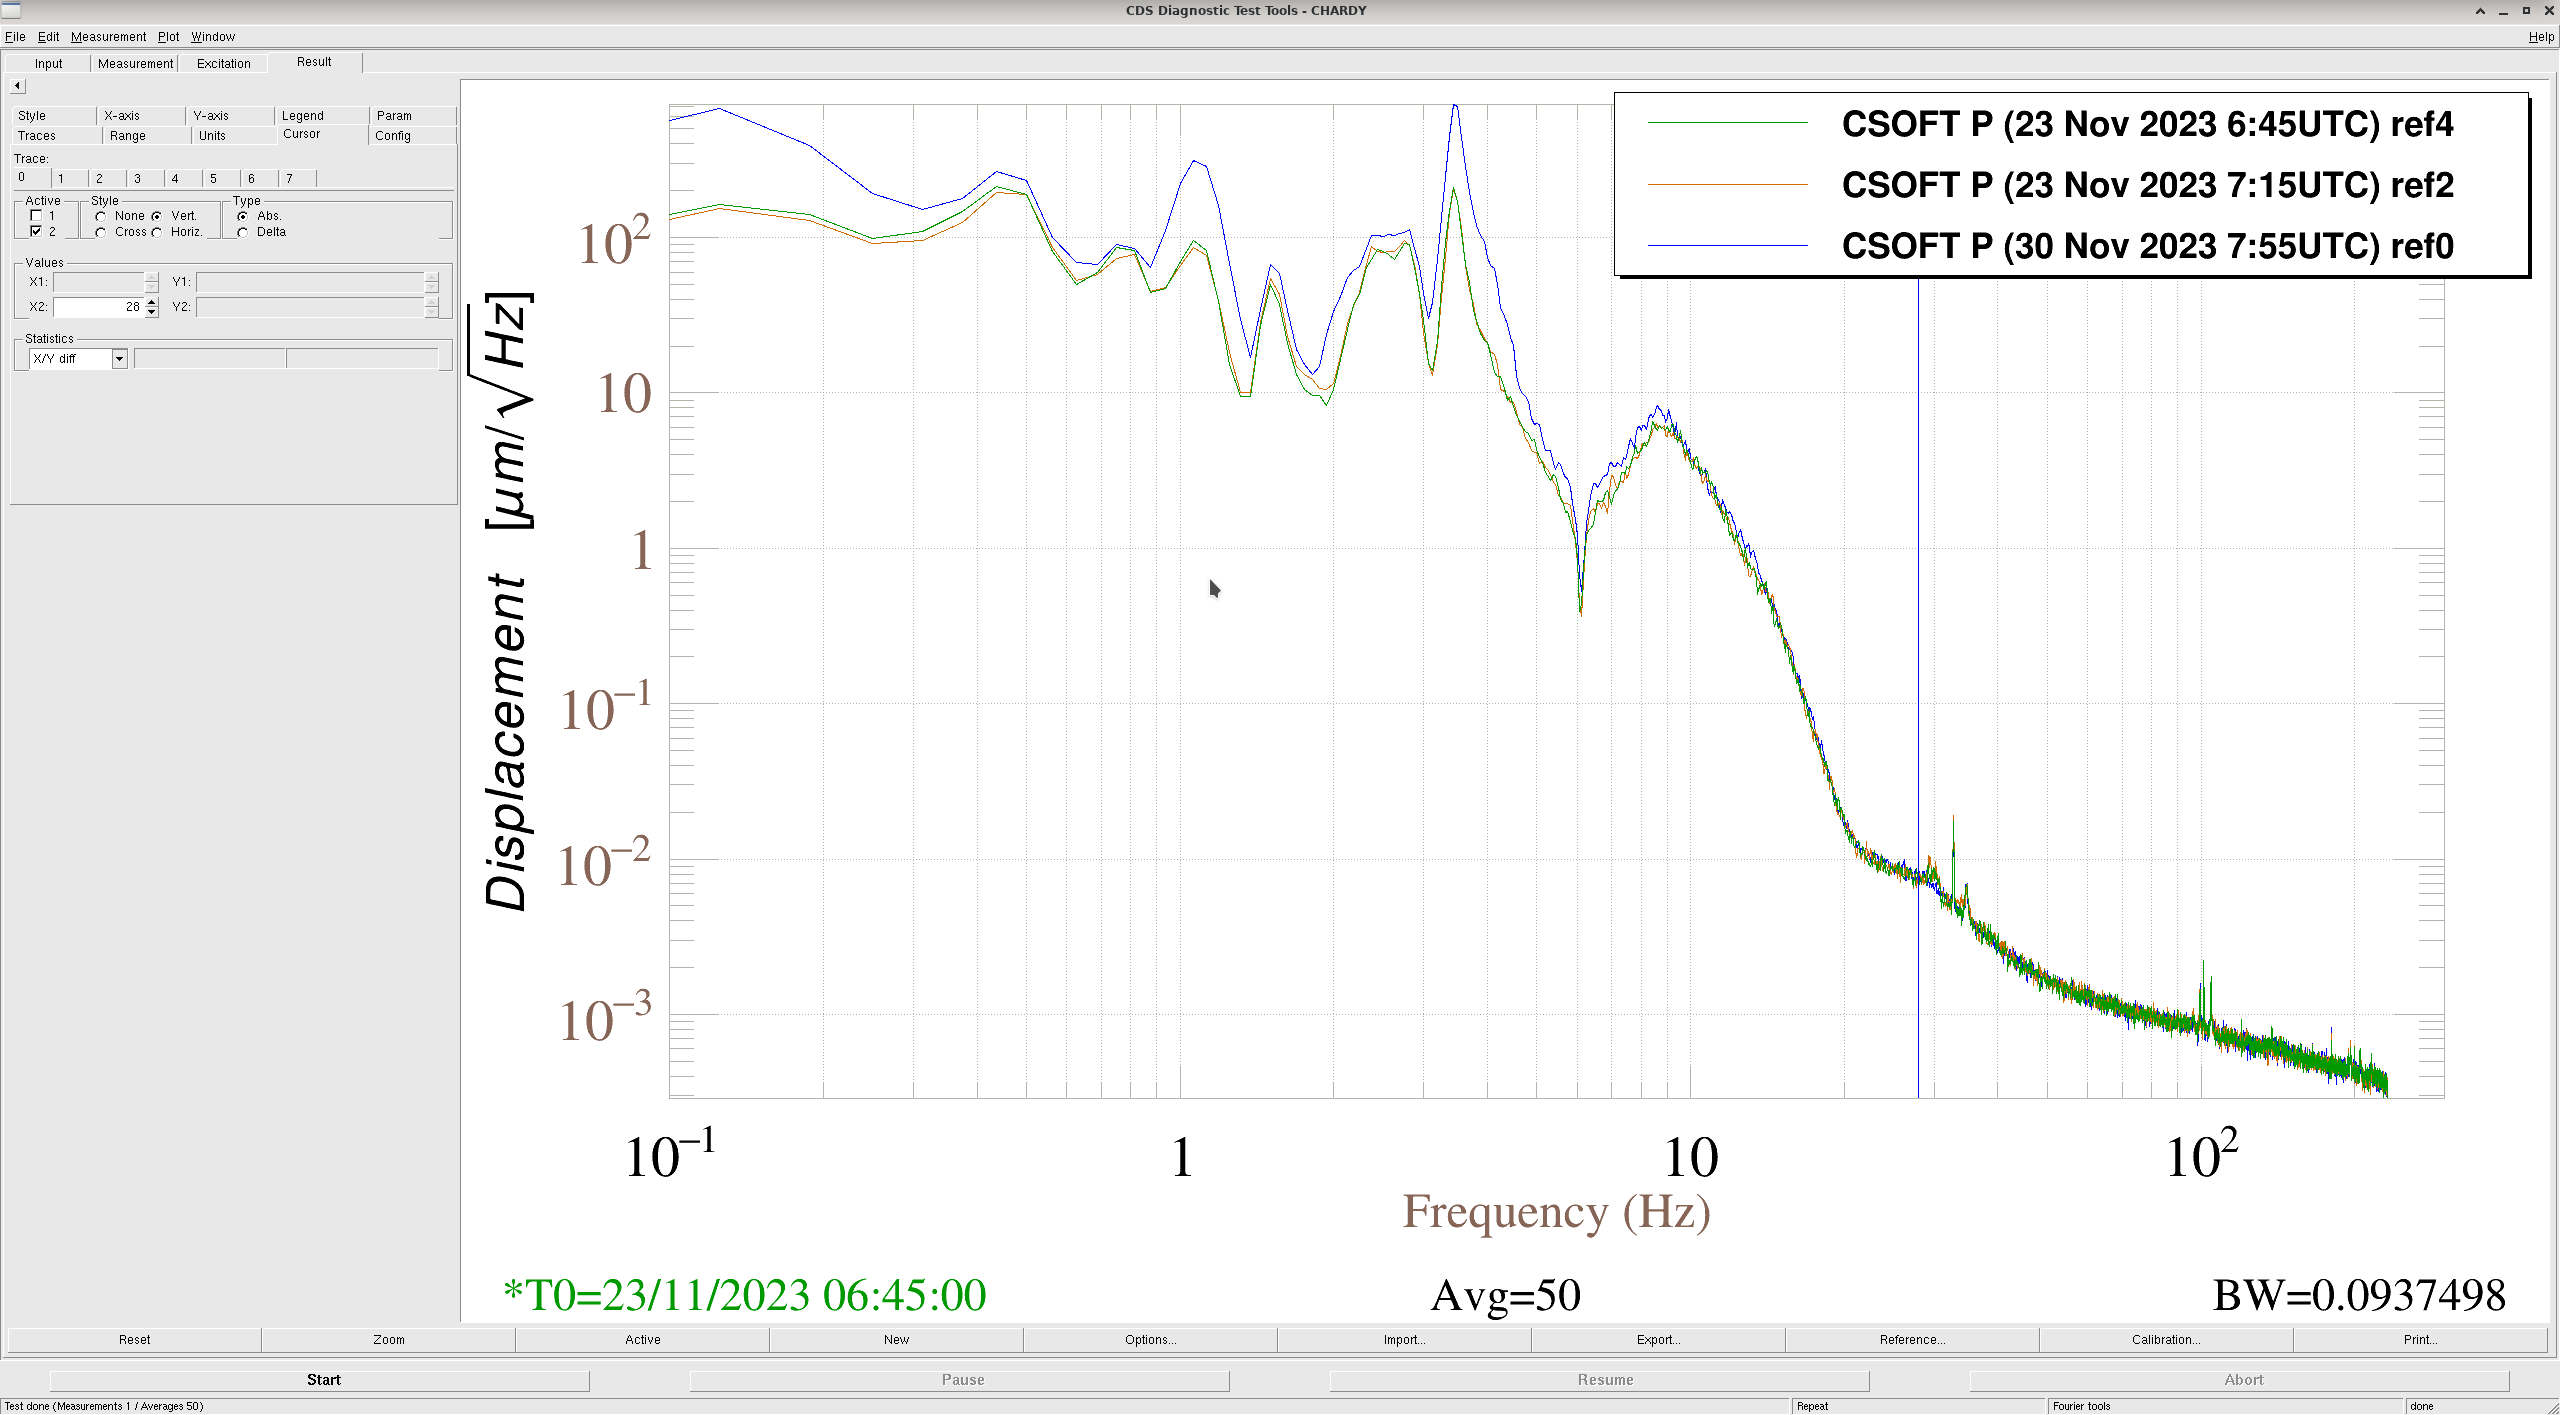
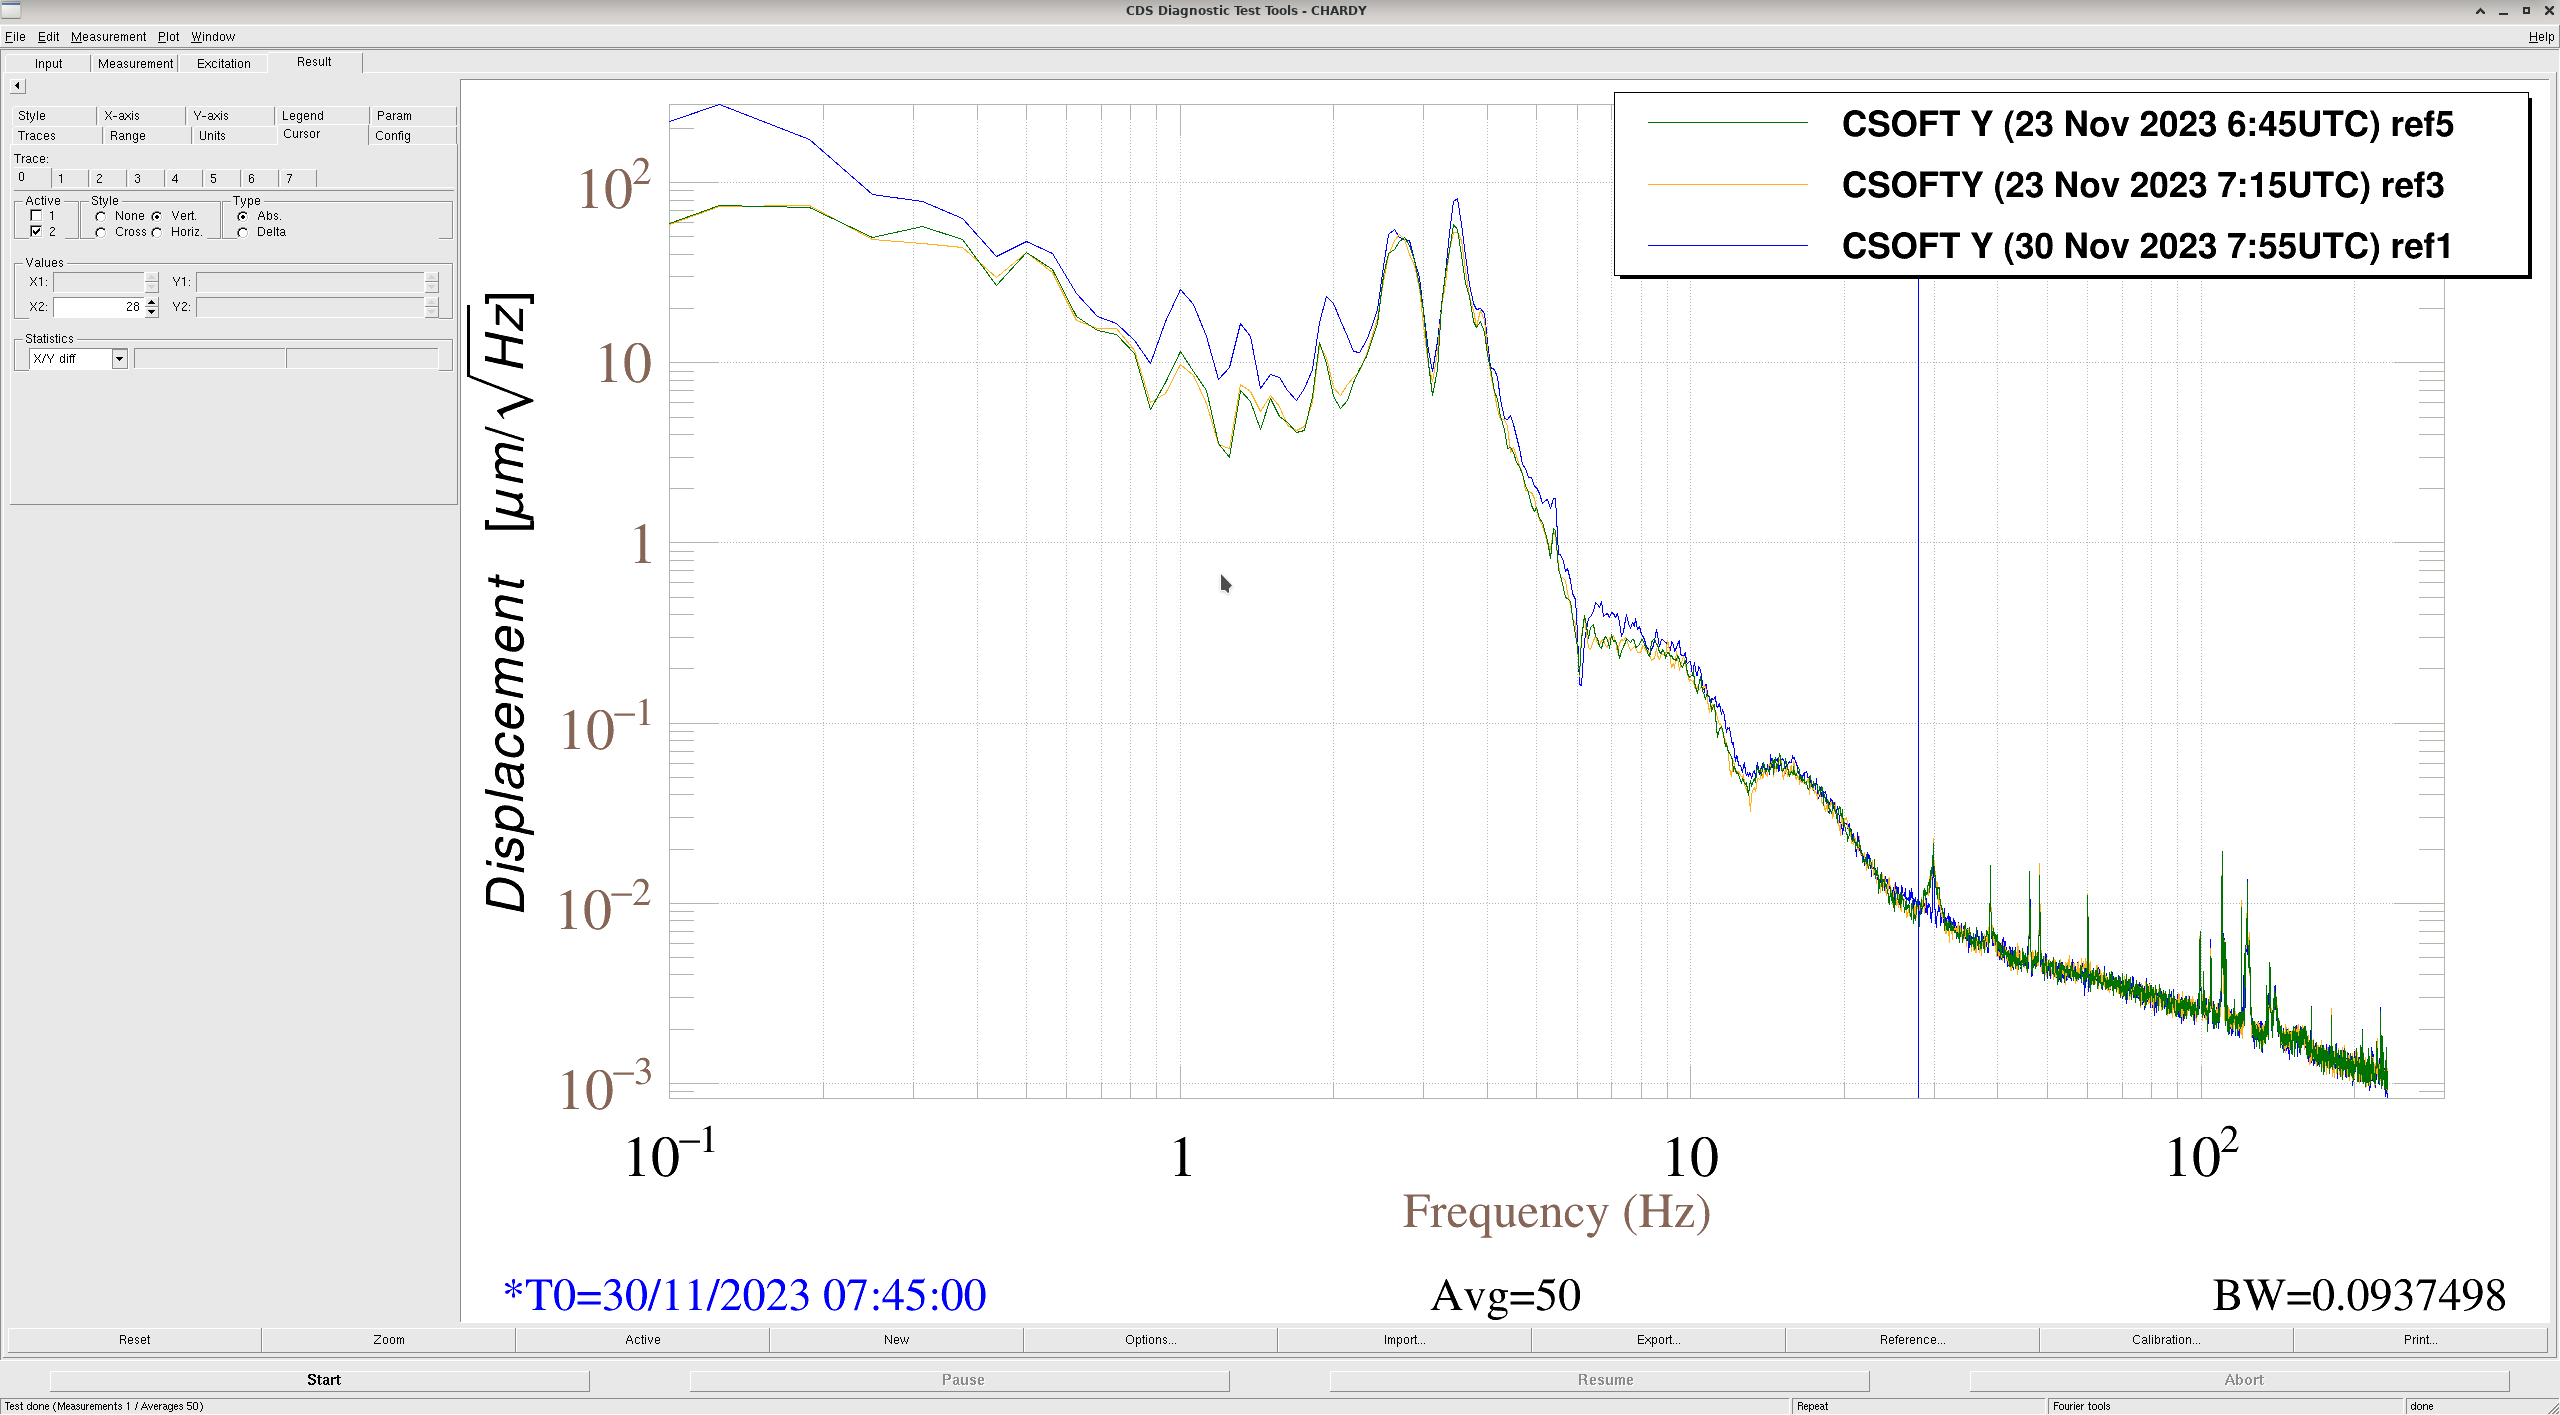
- CSOFT, DSOFT are similar.
Reused Jenne's 64760 rubbing script for these loops with 10minutes of data. PDFs attached. Comparing to 2023/11/23 6:45UTC good DARM time:
- Recent 2023/11/30 7:45UTC you can see the differences listed above and other low-freq differences
- Last weeks 2023/11/23 7:15UTC DARM fuzz, there is no differences
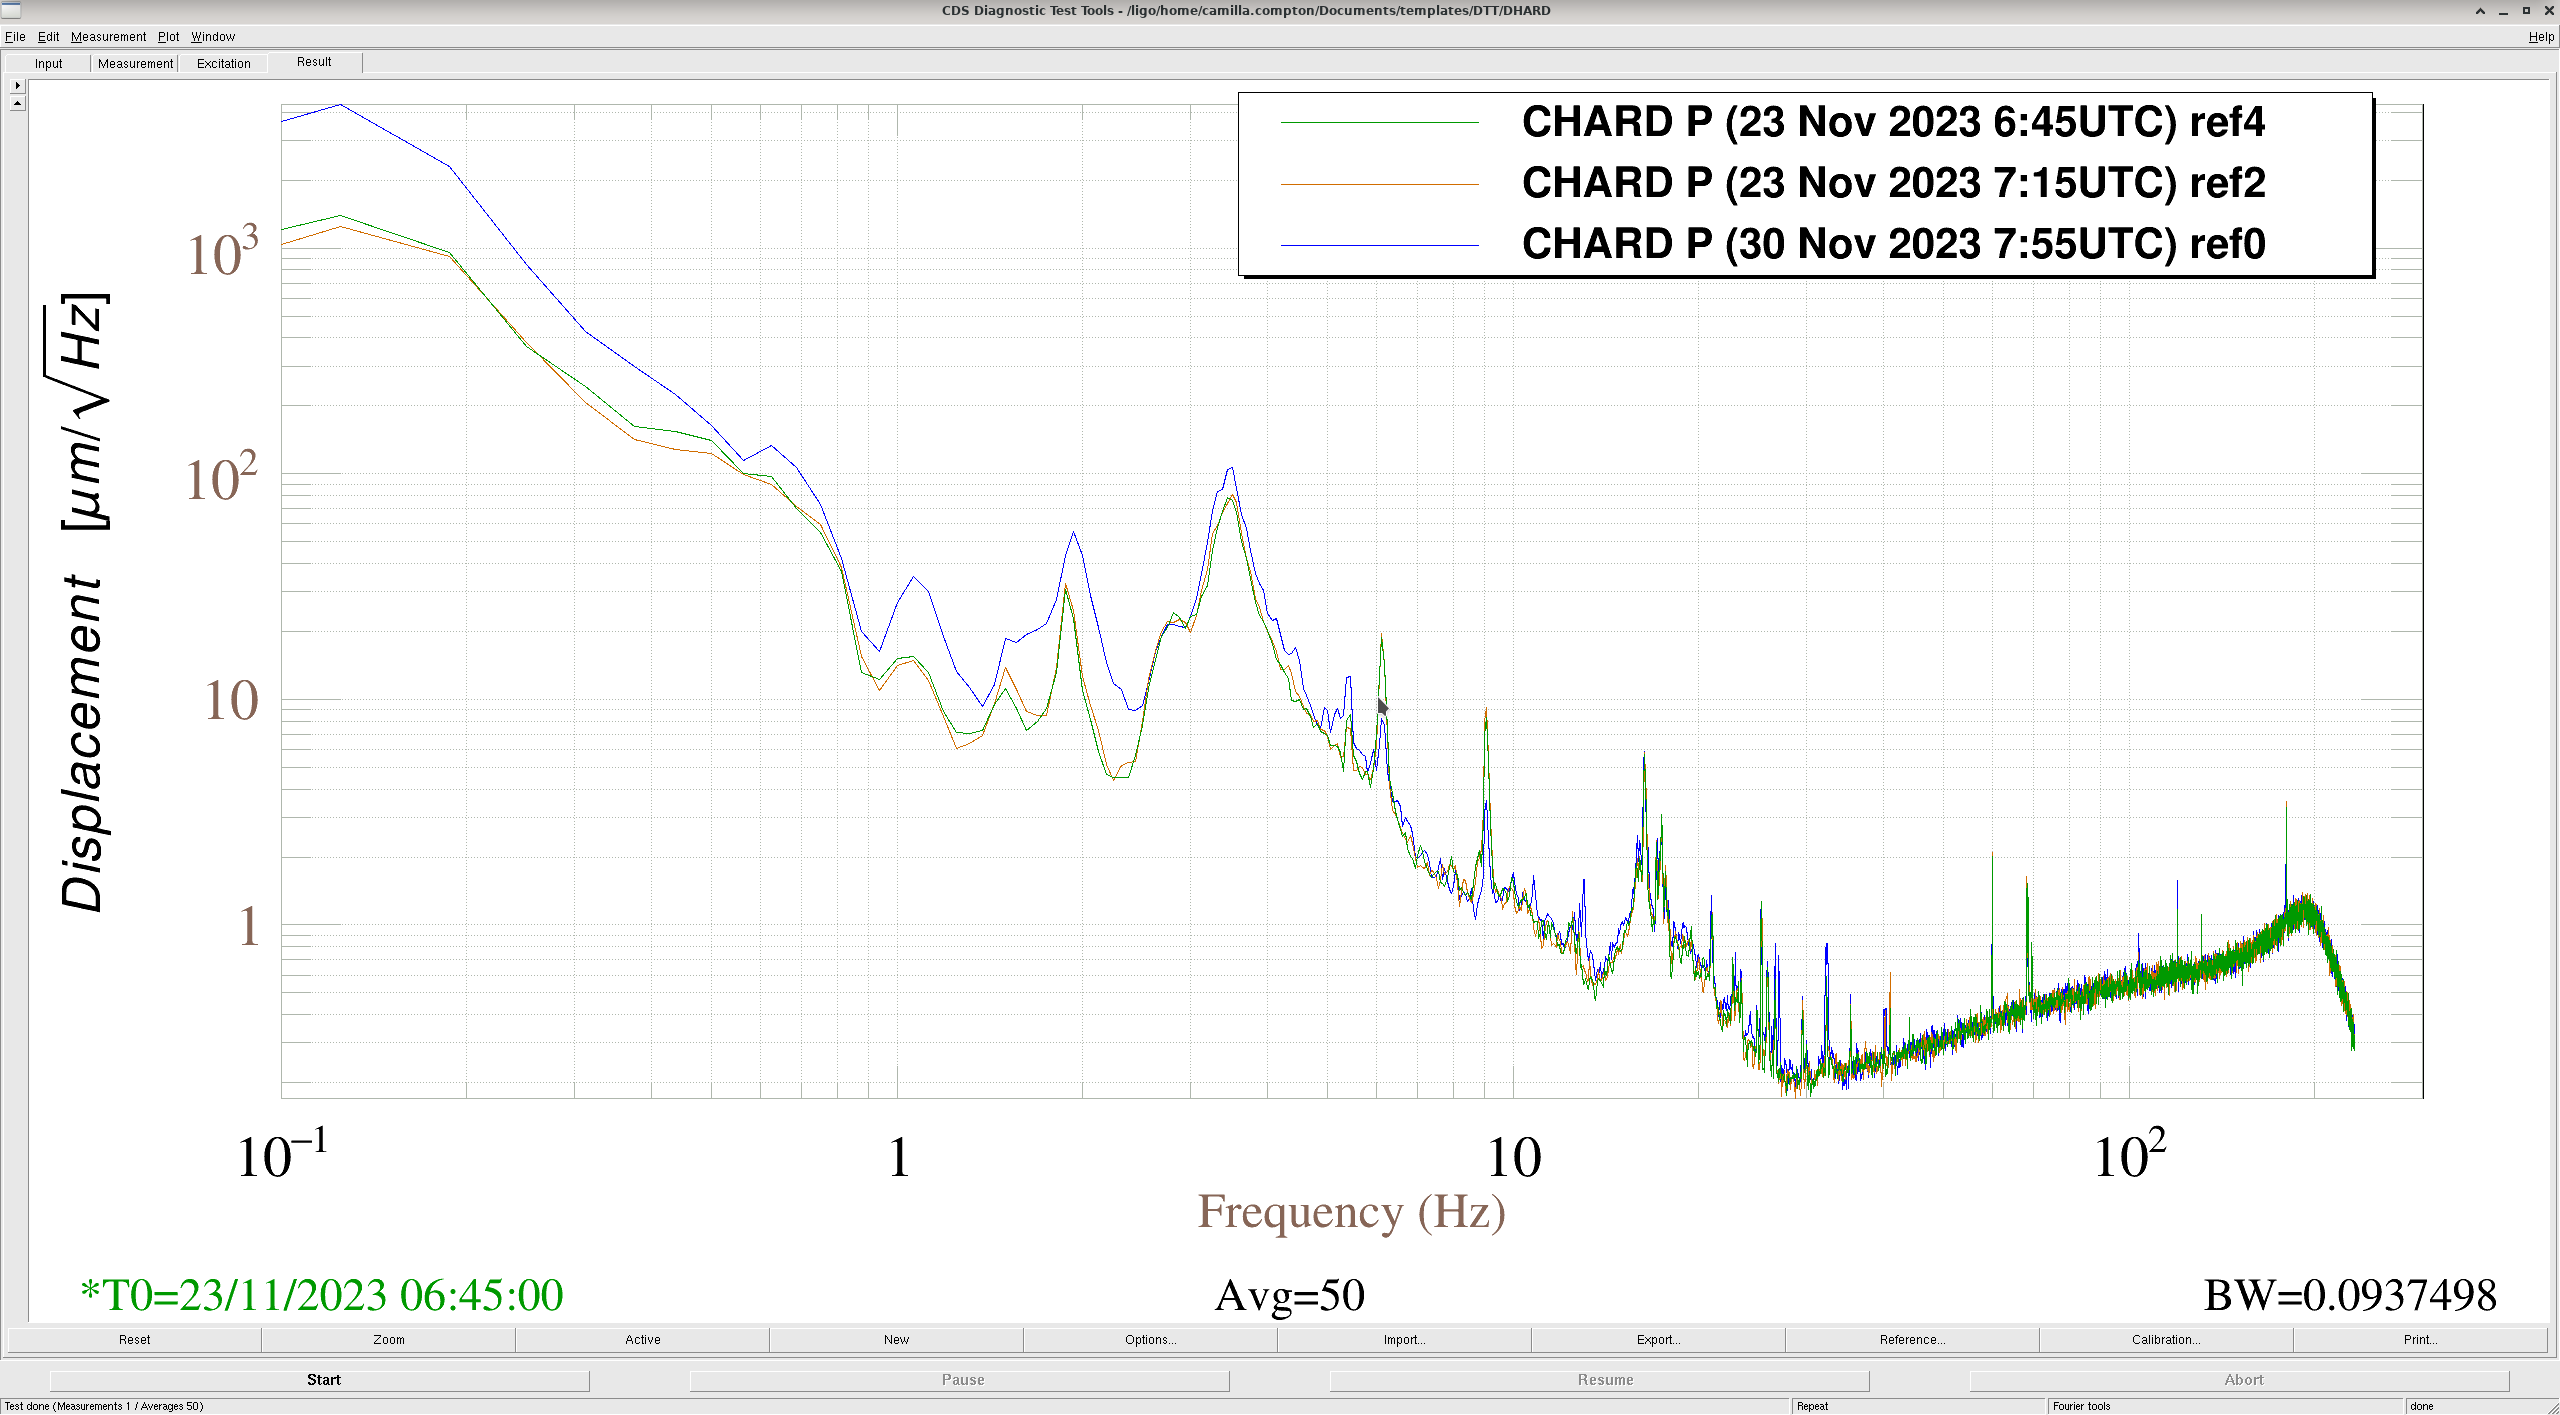

Because I just picked a time with a glitch, I compared CHARD in the lock before Tuesday maintenance 11/28 08:58UTC and the lock after 11/29 06:37UTC, You can clearly see the 1.1 and 3.4Hz peaks increase, plot.
Interestingly, there is a peak at 10.8Hz that wasn't there on the 23rd before or after the DARM fuzziness started but was there on 11/28 before maintenance started see zoomed plot.
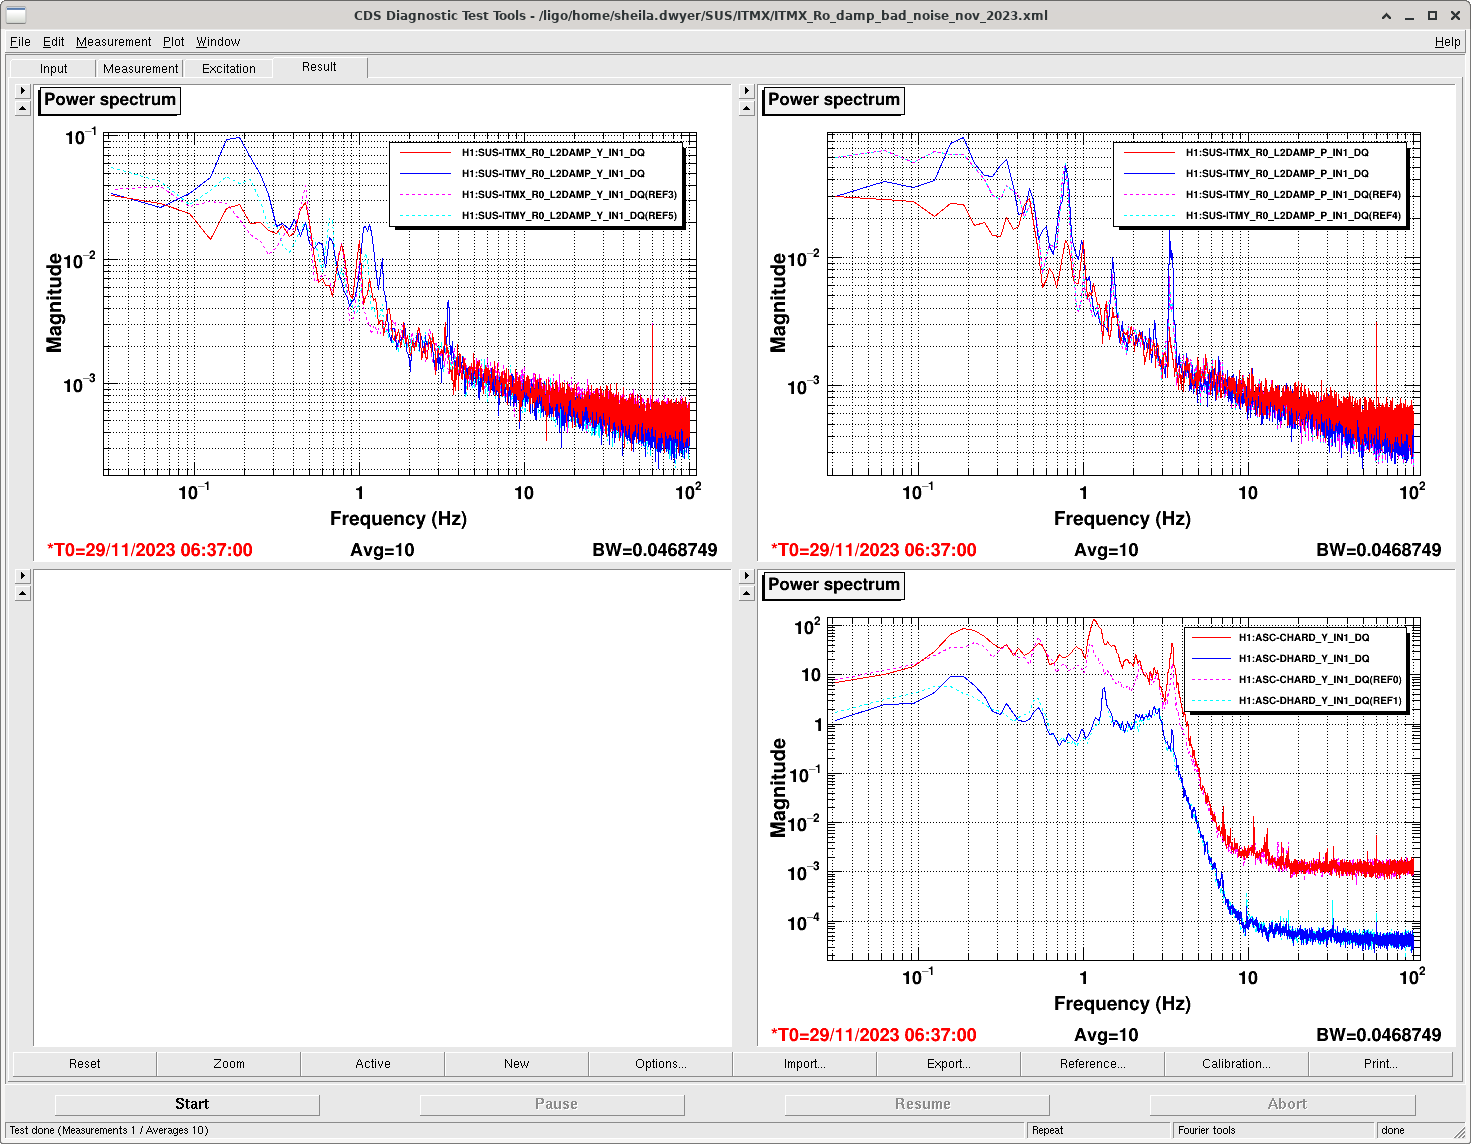
Rahul didn't see anything strange on the quads in 74503, but I think that measurement is taken with damping off. Tagging SUS.
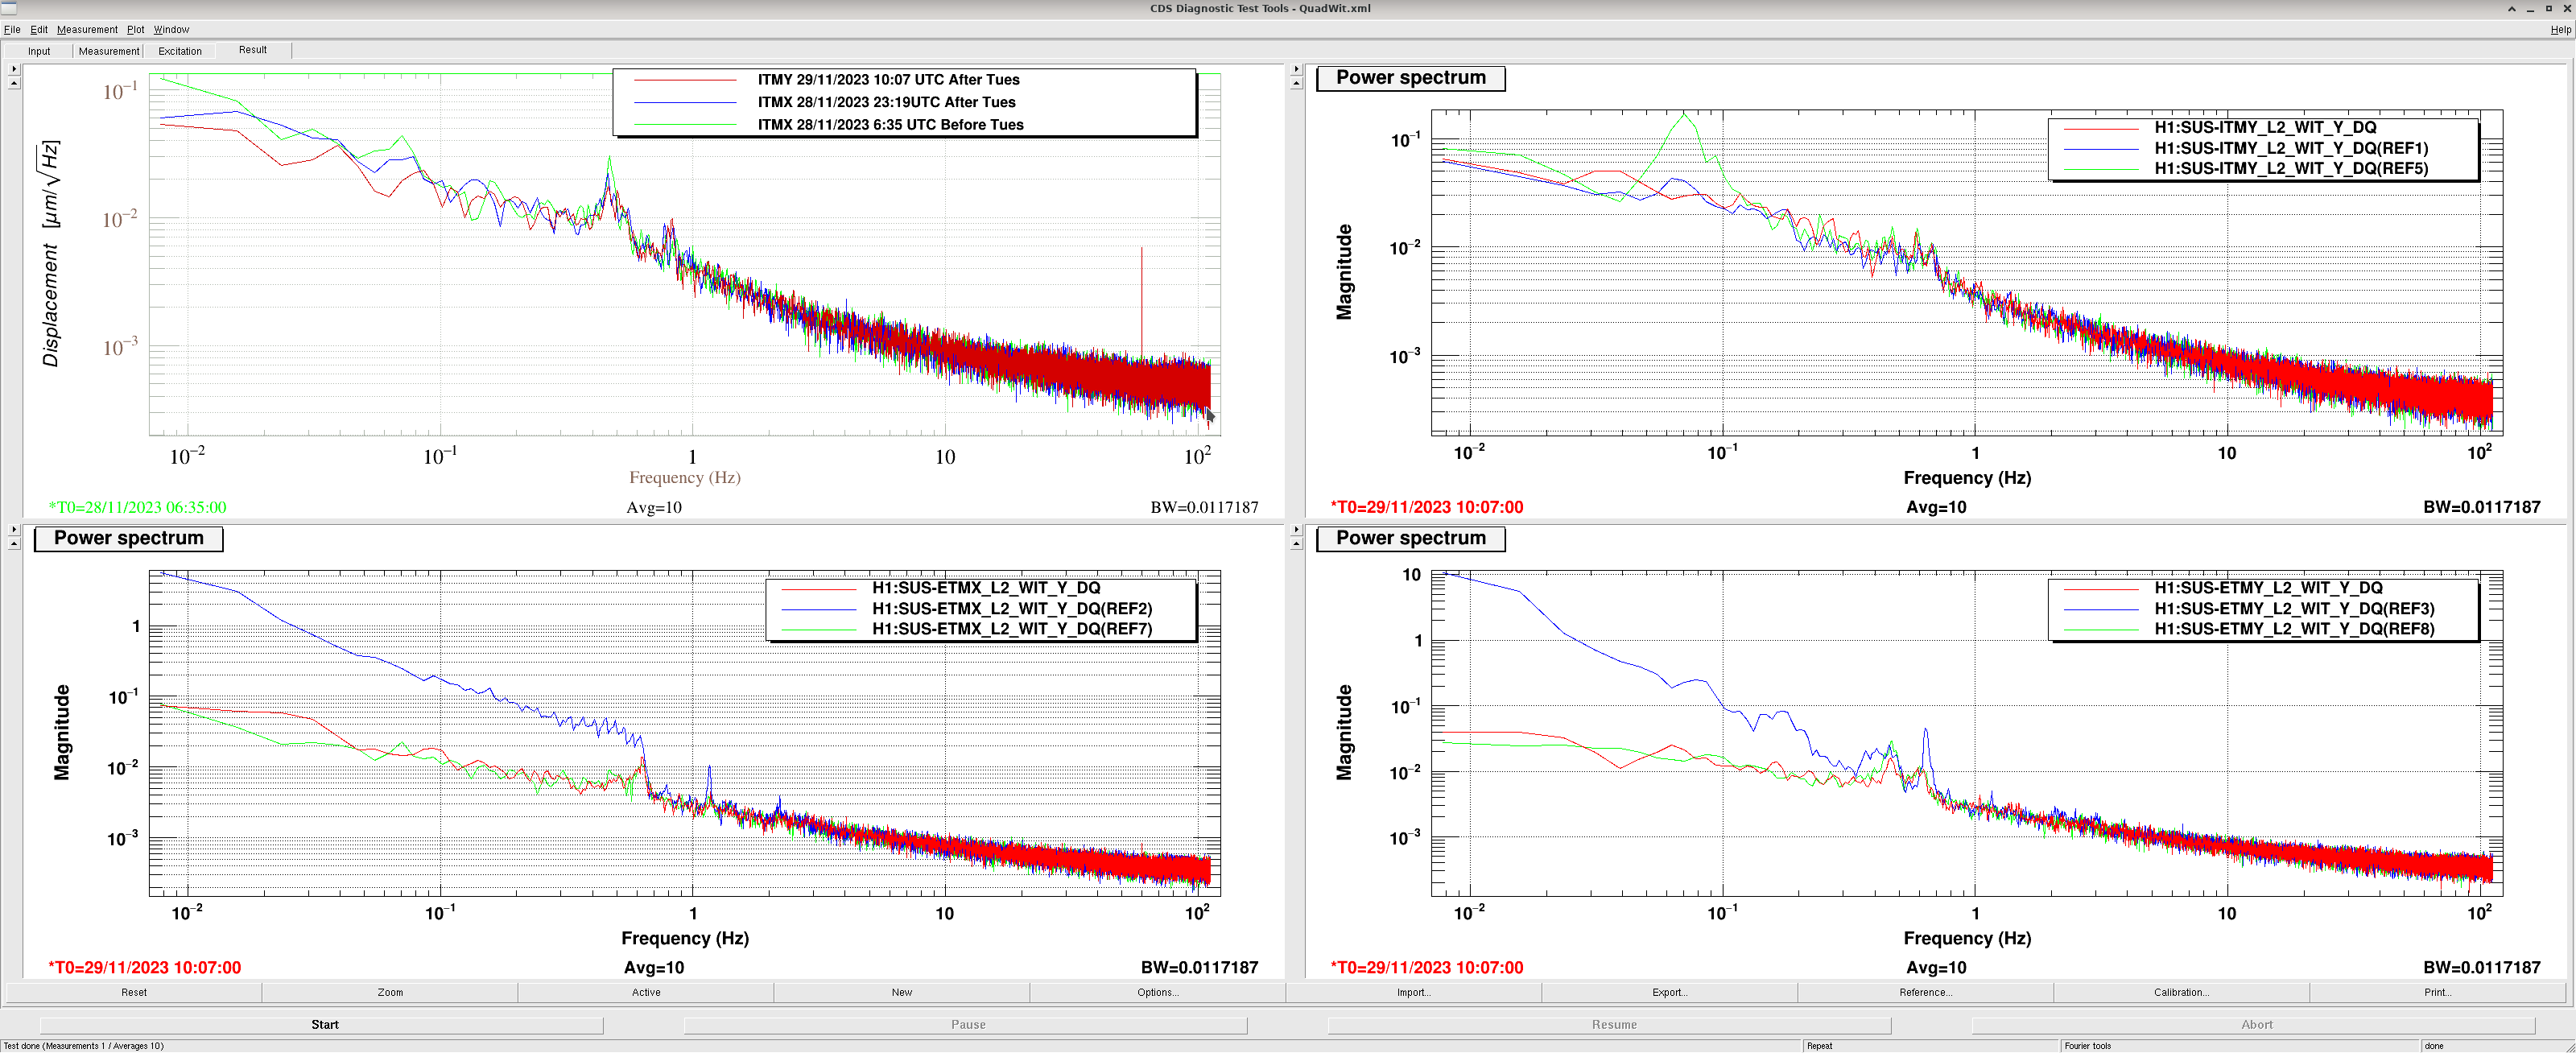
Sheila noted that the 3.3Hz peak isn't visible from the top mass (won't show in Ryan's 74522). Looking at the Quad L2 witness channels when we are unlocked, there is no difference before and after Tuesday maintenance, no features above 3Hz, plot attached.
When we are locked, the 1.1 and 3.4Hz features are visible in all quads in the lock after Tuesday maintenance, but not the lock before , plot attached.
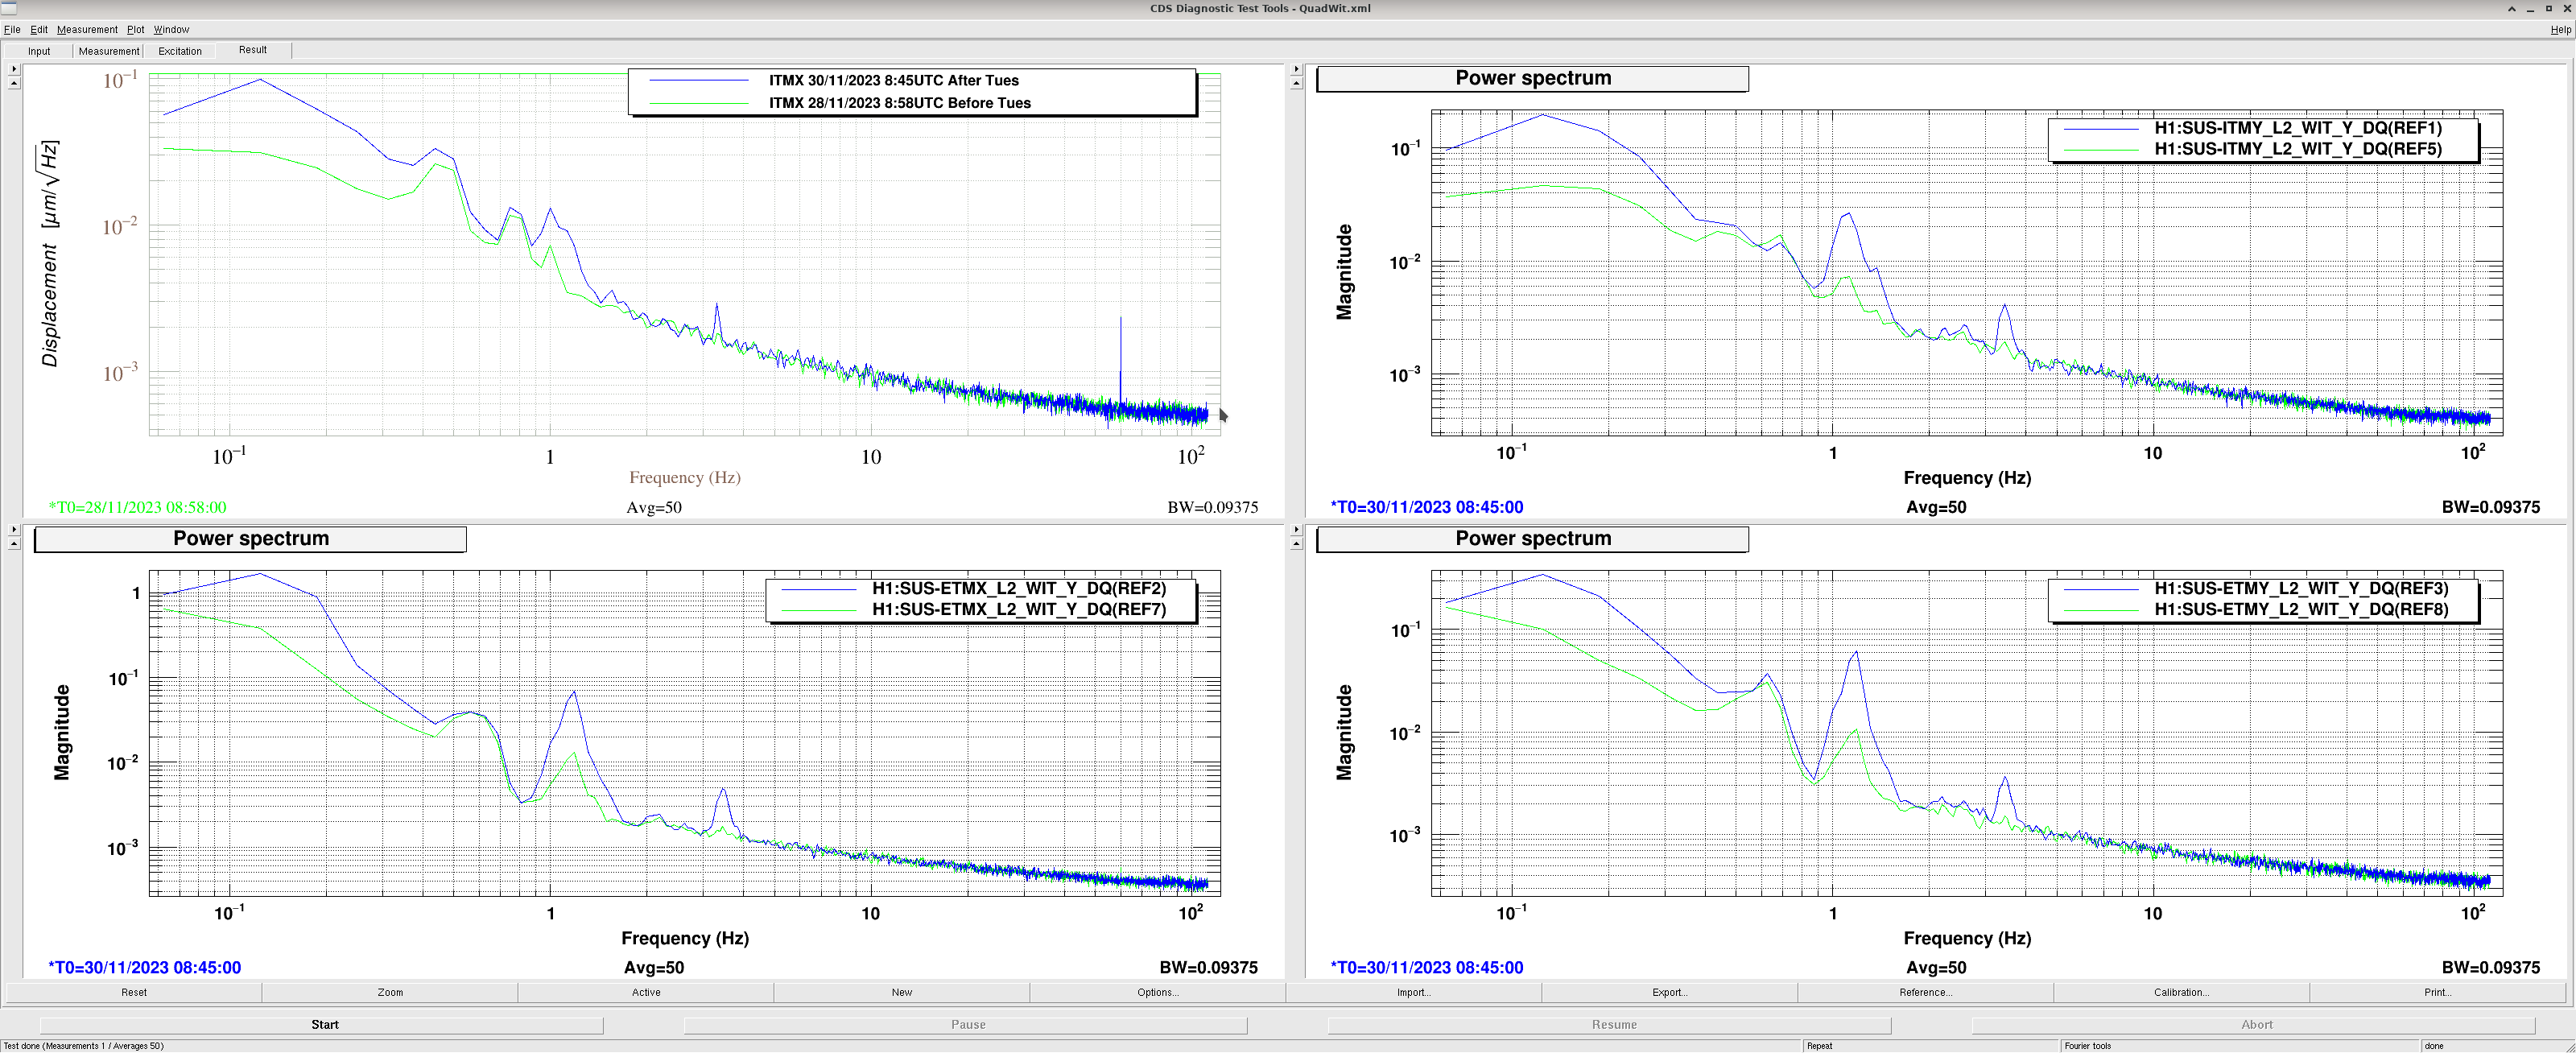
This is a plot that shows the same times as Camilla's above, plotting the R0 L2DAMP IN signals which are the same signals as L2 WIT. This plot suggests that the extra motion 1.1 at 3.3 Hz is worse for ITMY than ITMX. (This is pretty much the same as Camilla's plot, but with the ITMs plotted on top of each other).