louis.dartez@LIGO.ORG - posted 01:05, Wednesday 13 December 2023 - last comment - 09:04, Wednesday 13 December 2023(74771)
Follow up to LHO DARM modeling efforts
Gabriele, Sheila, Artem, Louis
Since Gabriele found low frequency noise (~4 Hz) non-linearly coupling into DARM at higher frequencies (~15-25 Hz) (see LHO:73937), Sheila & I have been working to prop up a dependable model of the DARM loop that can be used to estimate stability margins and offload actuation from ETMX L3 to L2 and L1. N.B. we're not 100% certain that the noise we're chasing is due to the ETMX ESD.
1. The DARM Model
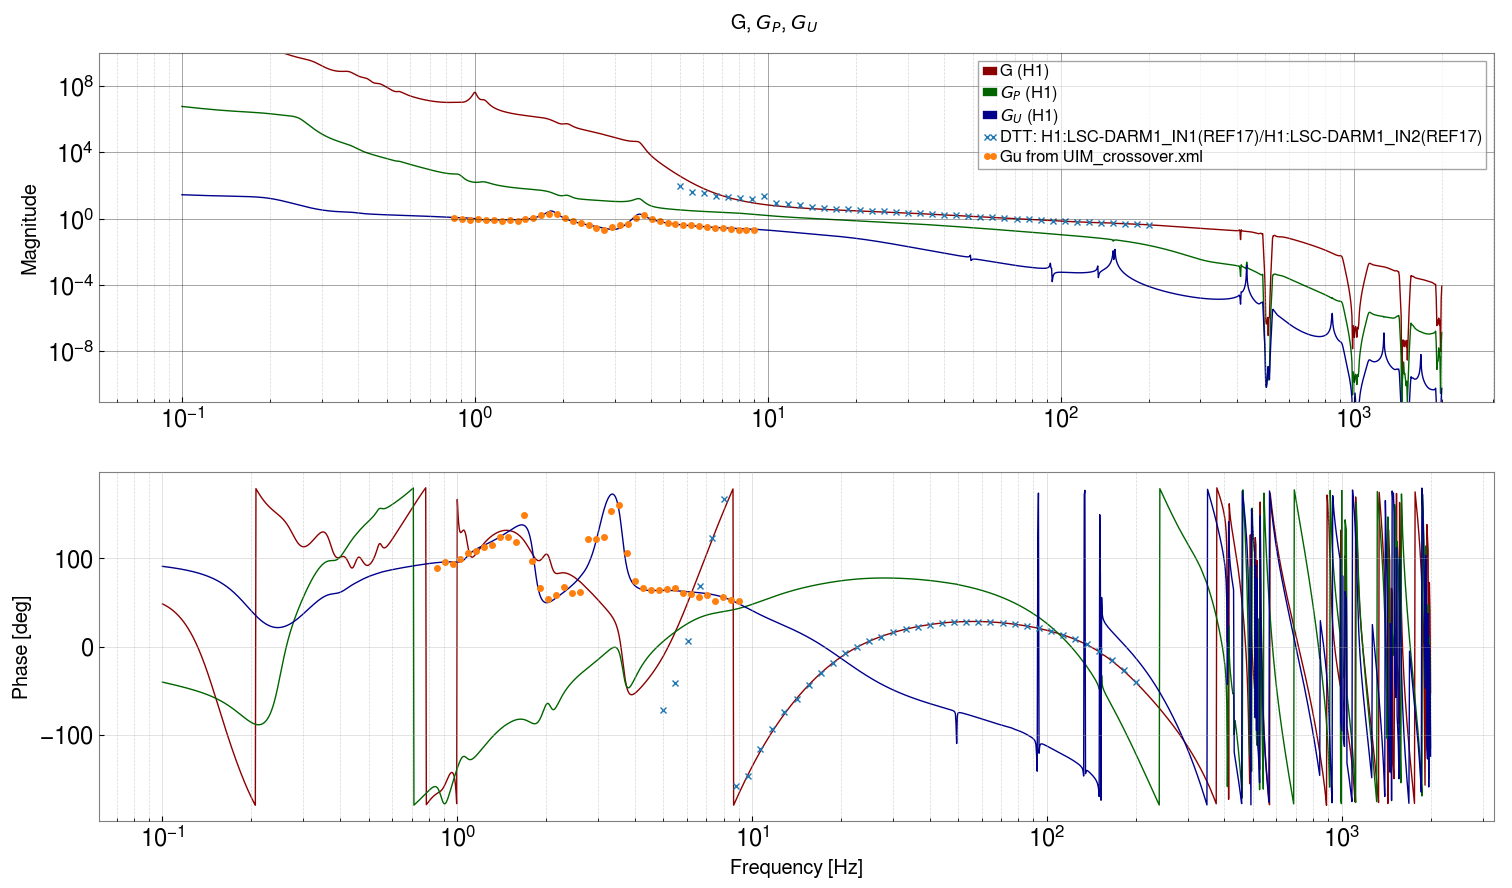
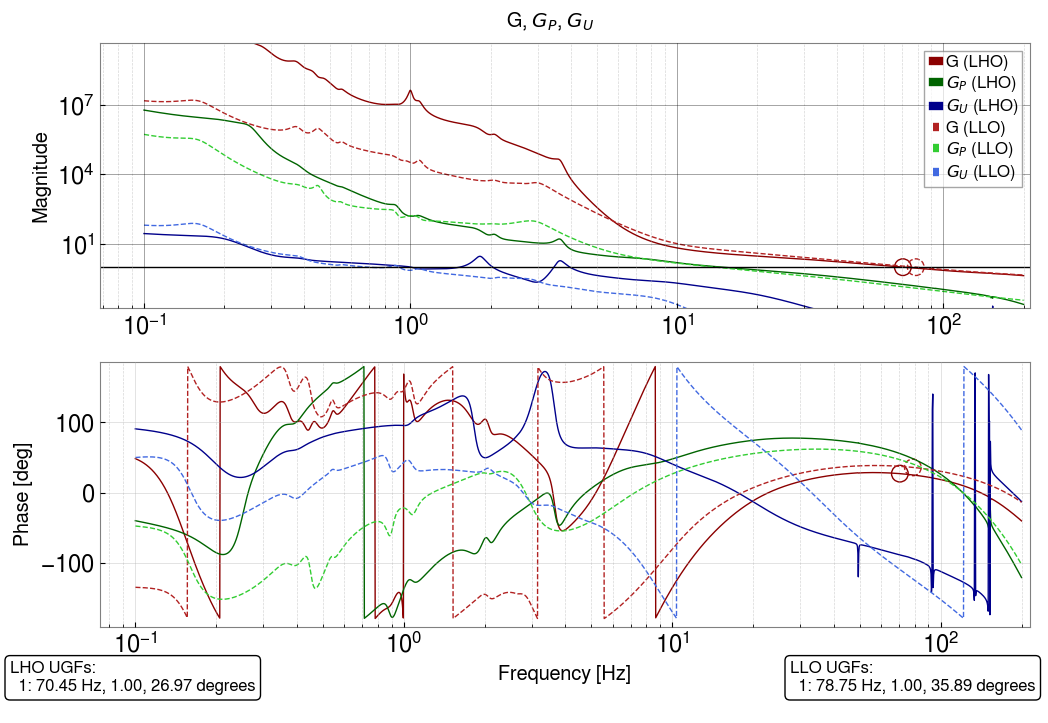
To estimate DARM loop stability, we've been primarily looking at modeling and directly measuring IN1/IN2 at the input to each stage's LOCK bank filter. IN1/IN2 at the input to the L3 LOCK bank filter (often measured as (IN1/EXC)/(IN2/EXC) so as to not be biased towards 1) is the open loop gain, G, of the DARM loop. We've been calling IN1/IN2 measured at the input to the L2 and L3 LOCK banks Gp and Gu, respectively. This is because they each behave somewhat like an effective open loop gain as measured at those points in the offloaded DARM loop. Similar to G, Gp, and Gu (the "OLGs"), we calculate the loop suppression, 1/(1-G), and the closed loop gain, G/(1-G), for each our three test points (G, Gp, and Gu) at the input of each ETMX LOCK bank filter.
Figure 1 above is a Bode plot of G, Gp, and Gu for the LHO DARM loop overlaid with measurements taken for G and Gu. The OLG, G, measurement was taken from a recent calibration swept sine and the measurement of Gu is courtesy of Sheila from LHO:74226. The two measurements shown for G and Gu match the model pretty well. There is some noise in the Gu measurement but the structure is in pretty good agreement between the model and the data. The measurement of G also matches pretty well but begins to deviate below 10 Hz. This is likely in large part due to error in fitting the sensing function, C, at low frequencies. It's worth noting that the UIM stage has multiple UGFs just below 2 Hz and 4 Hz; this is okay but not ideal.
We tried taking a measurement of Gp but we've been unable to get good agreement between the current DARM loop model and these measurements (this is mentioned in LHO:74264). We've only tried relatively low coherence measurements so far in this current sprint so we plan to get some better measurements of this soon to compare against the model. However, it's worth noting that the PUM has been a bear to model properly for a while (see for example the PUM discussion in LHO:63450). A few years ago Jenne successfully modeled length-to-pitch-to-length cross-coupling that matched data taken at the PUM stage (LHO:48738). In light of the recent modeling push, Sheila and I are have begun working to follow up on this work to include yaw in the hopes of modeling and suppressing this effect from coupling to DARM. More on that later as our current major goal is to reduce ETMX actuation as introduced at the top.
The Gu points in Figure 1 were calculated from a measurement of IN1/EXC at the input of the L2 stage LOCK bank filter. Direct measurement of Gu = IN1/IN2 was difficult due to low coherence. The relationship between Gu and IN1/IN2 is Gu = (IN1/EXC)/(1+(IN1/EXC)). See Section 4 of DCC:LIGO-T2300436 for a discussion on that relationship.
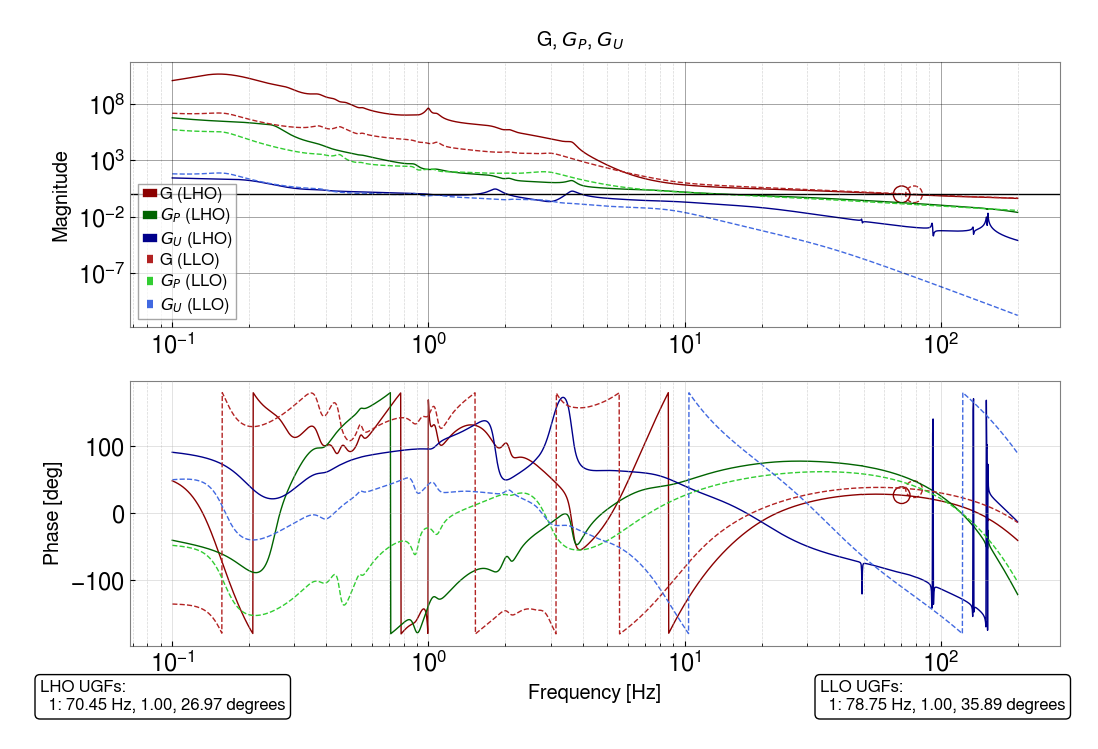
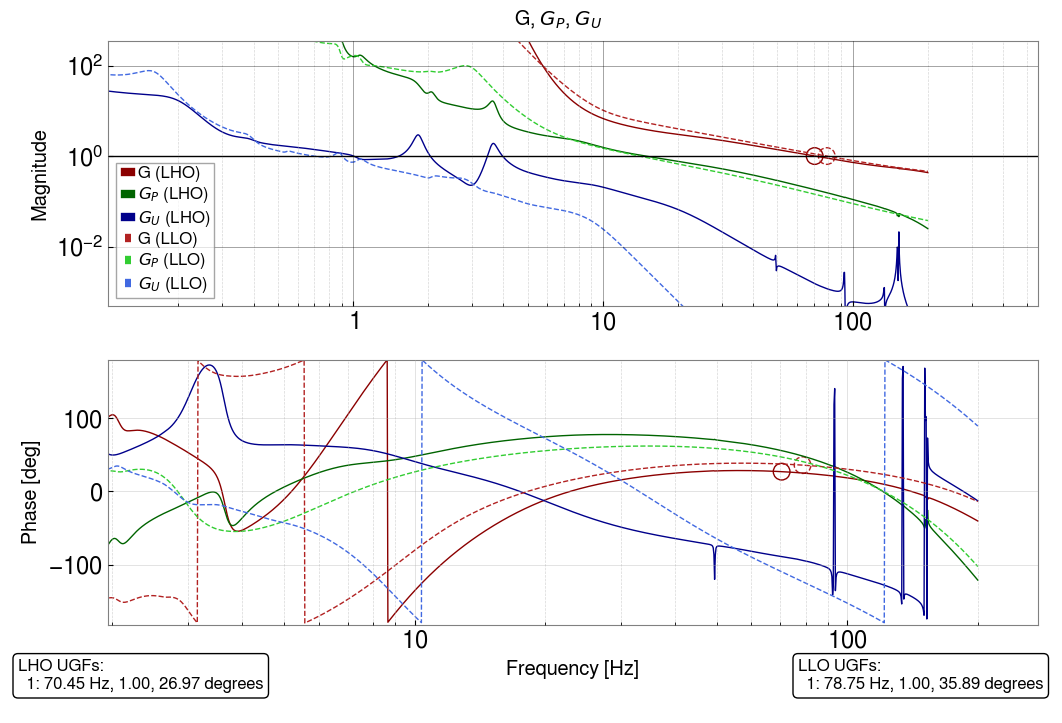
2. Comparison of LHO and LLO DARM Models
Here is a quick comparison of recent DARM loop models for LHO and LLO.
For searching purposes I'm writing their modeled OLG UGFs:
LHO UGFs:
1: 70.45 Hz, 26.97 degrees
LLO UGFs:
1: 78.75 Hz, 35.89 degrees
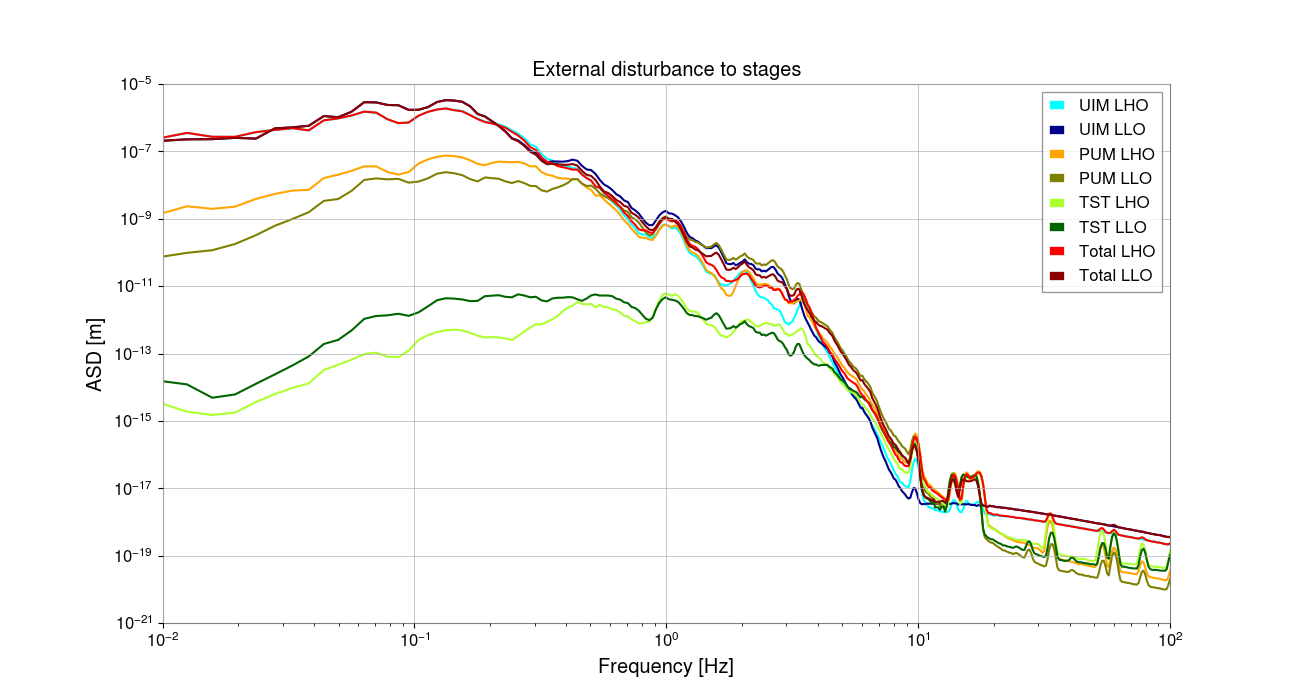
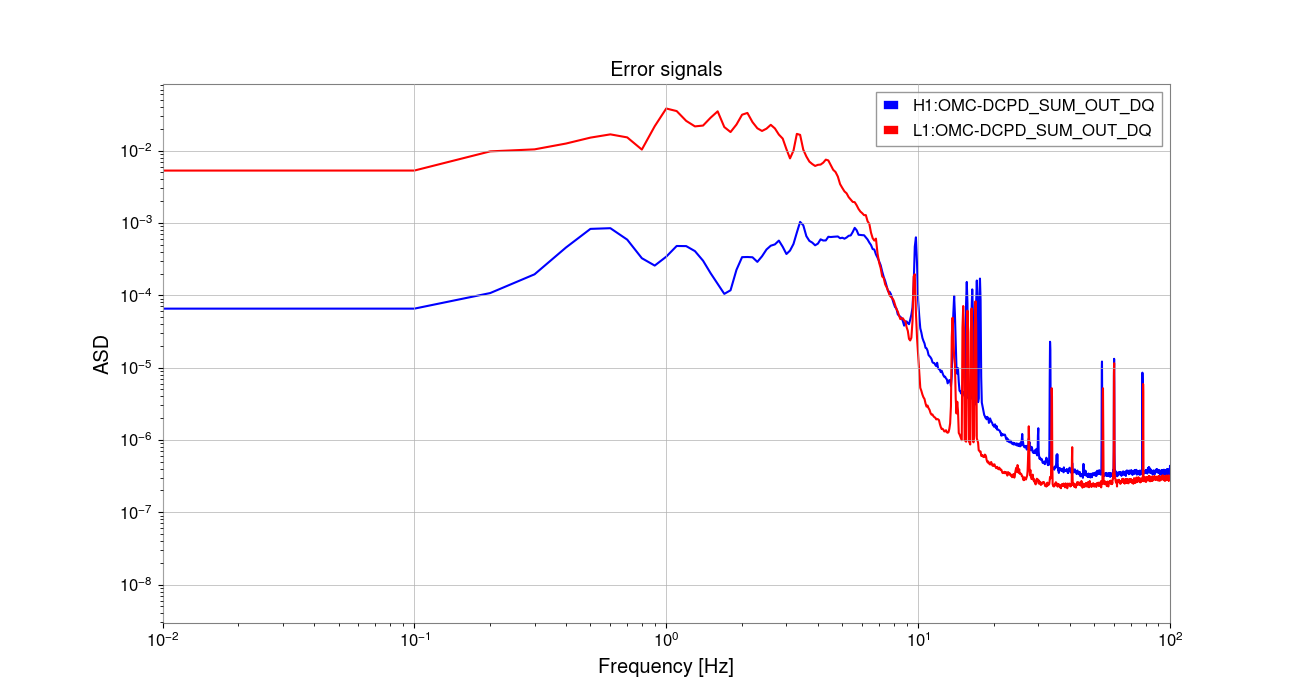
The DARM OLG magnitudes between LLO and LHO differ at low frequencies by roughly 3 orders of magnitude near 1Hz. Here's an even higher zoom near 1Hz: LHO_LLO_comparison_OLG_super_zoom_low_freq.png. As an independent check into whether that makes sense, Artem pulled up the external disturbance sent to each actuation stage at both sites using CAL-DELTAL_CTRL_{UIM,PUM,TST}_DBL_DQ and saw that they're similar between LLO and LHO (direct link to this plot). Then he looked at the LHO and LLO error signals and found a discrepancy of 2 orders of magnitude in the expected direction (direct link to this plot). So that all seems to roughly track, which is great news. See LHO:74744 for Artem's discussion.
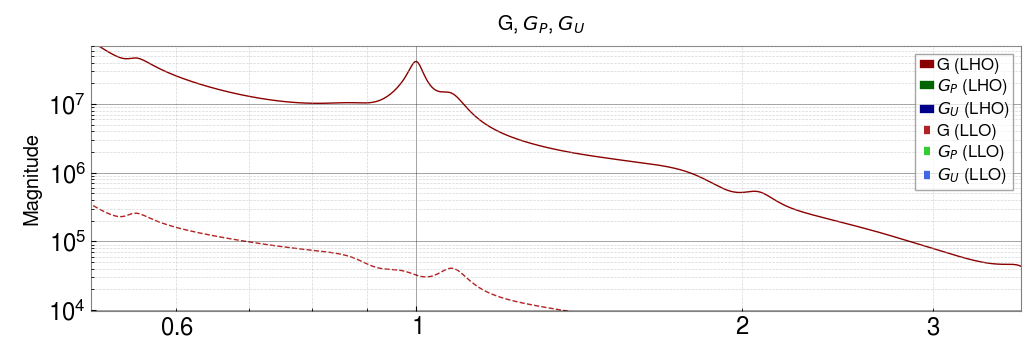
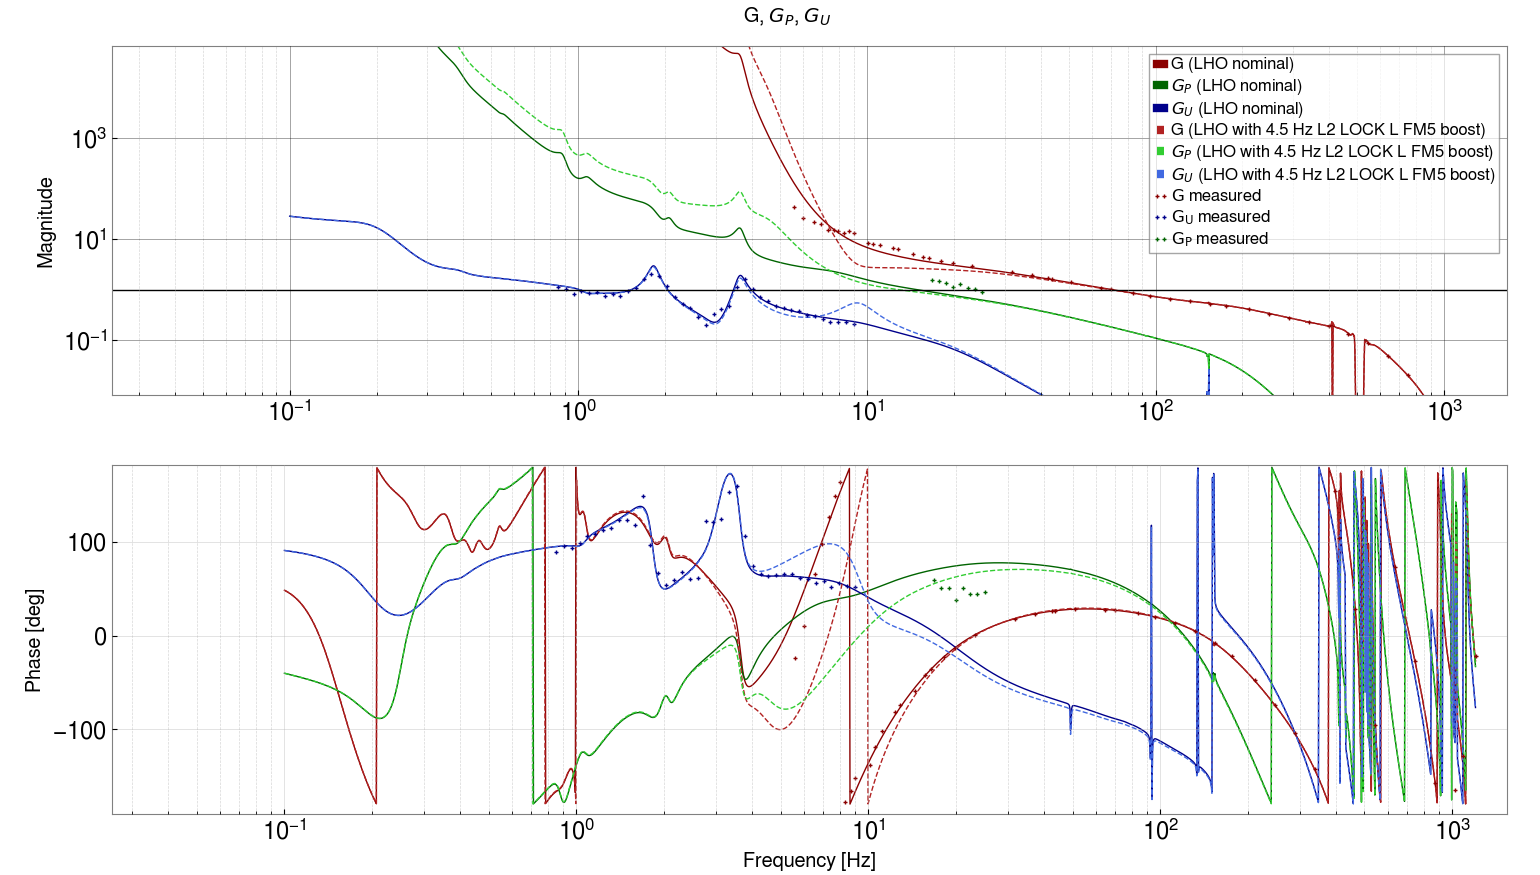
3. Instability of 4.5Hz boost filter not predicted by DARM model
In LHO:74226, Sheila tried engaging a L2 LOCKL FM2, "boost4.5", which caused a lockloss. She successfully engaged the boost without a lockloss the day before just before the Tuesday maintenance period.
Here is a comparison of the LHO model with and without this boost engaged.
The hope was that we would look at the model with the boost included and be able to confirm that the resultant loop configuration is unstable. However, we aren't able to point to anything that obviously indicates that that's the case. The corresponding loop suppression plot shows some peaking near 10Hz but nothing that would have us consider it a smoking gun.
=====
So the DARM modeling efforts are progressing but there is still much to do..
Images attached to this report
Comments related to this report
louis.dartez@LIGO.ORG - 09:04, Wednesday 13 December 2023 (74780)
after discussing a bit with Gabriele this morning and taking a closer look at the scenario with the 4.5Hz boost applied, I think I was too quick to suggest that the instability disagrees with the model.

1. There is some minor gain peaking the TST stage near 10Hz with the boost applied compared to the nominal state.
2. Gp inches closer to unity at 10Hz. Given that we already don't trust the Gp model right now, this could put us close enough to unity to cause issues at 10Hz, which is also where the phase goes to 0.
3. OLG also starts to dip to unity near 10Hz.

all this together may actually suggest that the loop with the 4.5Hz boost engaged, or the transition from the nominal state to the new state with the boost engaged, could be unstable. So perhaps Sheila's experience with having the boost be fine one day and cause a lockloss the next day is consistent with the model afterall.