Camilla, Naoki, Sheila, Nutsinee
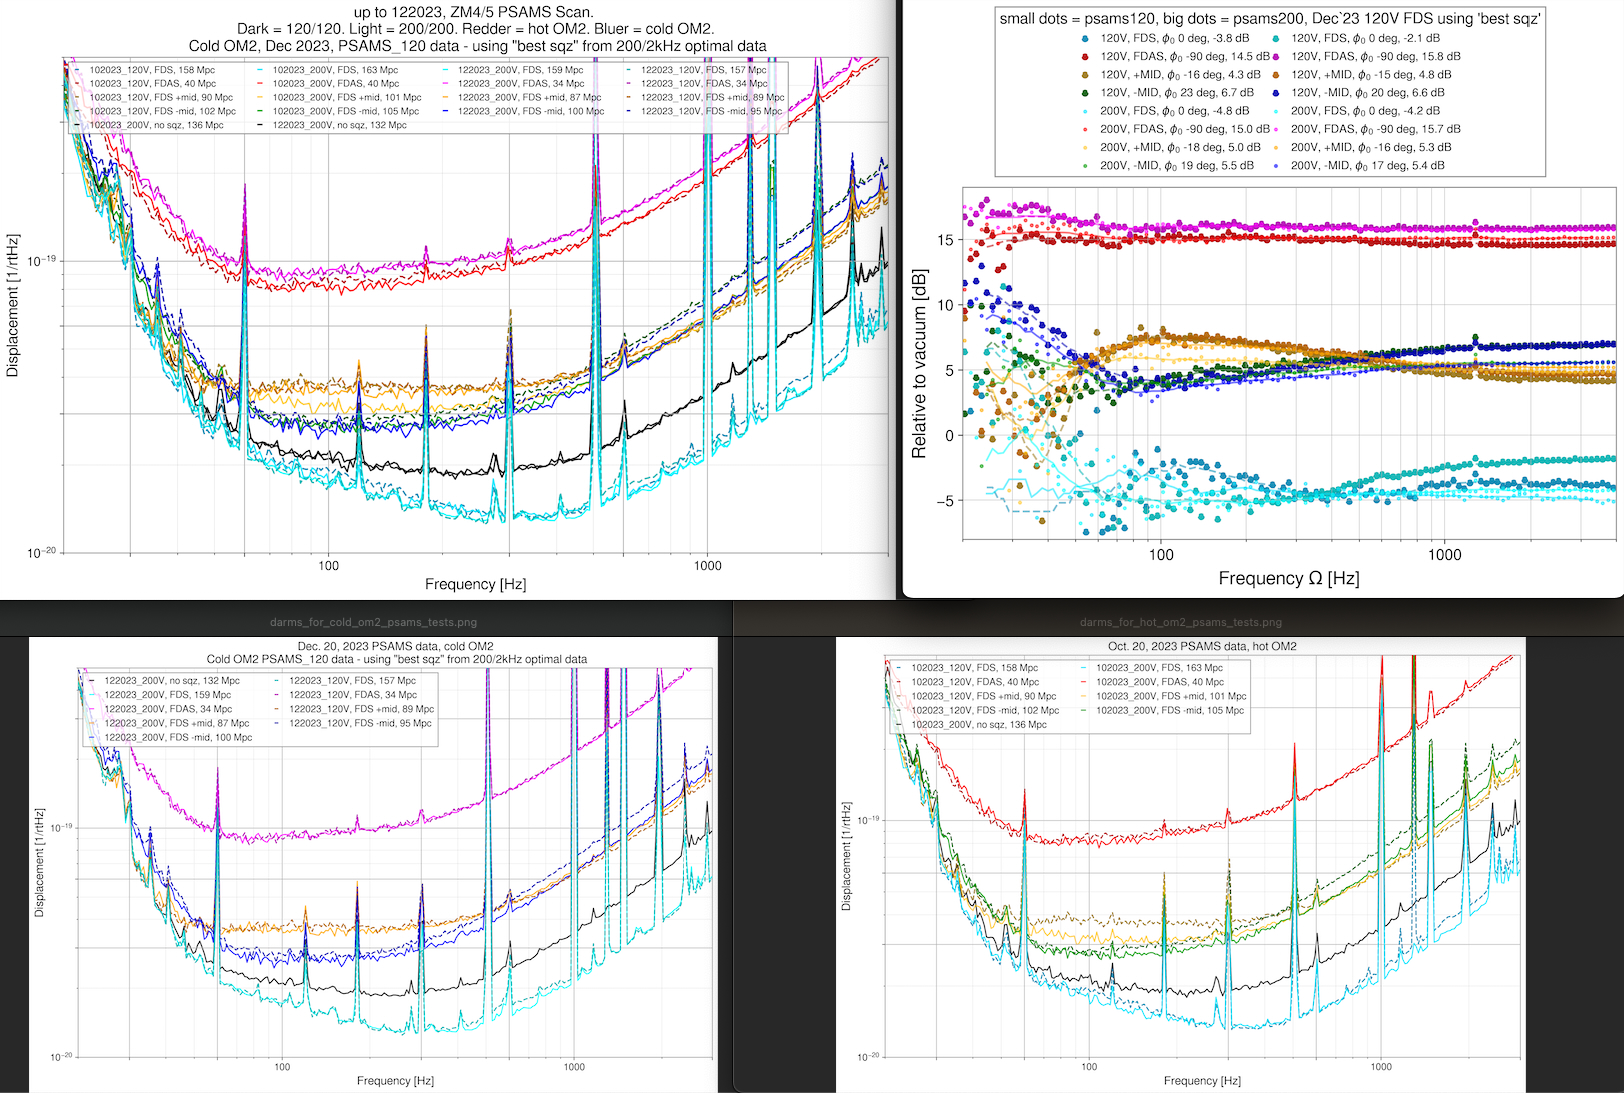
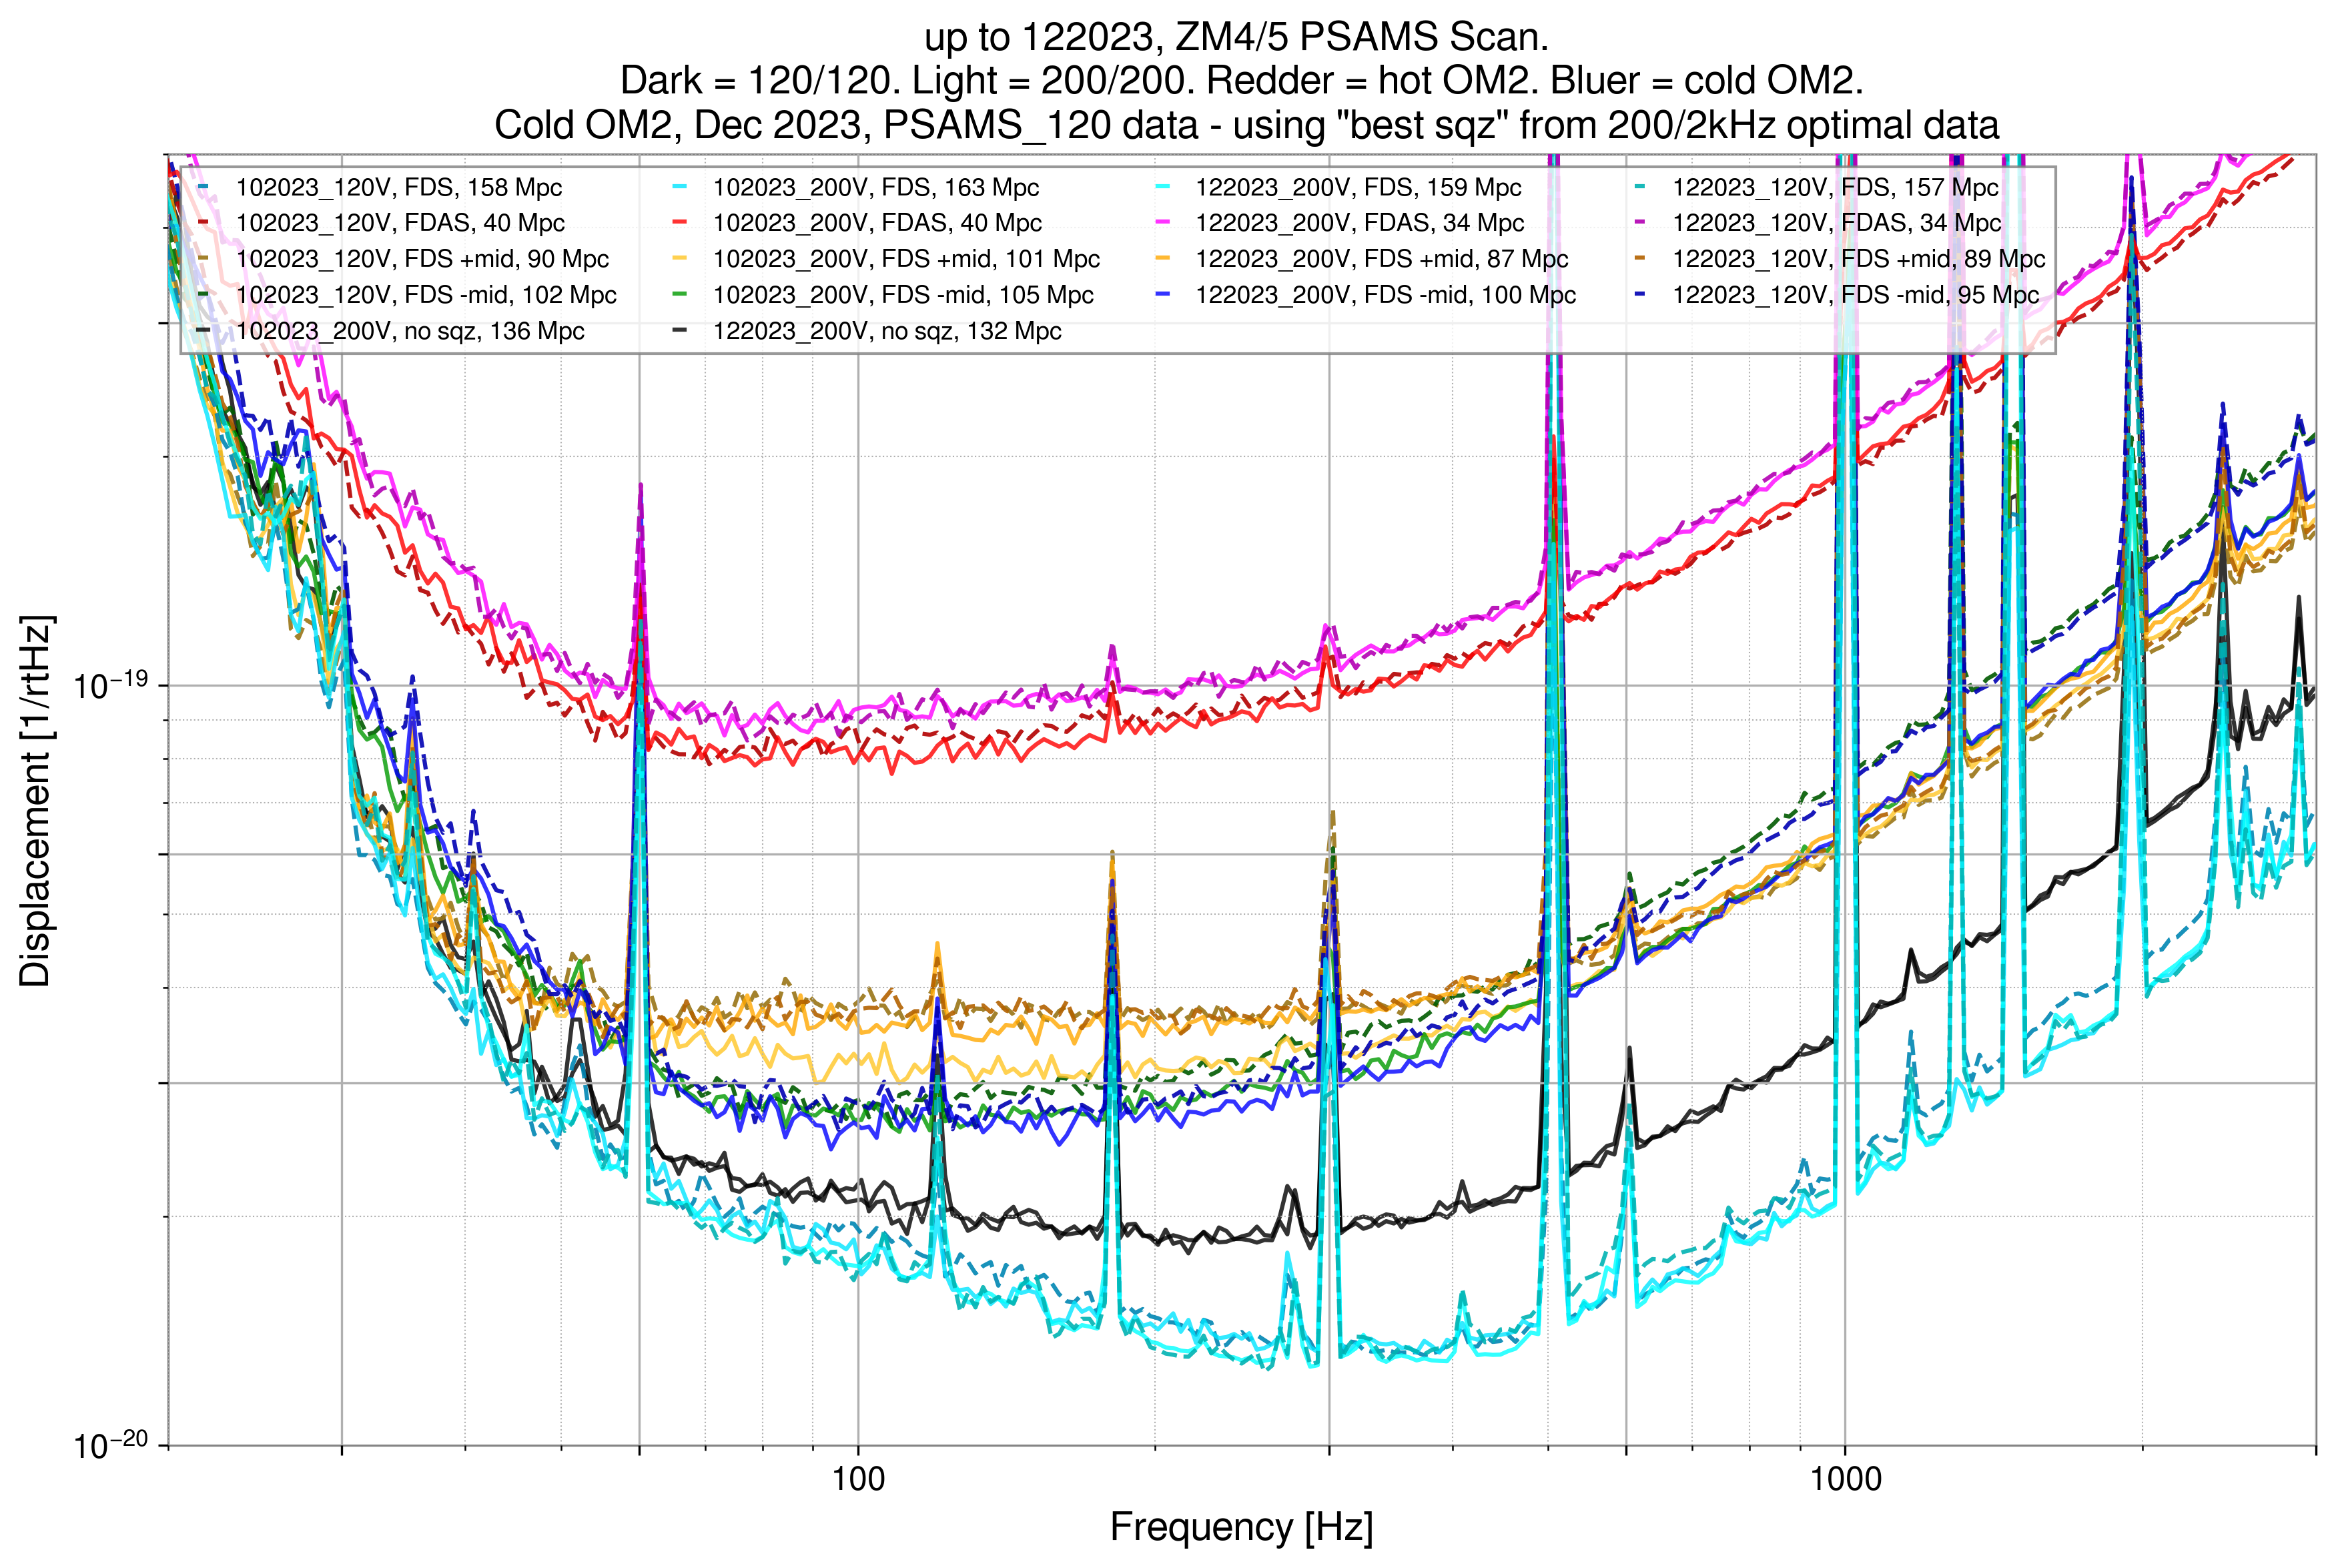
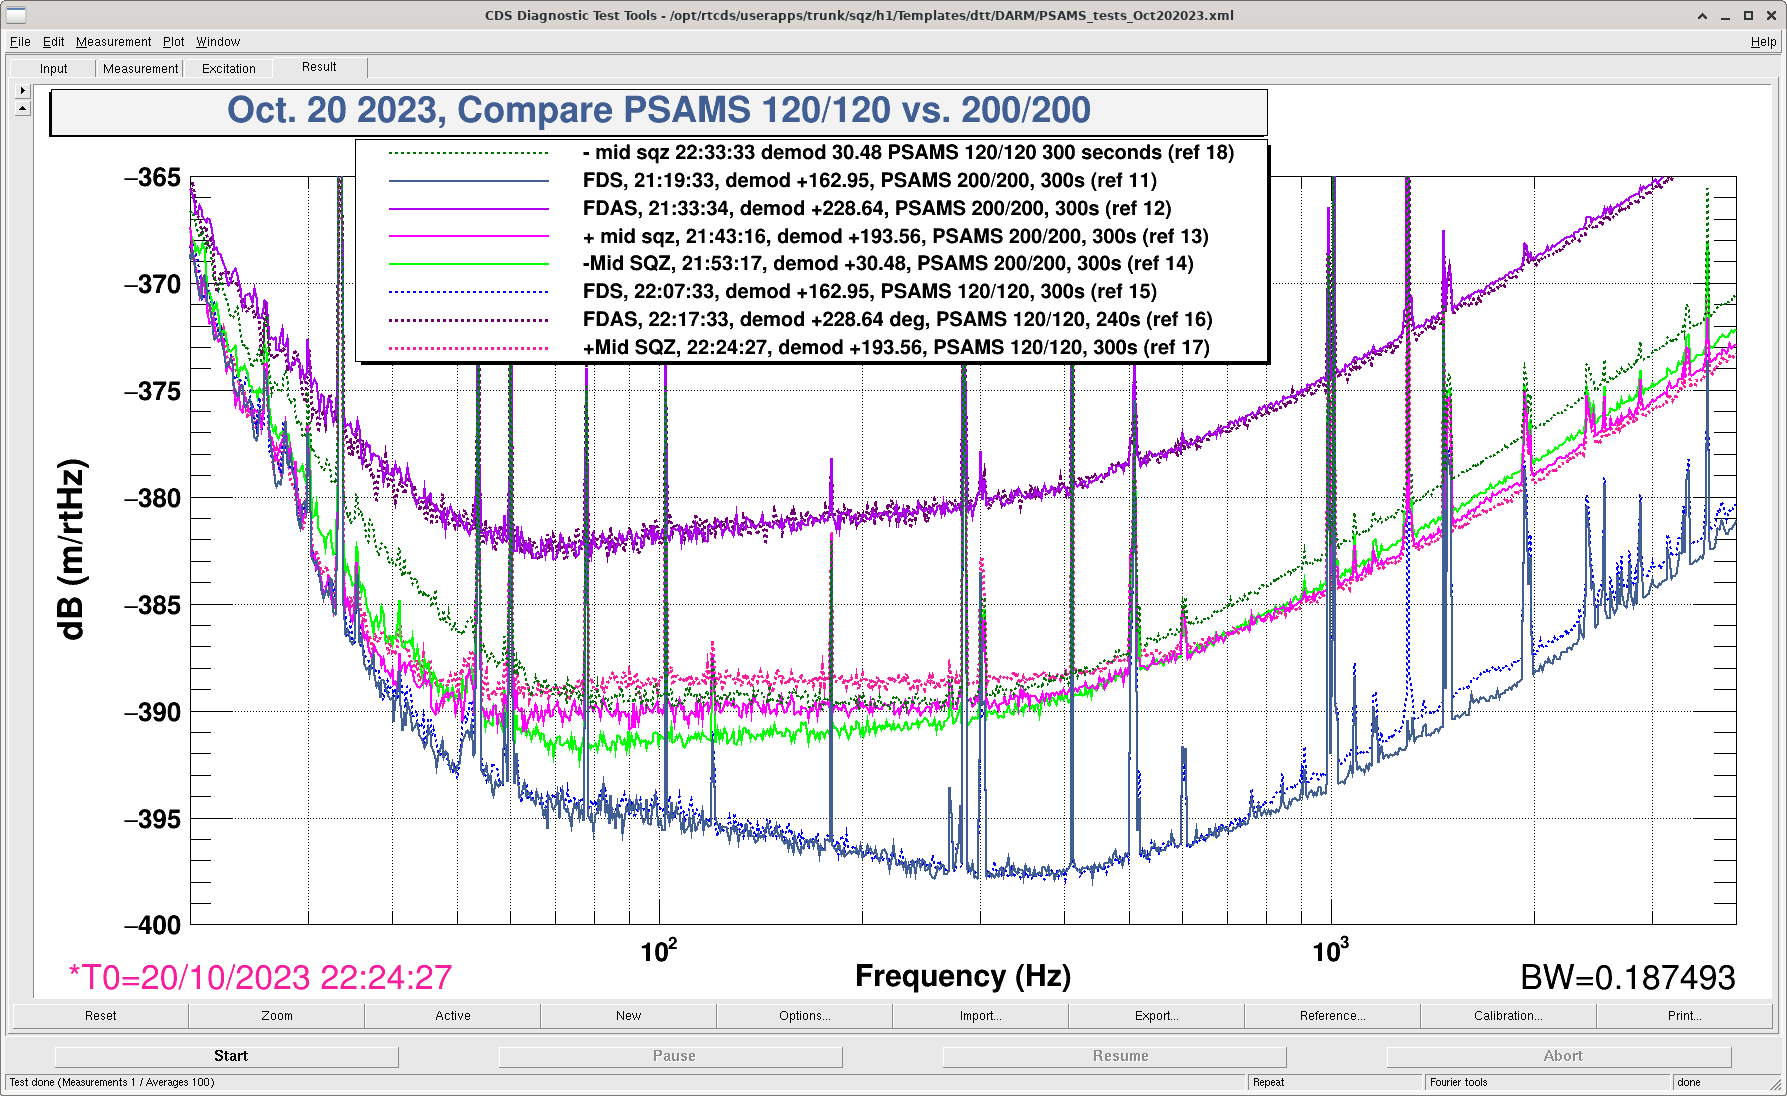
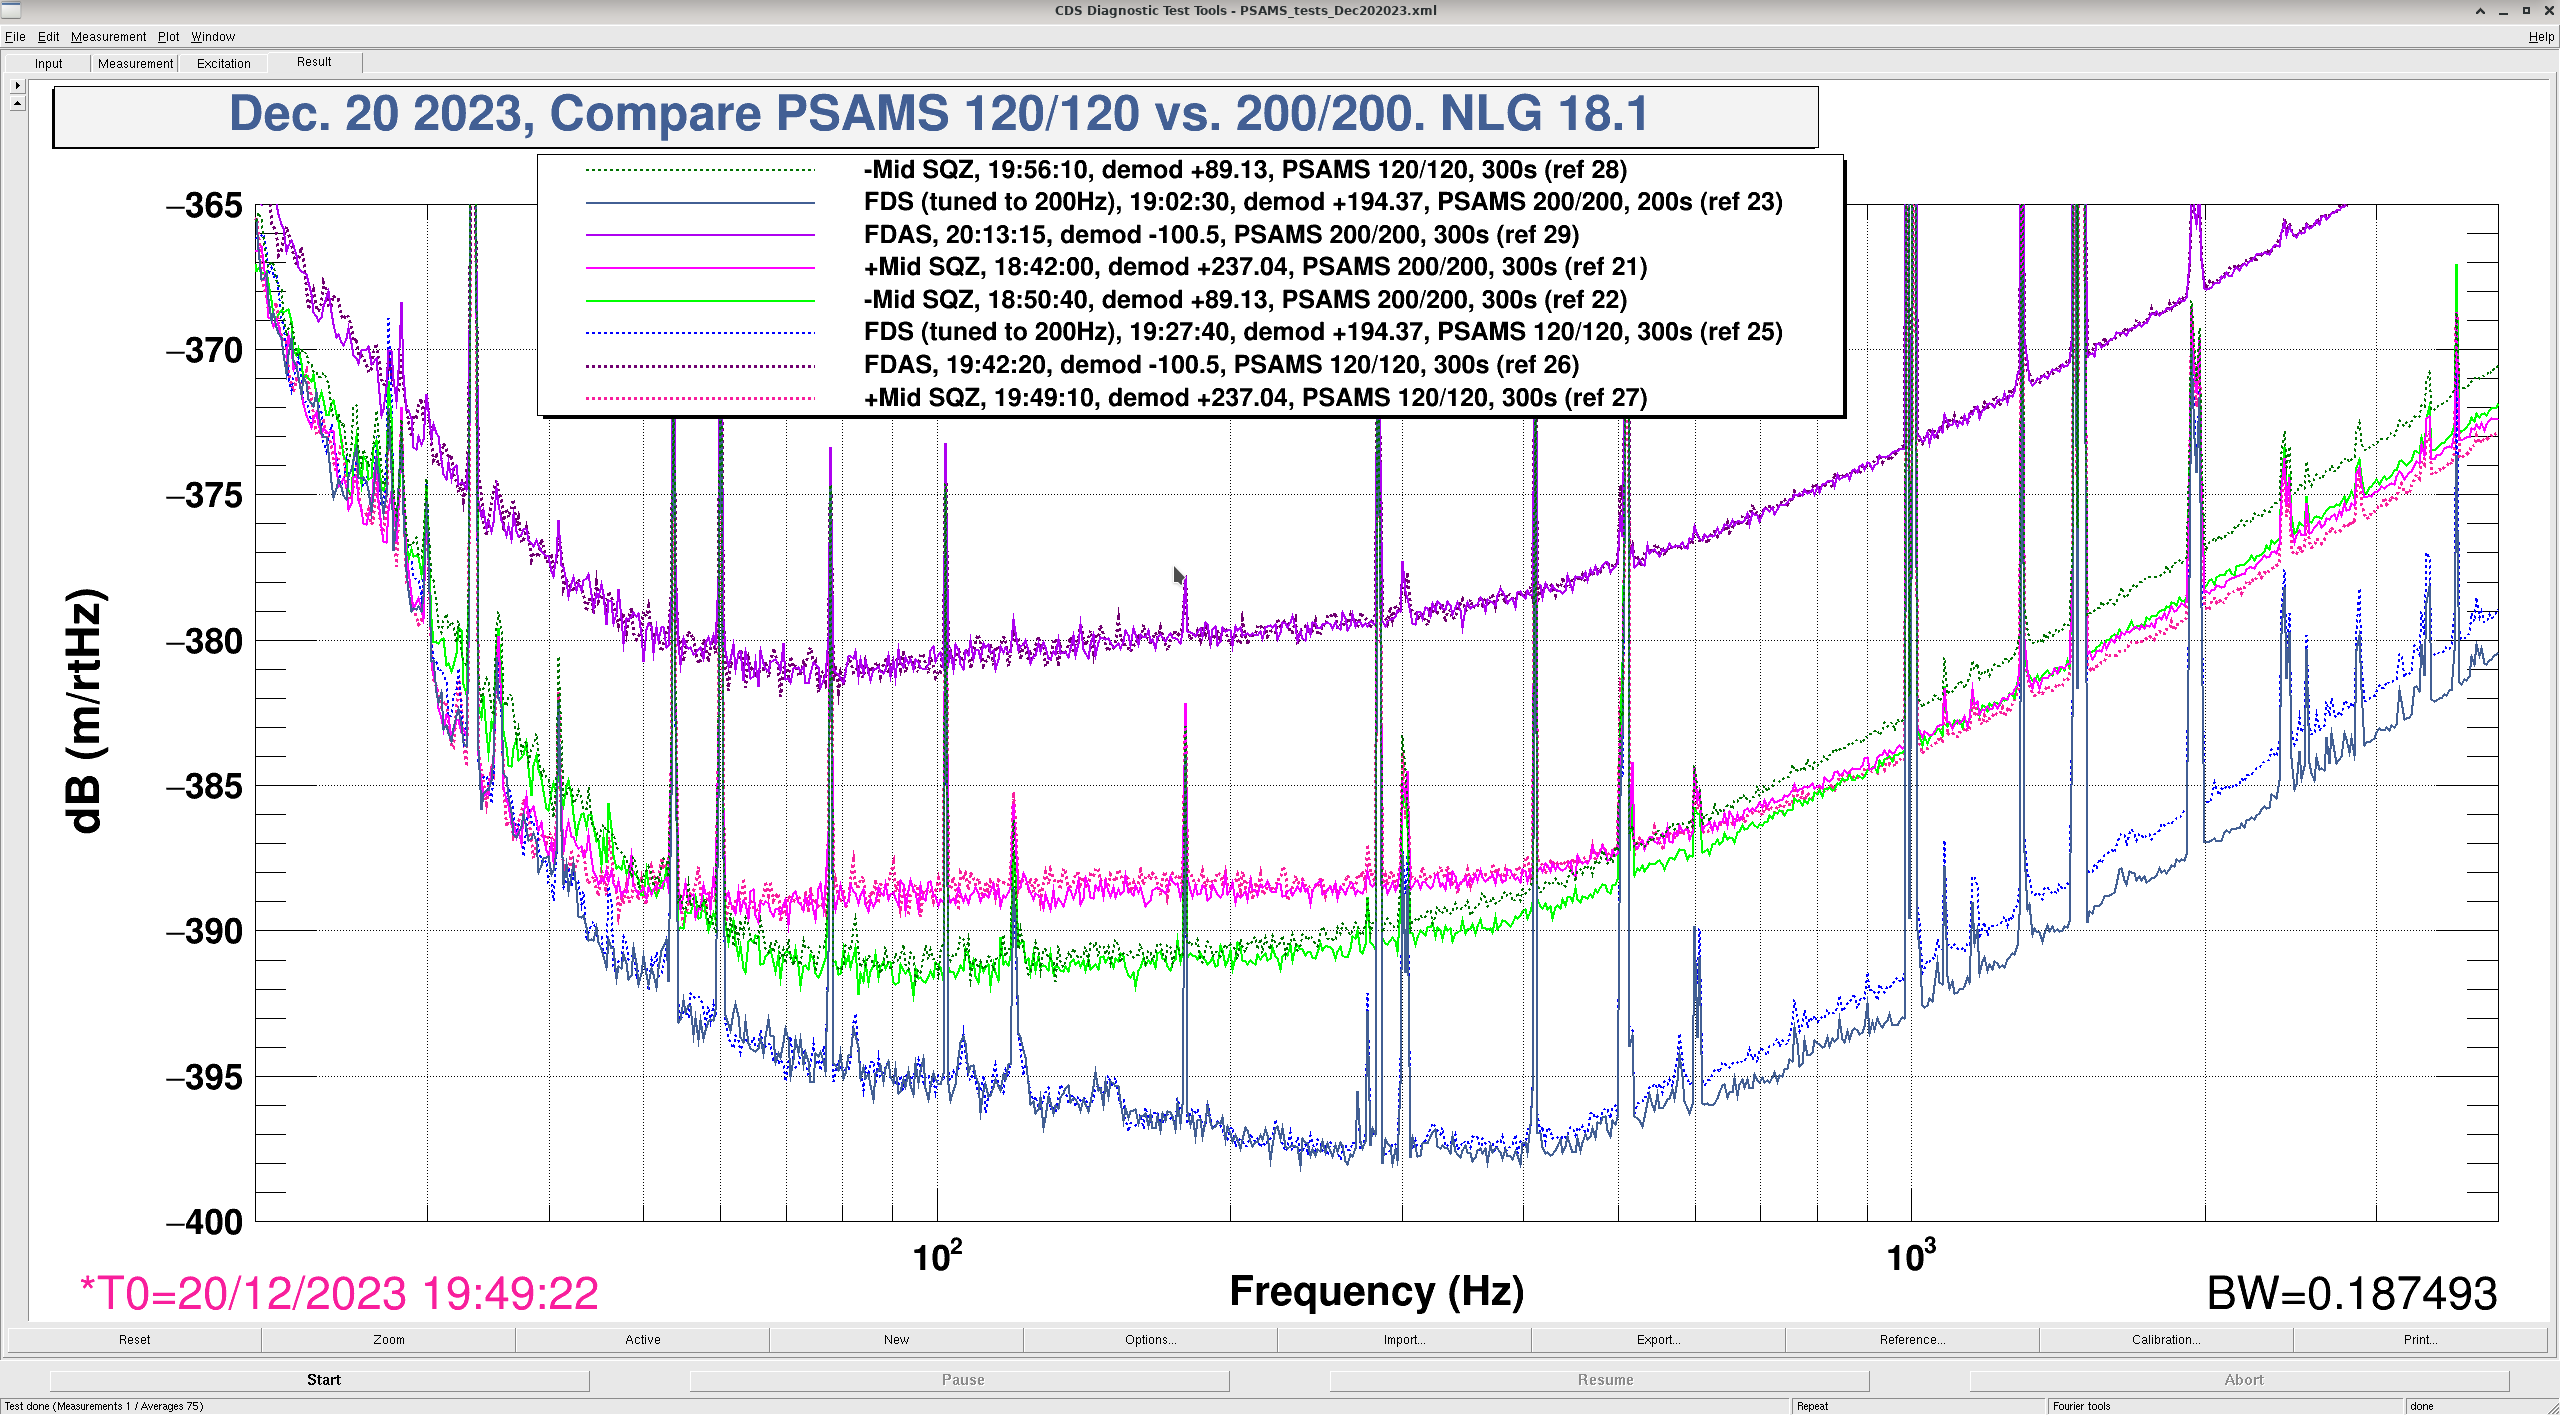
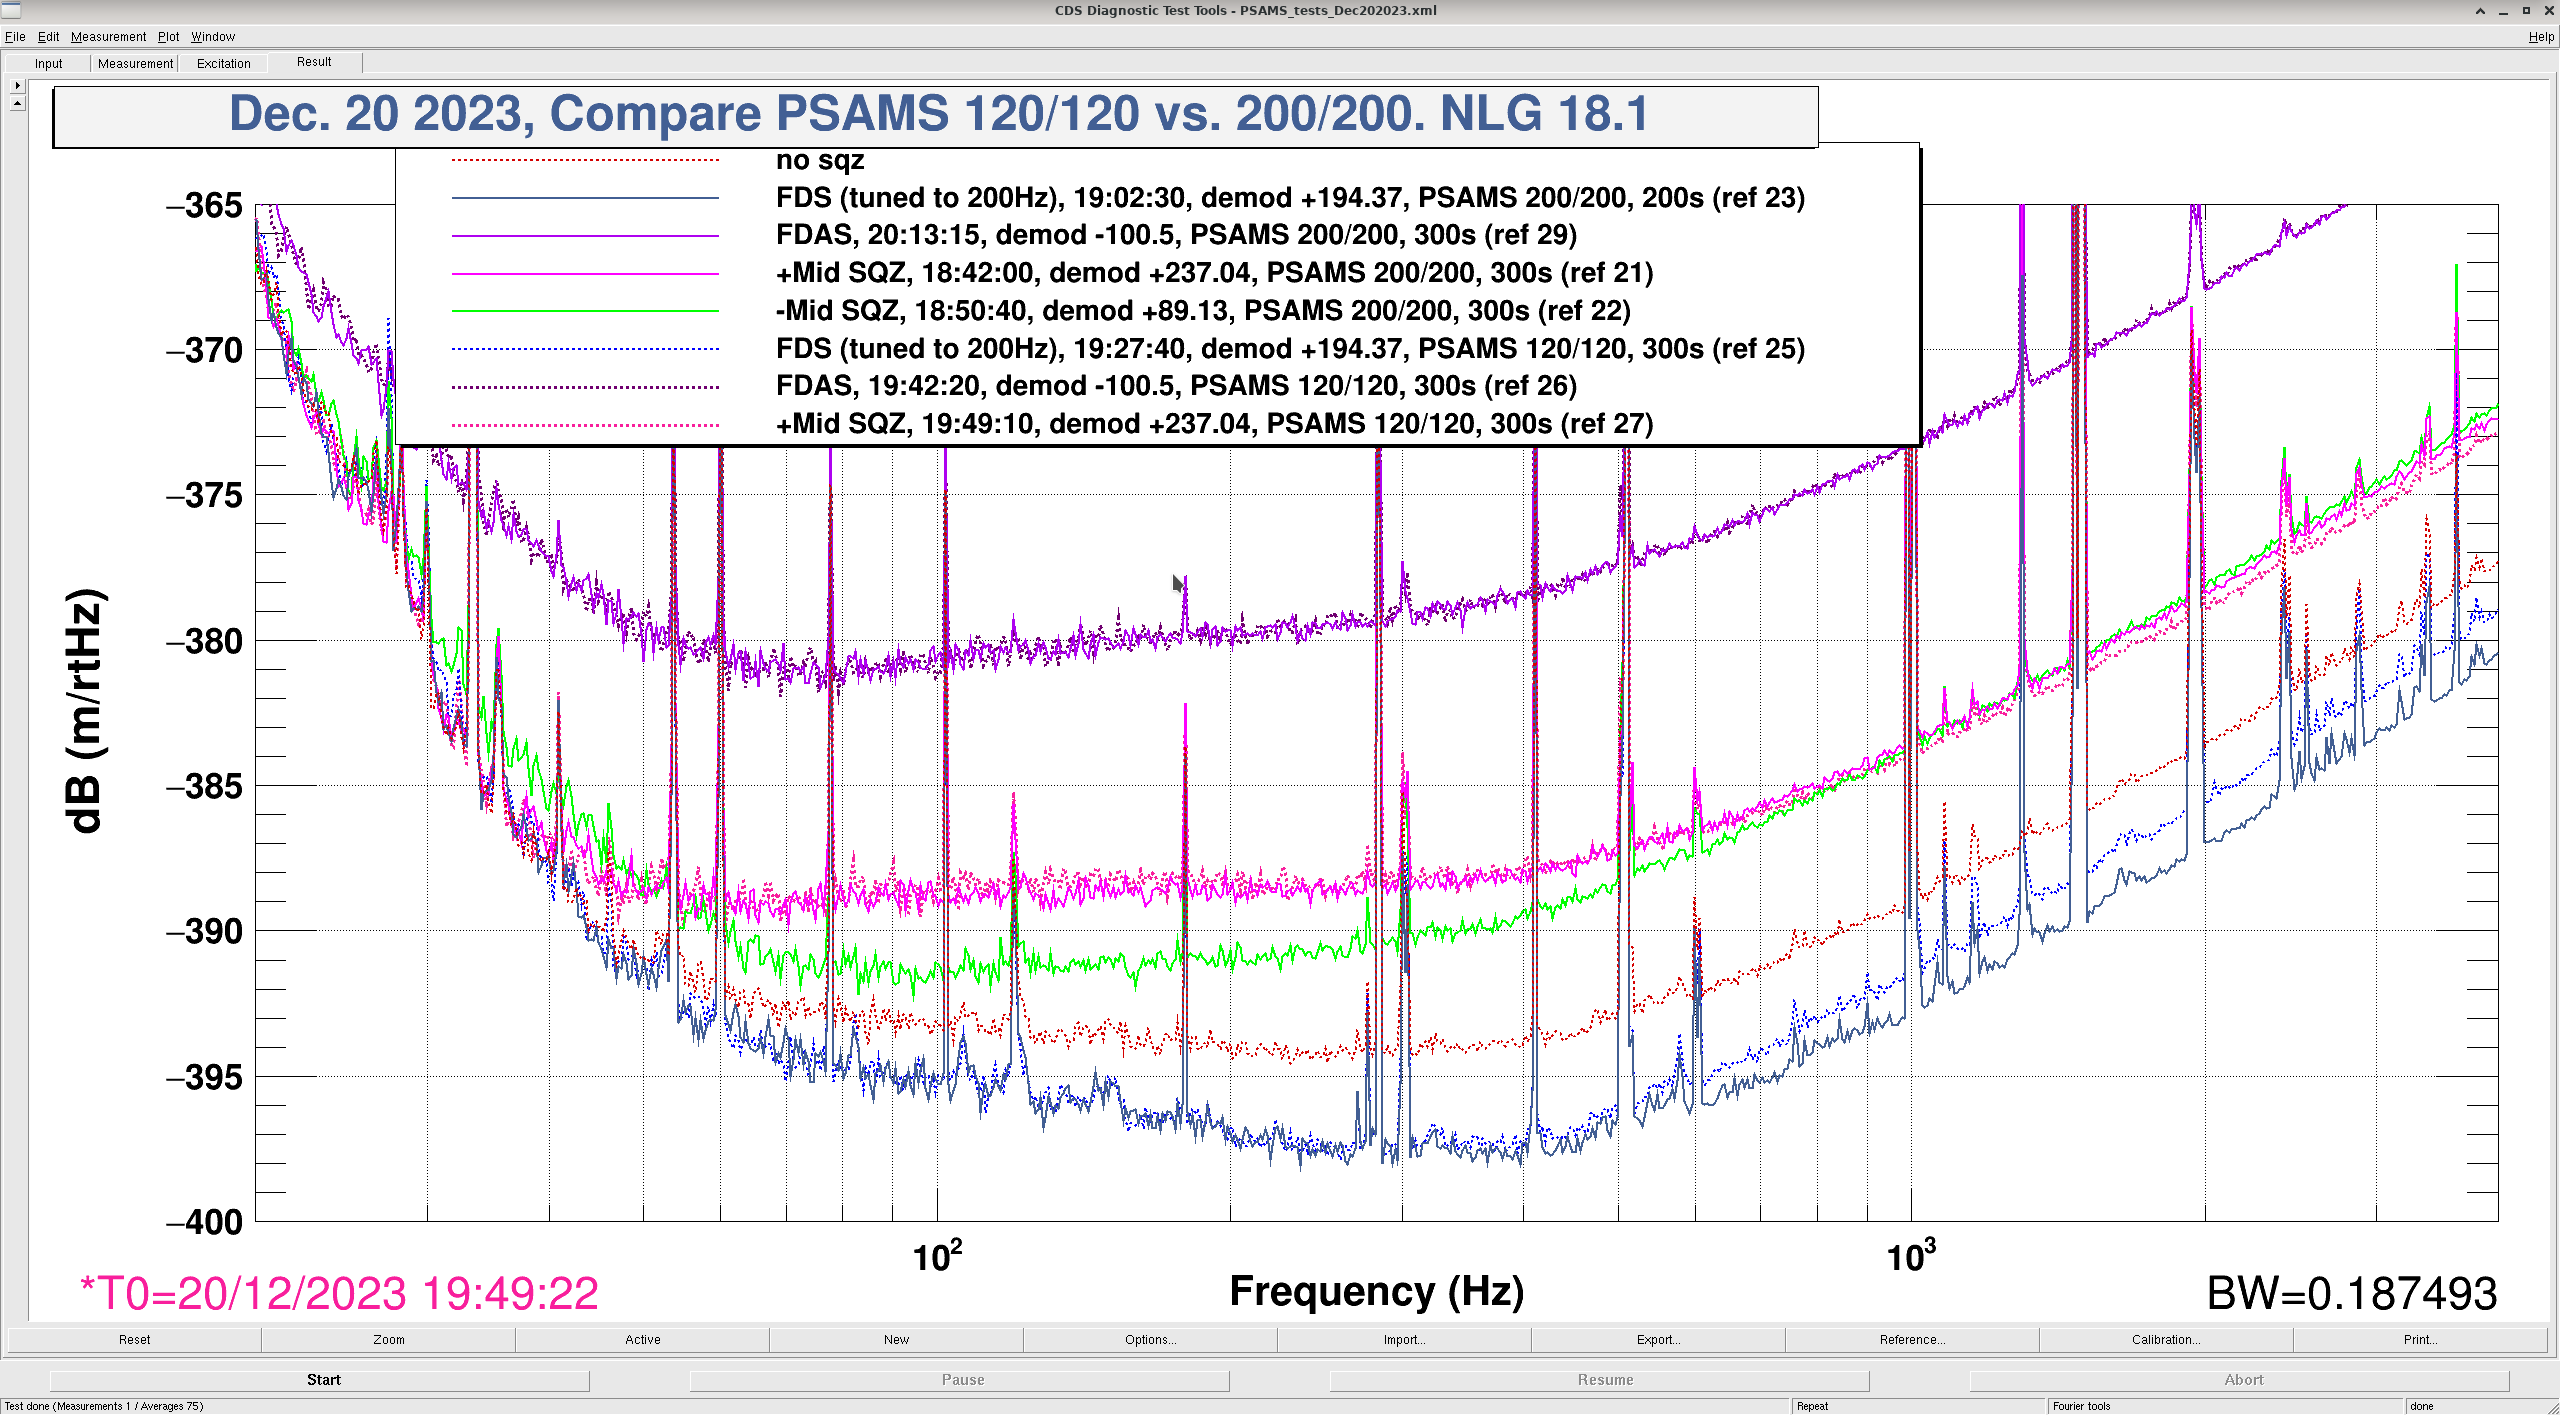
We did a repeat of the measurement set from 73621 with OM2 cold. For a summary, Camilla's plot shows 200V/200V PSAMs setting with solid lines and 120V/120V as dashed lines. There is a stronger frequency dependence for the 120V/120V settings, which confirms what we saw with OM2 hot, that 200V/200V has better mode matching and less frequency dependent SQZ rotation. (This plot is a direct comparison to October's data. )
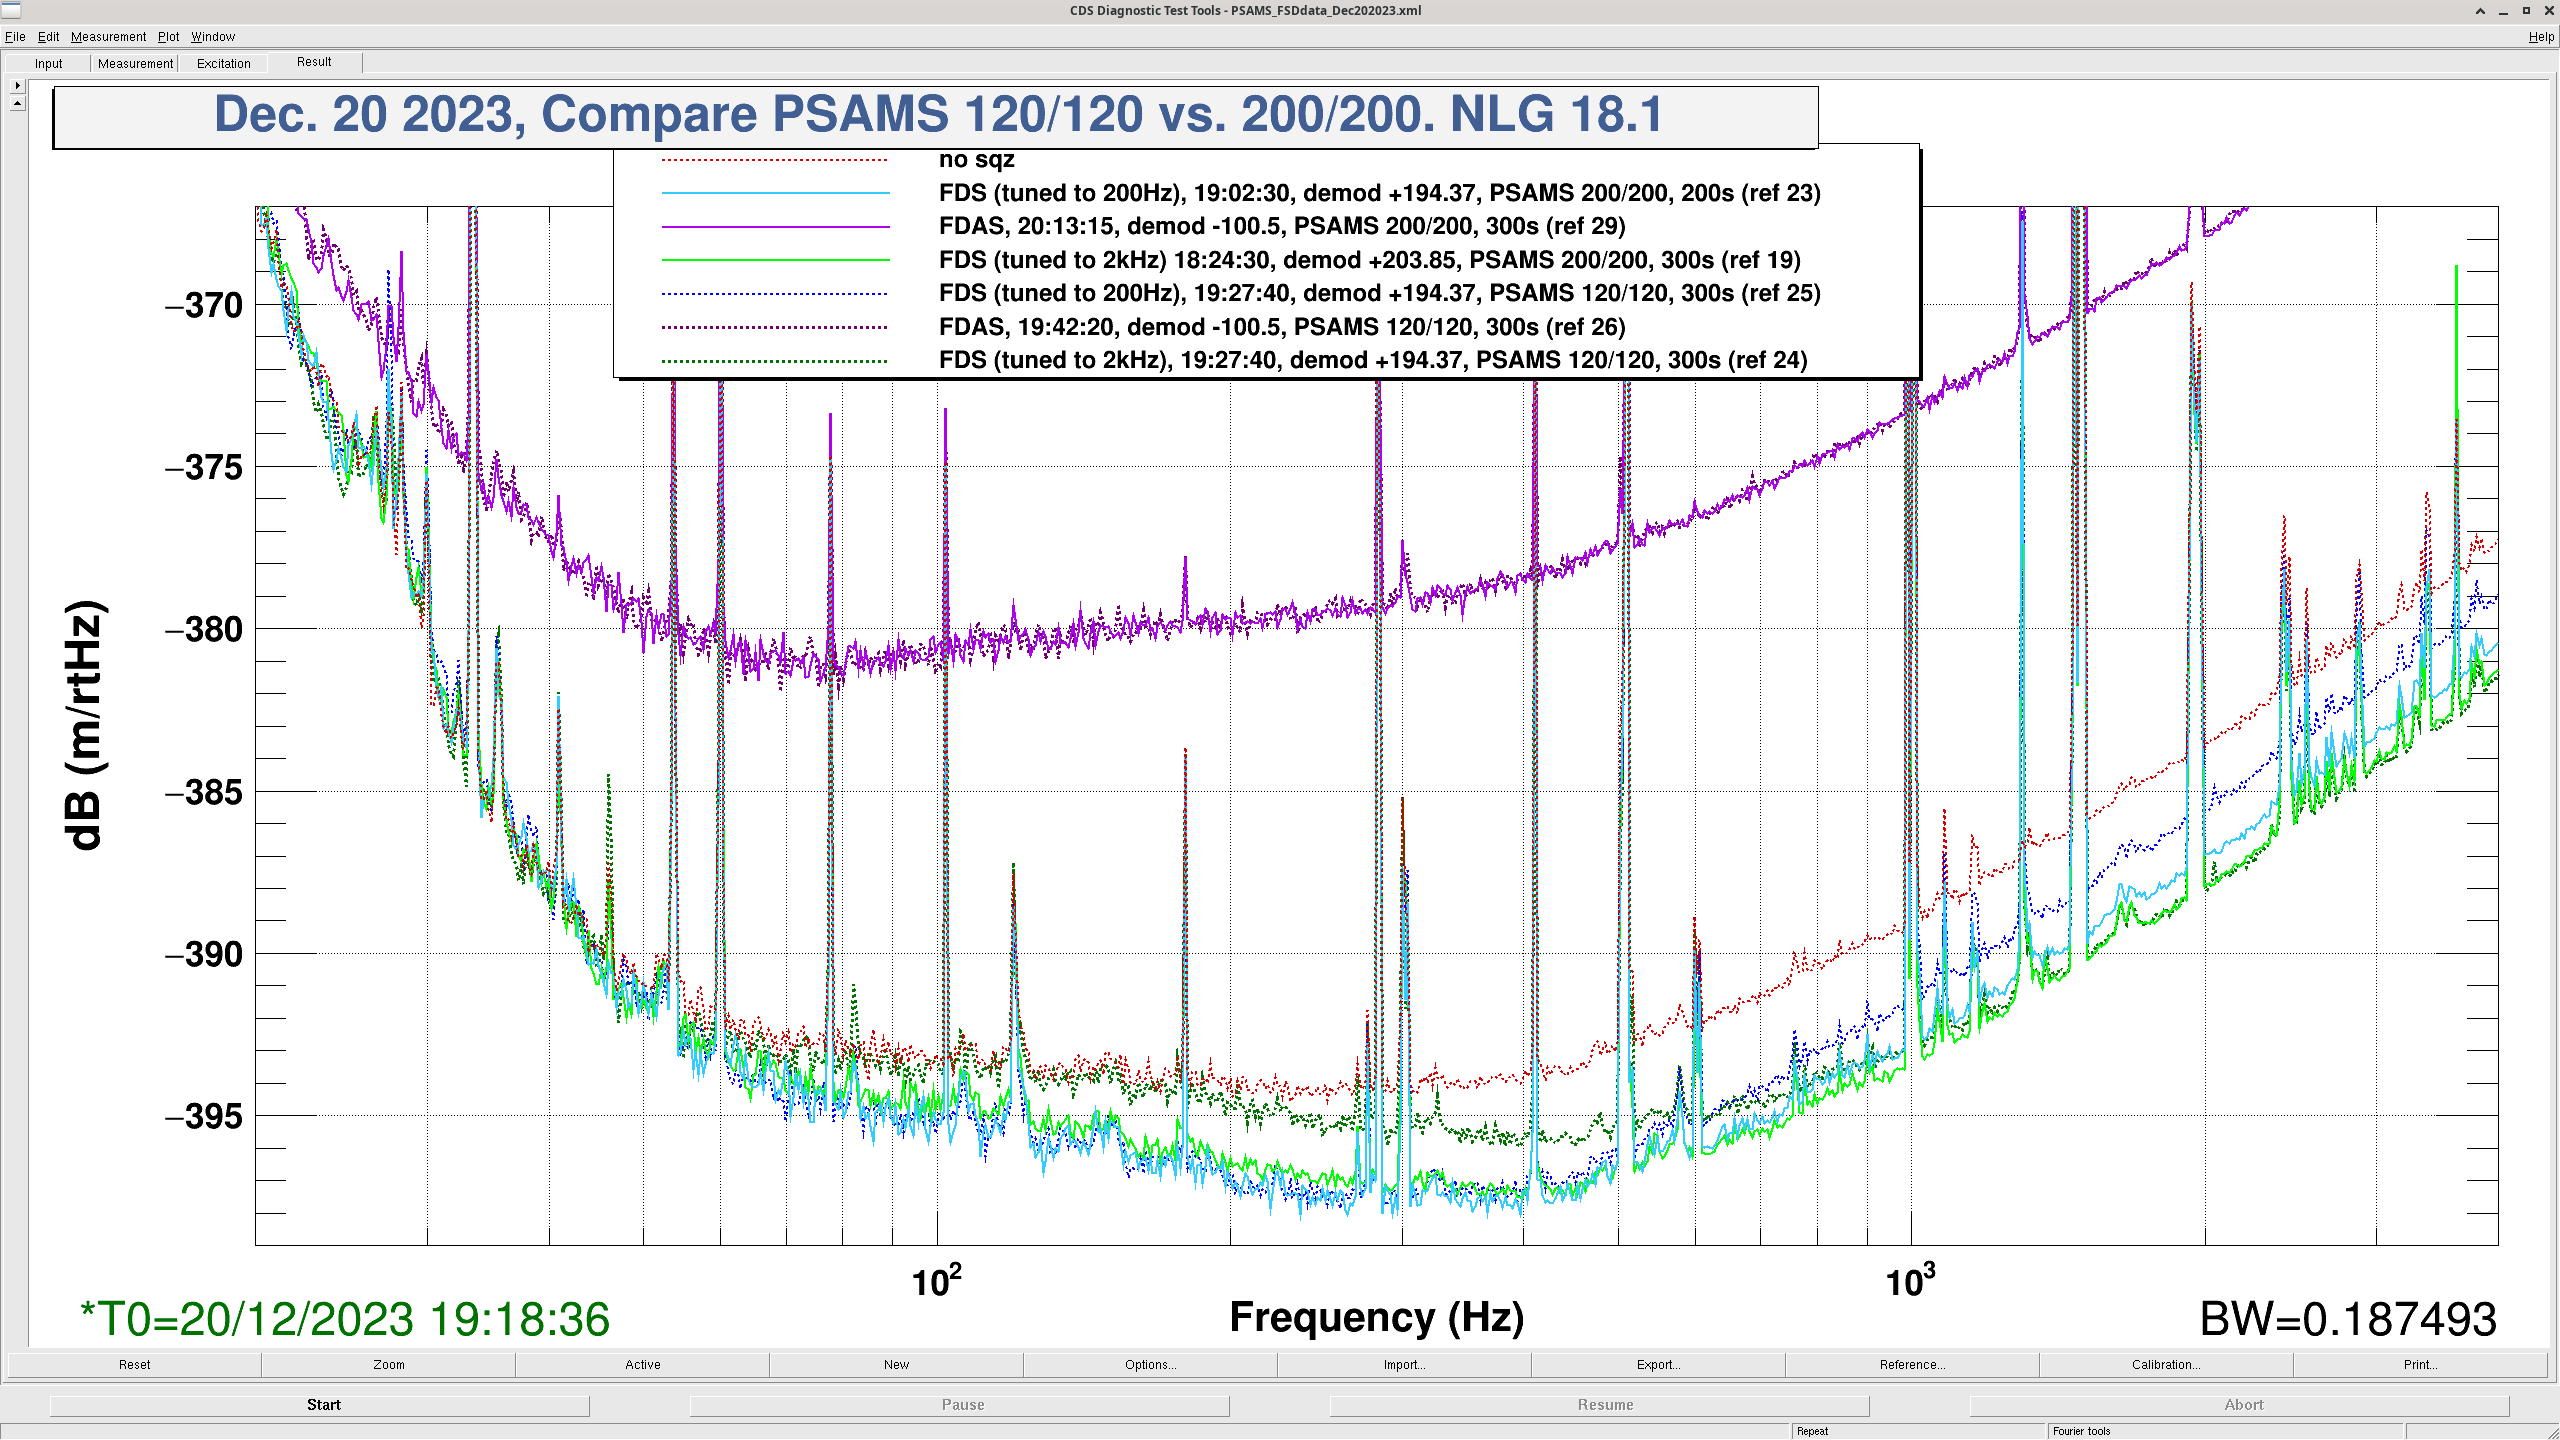
The third attachment is a plot that shows that the squeezing angle that maximizes the squeezing at 2kHz is not the same as the one that maximizes the squeezing at 200Hz, (green traces are optimized for 2kHz, blue traces are optimized for 200Hz, solid is 200V/200V and dashed is 120V/120V), you can see that the frequency dependence is larger for 120V/120V.
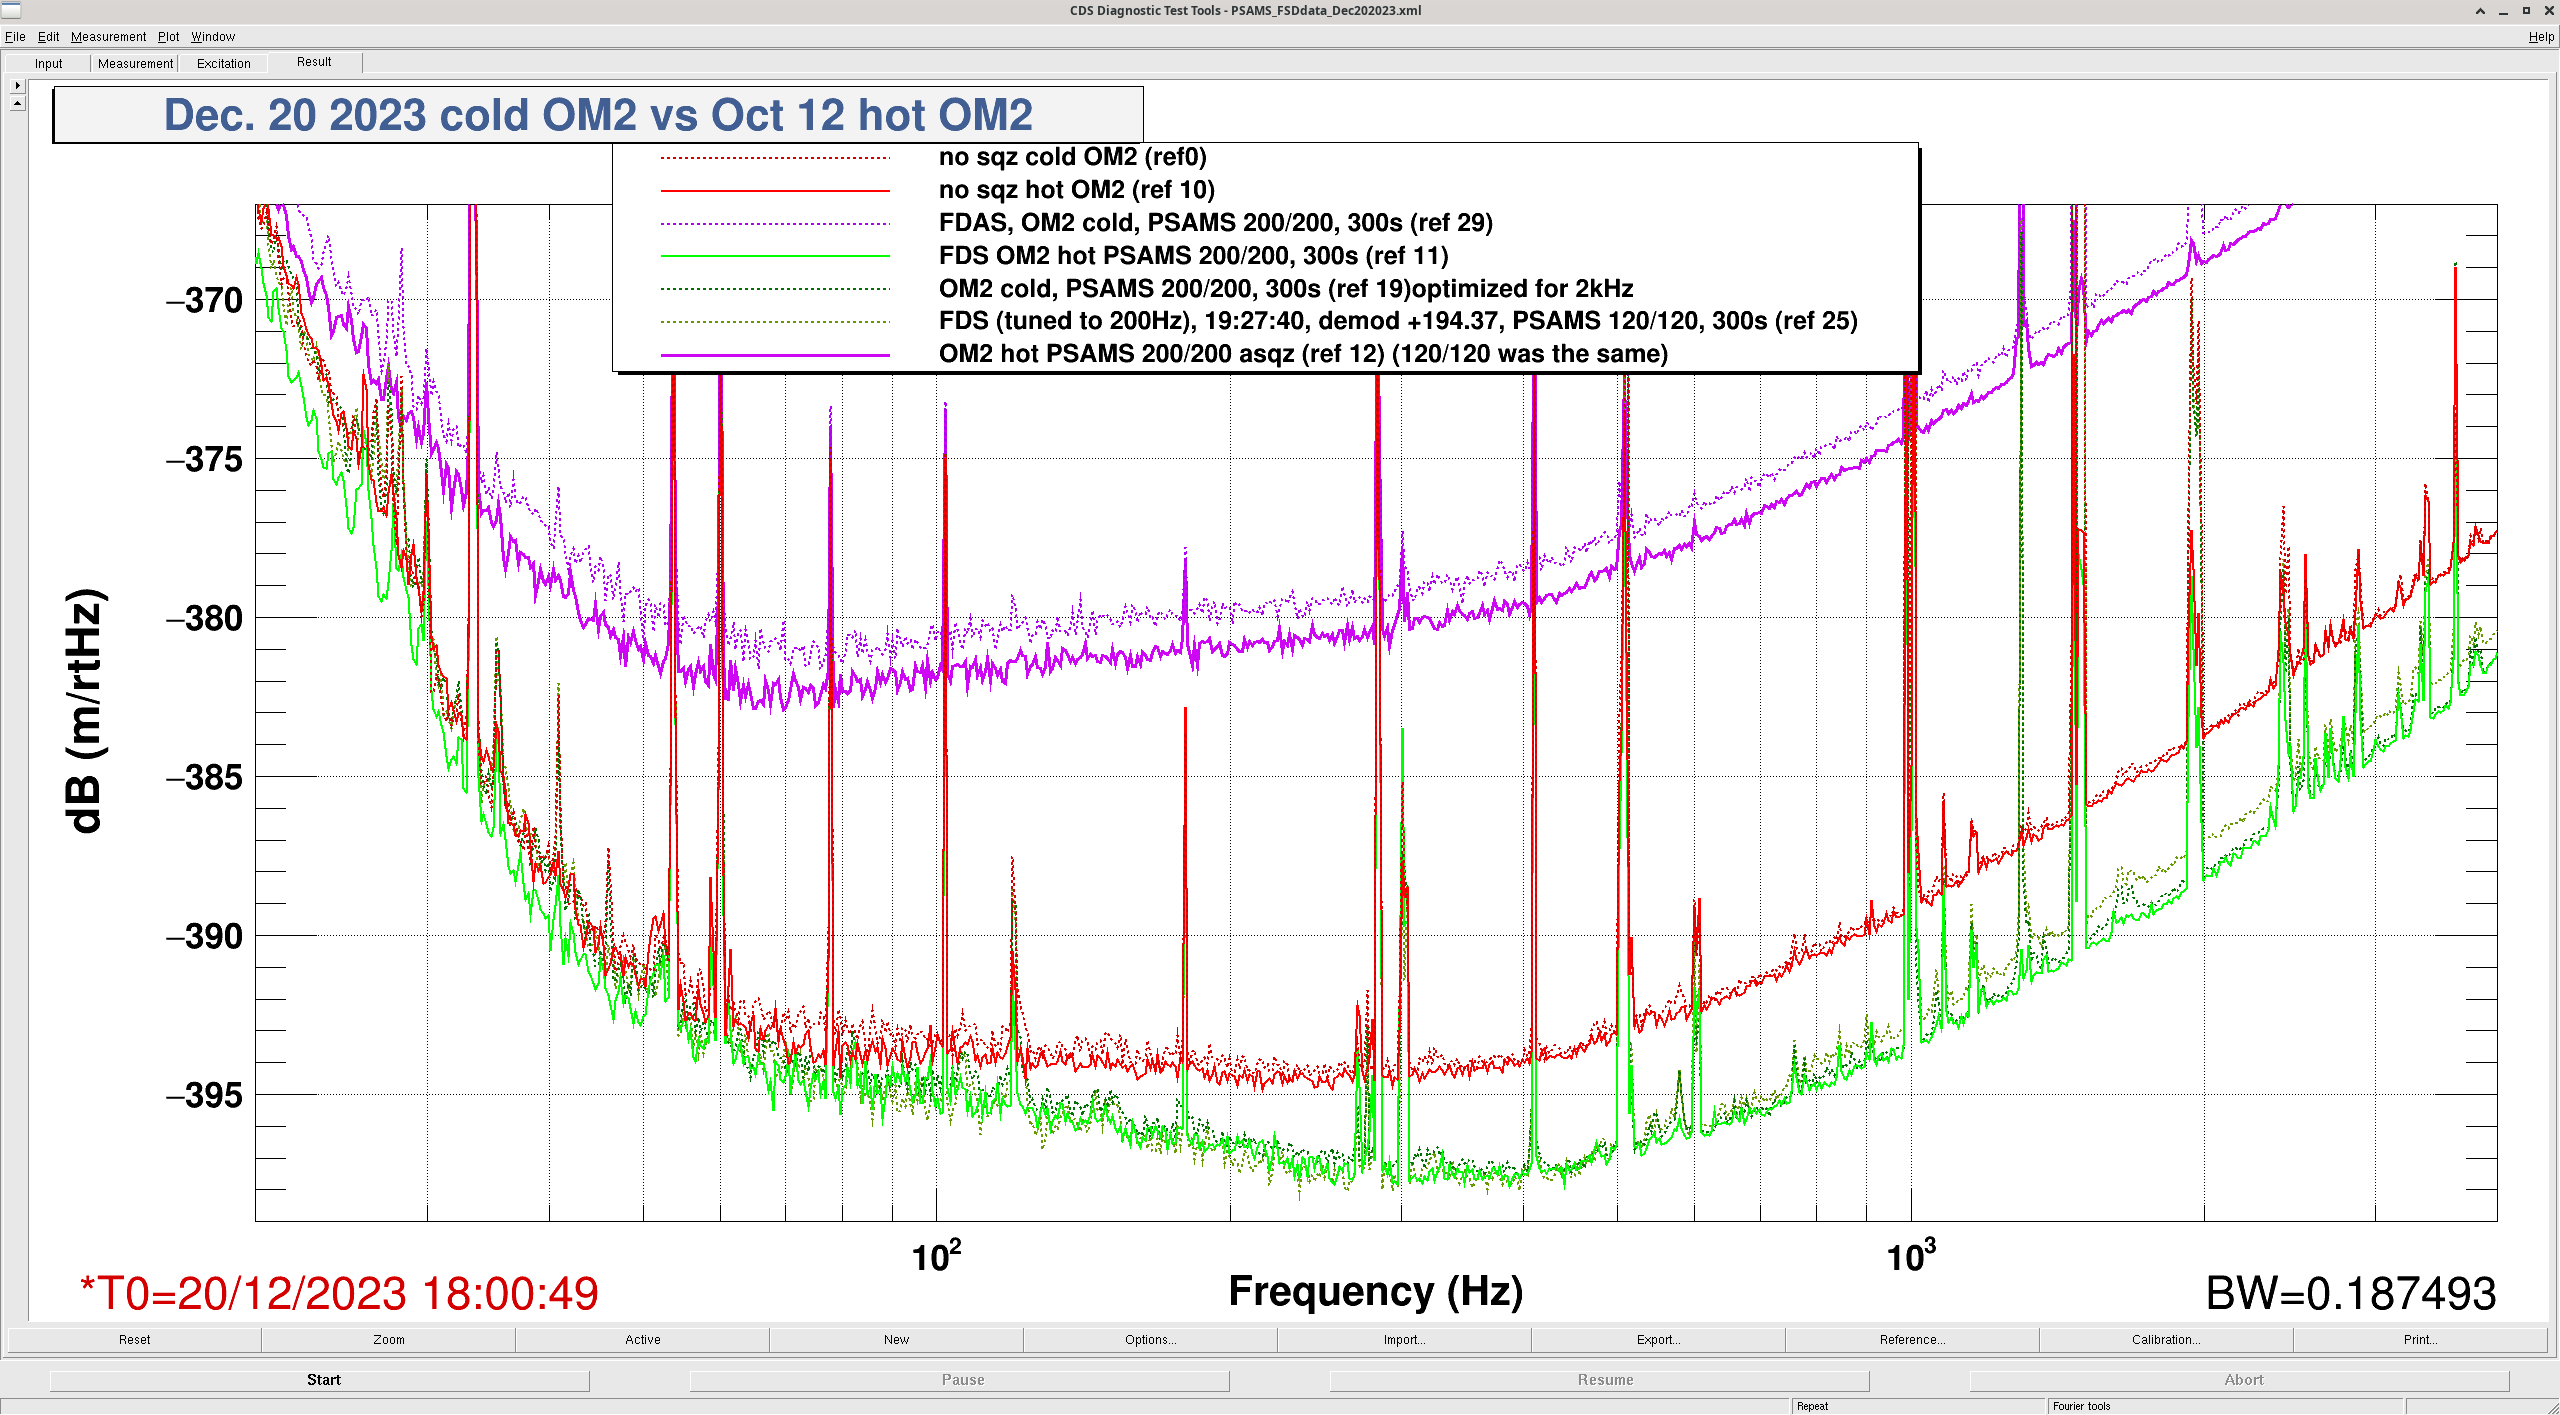
The fith attachment compares OM2 hot vs OM2 cold for antisqueeze and squeezing, with PSAMS at 200V/200V. There is less anti-squeezing with OM2 hot, which could be due to a difference in nonlinear gain or reduced readout losses. The green traces show that the squeezing level is similar, although the no sqz spectra is also different between the two times.
times:
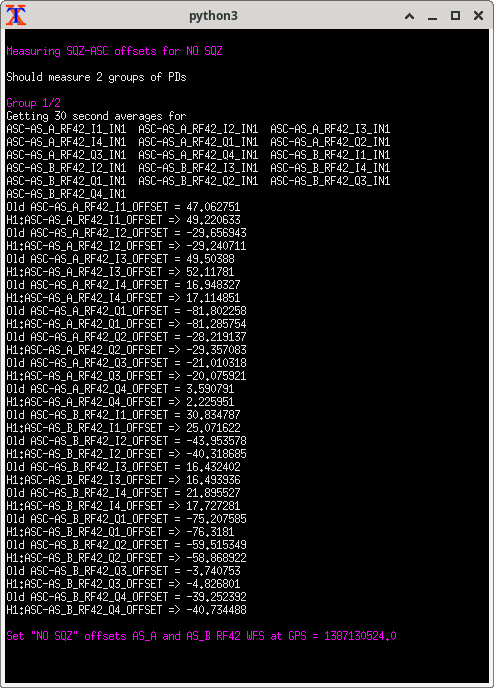
- NO SQZ: 2023/12/20 18:00:16- 18:20:40 UTC (during this time we reset AS42 offsets see attached, and measured NLG 18.1) ref0
- SQZ: PSAMS 200/200 CLF RF6 203.85 deg 18:24:30- 18:31:33 (ASC running) ref19
- ASQZ:PSAMS 200/200 CLF RF6 270.22 deg 18:35:00-18:40:00 (ASC IFO and FC off) ref20
- MID SQZ+: PSAMS200/200 CLF RF6 237.04 deg 18:42:00-18:47:10 ref 21
- MID SQZ-: PSAMS 200/200 CLF RF 89.13 deg 18:50:40-18:56:00 ref 22
- repeat sqz slightly better at low F worse at high F: PSAMS 200/200 CLF RF6 194.37 deg 19:00:30-19:07:20 ref 23 (a couple of glitches happened) (suggests we should be watching 100Hz to tune SQZ ANG instead of 1kHz)
- turned ASC back on, moved PSAMS to 120/120, waited about 3 minutes for the AS42 to converge.
- SQZ PSAMs 120/120 CLF RF6 214.28 deg 19:18:30-19:24:00 ref 24(This is the DEMOD angle that gave the best sqz at 2kHz, changing the PSAMs changes which demod angle this best squeezing is at)
- SQZ PSAMs 120/120 CLF RF6 194.37 deg 19:27:40-19:33:20 ref 25 (better SQZ at 200Hz)
- ASQZ PSAMS 120/120 CLF RF6 100.5 deg CLF servo sign flipped 19:42:20-19:47:40 ref 26
- MID SQZ PSAMS 120/120 CLF RF6 237.04 deg 19:49:10- 19-54:50 ref 27
- MID SQZ PSAMS 120/120 CLF RF6 89.13 deg 19:56:10 - 20:01:40 ref 28
Since our ASQZ with PSAMS 200/200 was a little lower than with 120/120, and that seemed inconsistent with our sqz data and our previous measurement with OM2 hot, we went back to SQZ with PSAMS 200/200, ran ASC then turned it off, and checked the sqz angle carefully. This did give a little more anti-sqz to replace the reference 20 above:
- ASQZ PSAMS 200/200 CLF RF6 100.5 deg CLF servo flipped 20:13:15- 20:19:30 ref 29
Camilla saved these references in userapps/sqz/Templates/dtt/DARM/PSAMS_tests_Dec2023.xml
[Vicky, Sheila, Kevin]
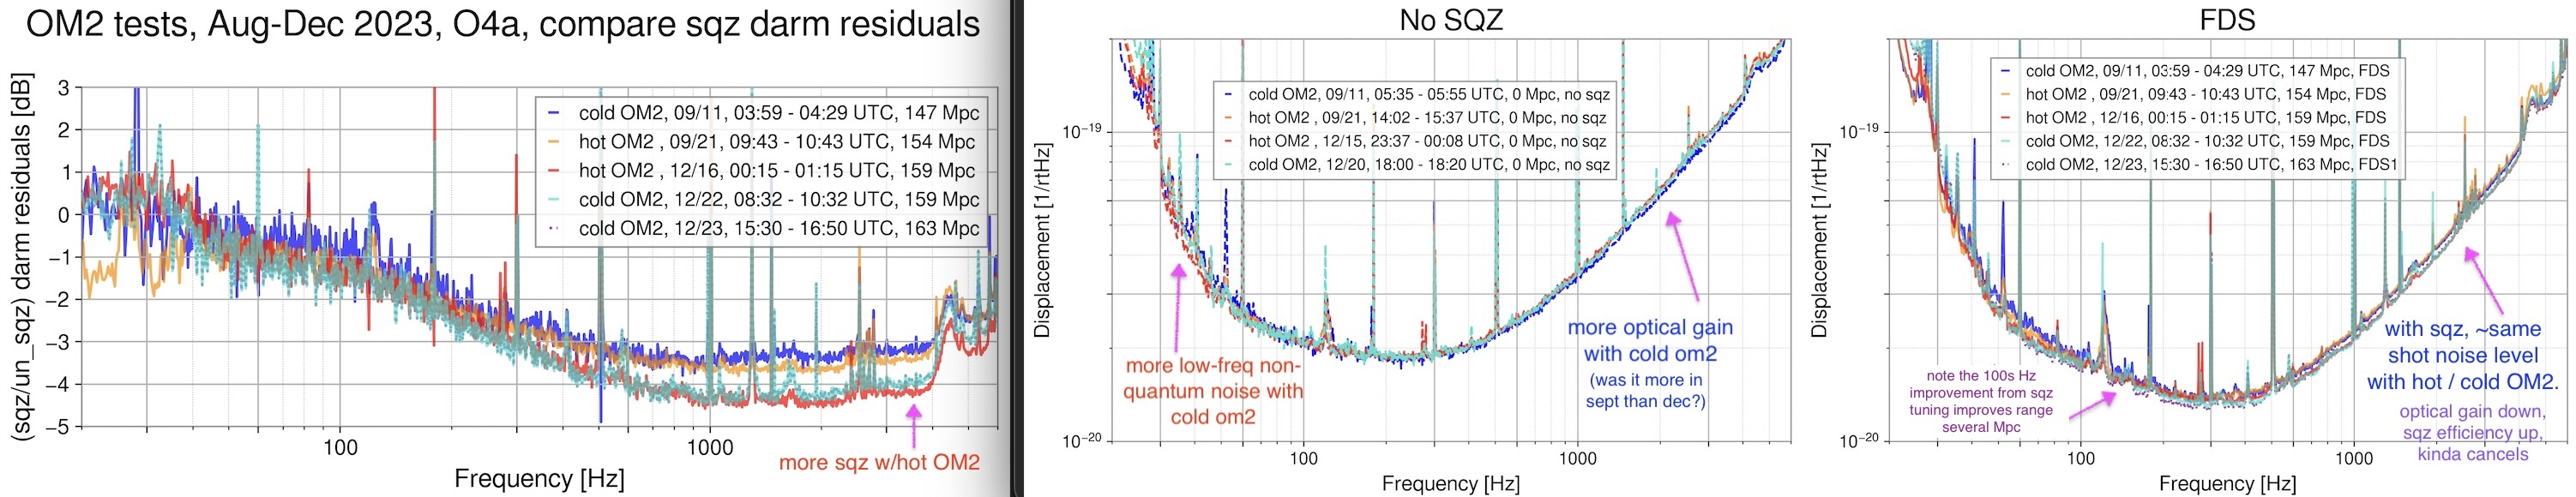
Summary: In O4a at LHO, maxing out the ZM4/5 PSAMS to 200/200V corresponded to the best squeezer mode-matching, as judged from the flatter frequency-dependence of the squeezing angle. We didn't see a clear signature of freq-dep squeezing losses. It's possible the squeezer was better mode-matched with hot OM2, while the IFO was better mode-matched with cold OM2. So, both situations ended up comparable, and neither was fully optimal (LHO:74916, these plots). Hopefully we can repeat these PSAMS tests and reach even flatter sqz / better mode-matching in O4b, after offloading psams during the break.
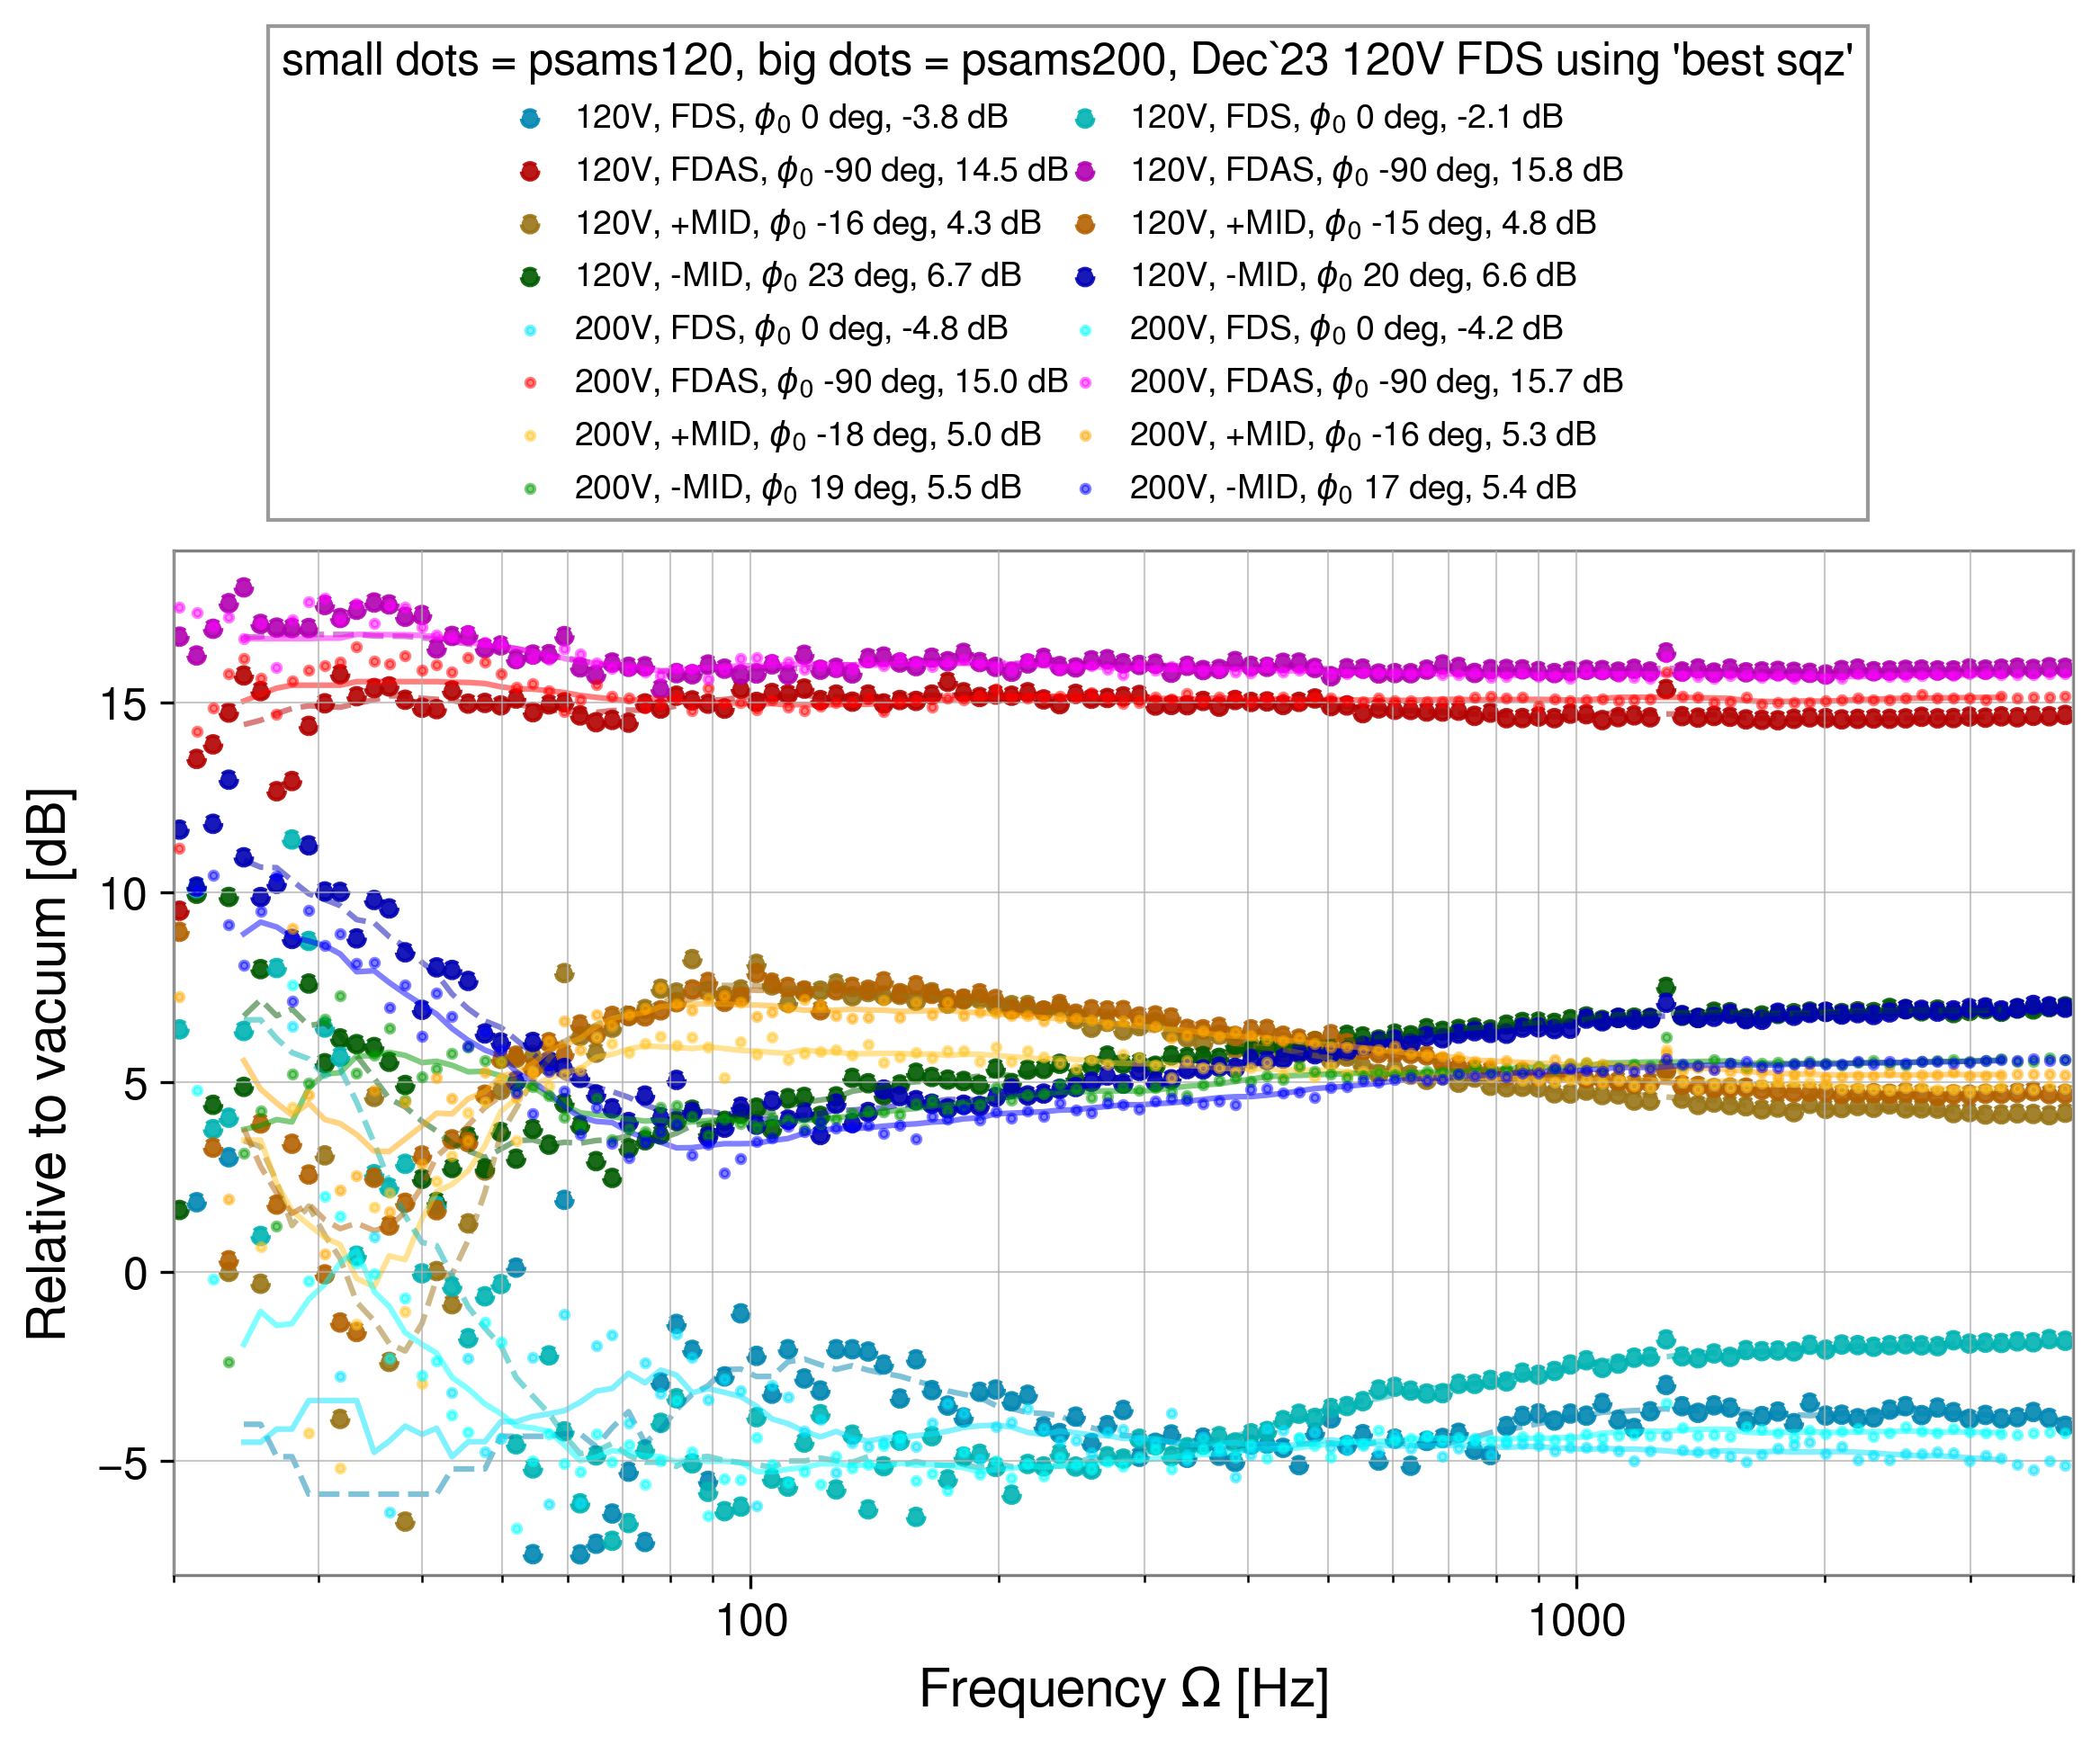
To evaluate the different SQZ-IFO-OMC mode-matching configurations, Sheila suggested we can try comparing the frequency-dependence of squeezing losses and sqeezing angle across different active optics settings. This is comparing some of the SQZ metrics from Lee's paper, for various mode-matching situations (see bottom panels of Figure 3 from P2100050). If flat squeezing across all frequencies is a good figure of merit for good matching, in O4a, railing PSAMS 200/200 consistently produced the flattest squeezing (small dots) regardless of OM2.
We compared these two PSAMS datasets as a function of OM2 temp: 74935 - Dec 2023 - cold OM2, and 73621 - Oct 2023 - hot OM2. Changing OM2 temp varies the IFO-OMC mode-matching, while changing the PSAMS voltage varies the SQZ - IFO/OMC mode-matchings.
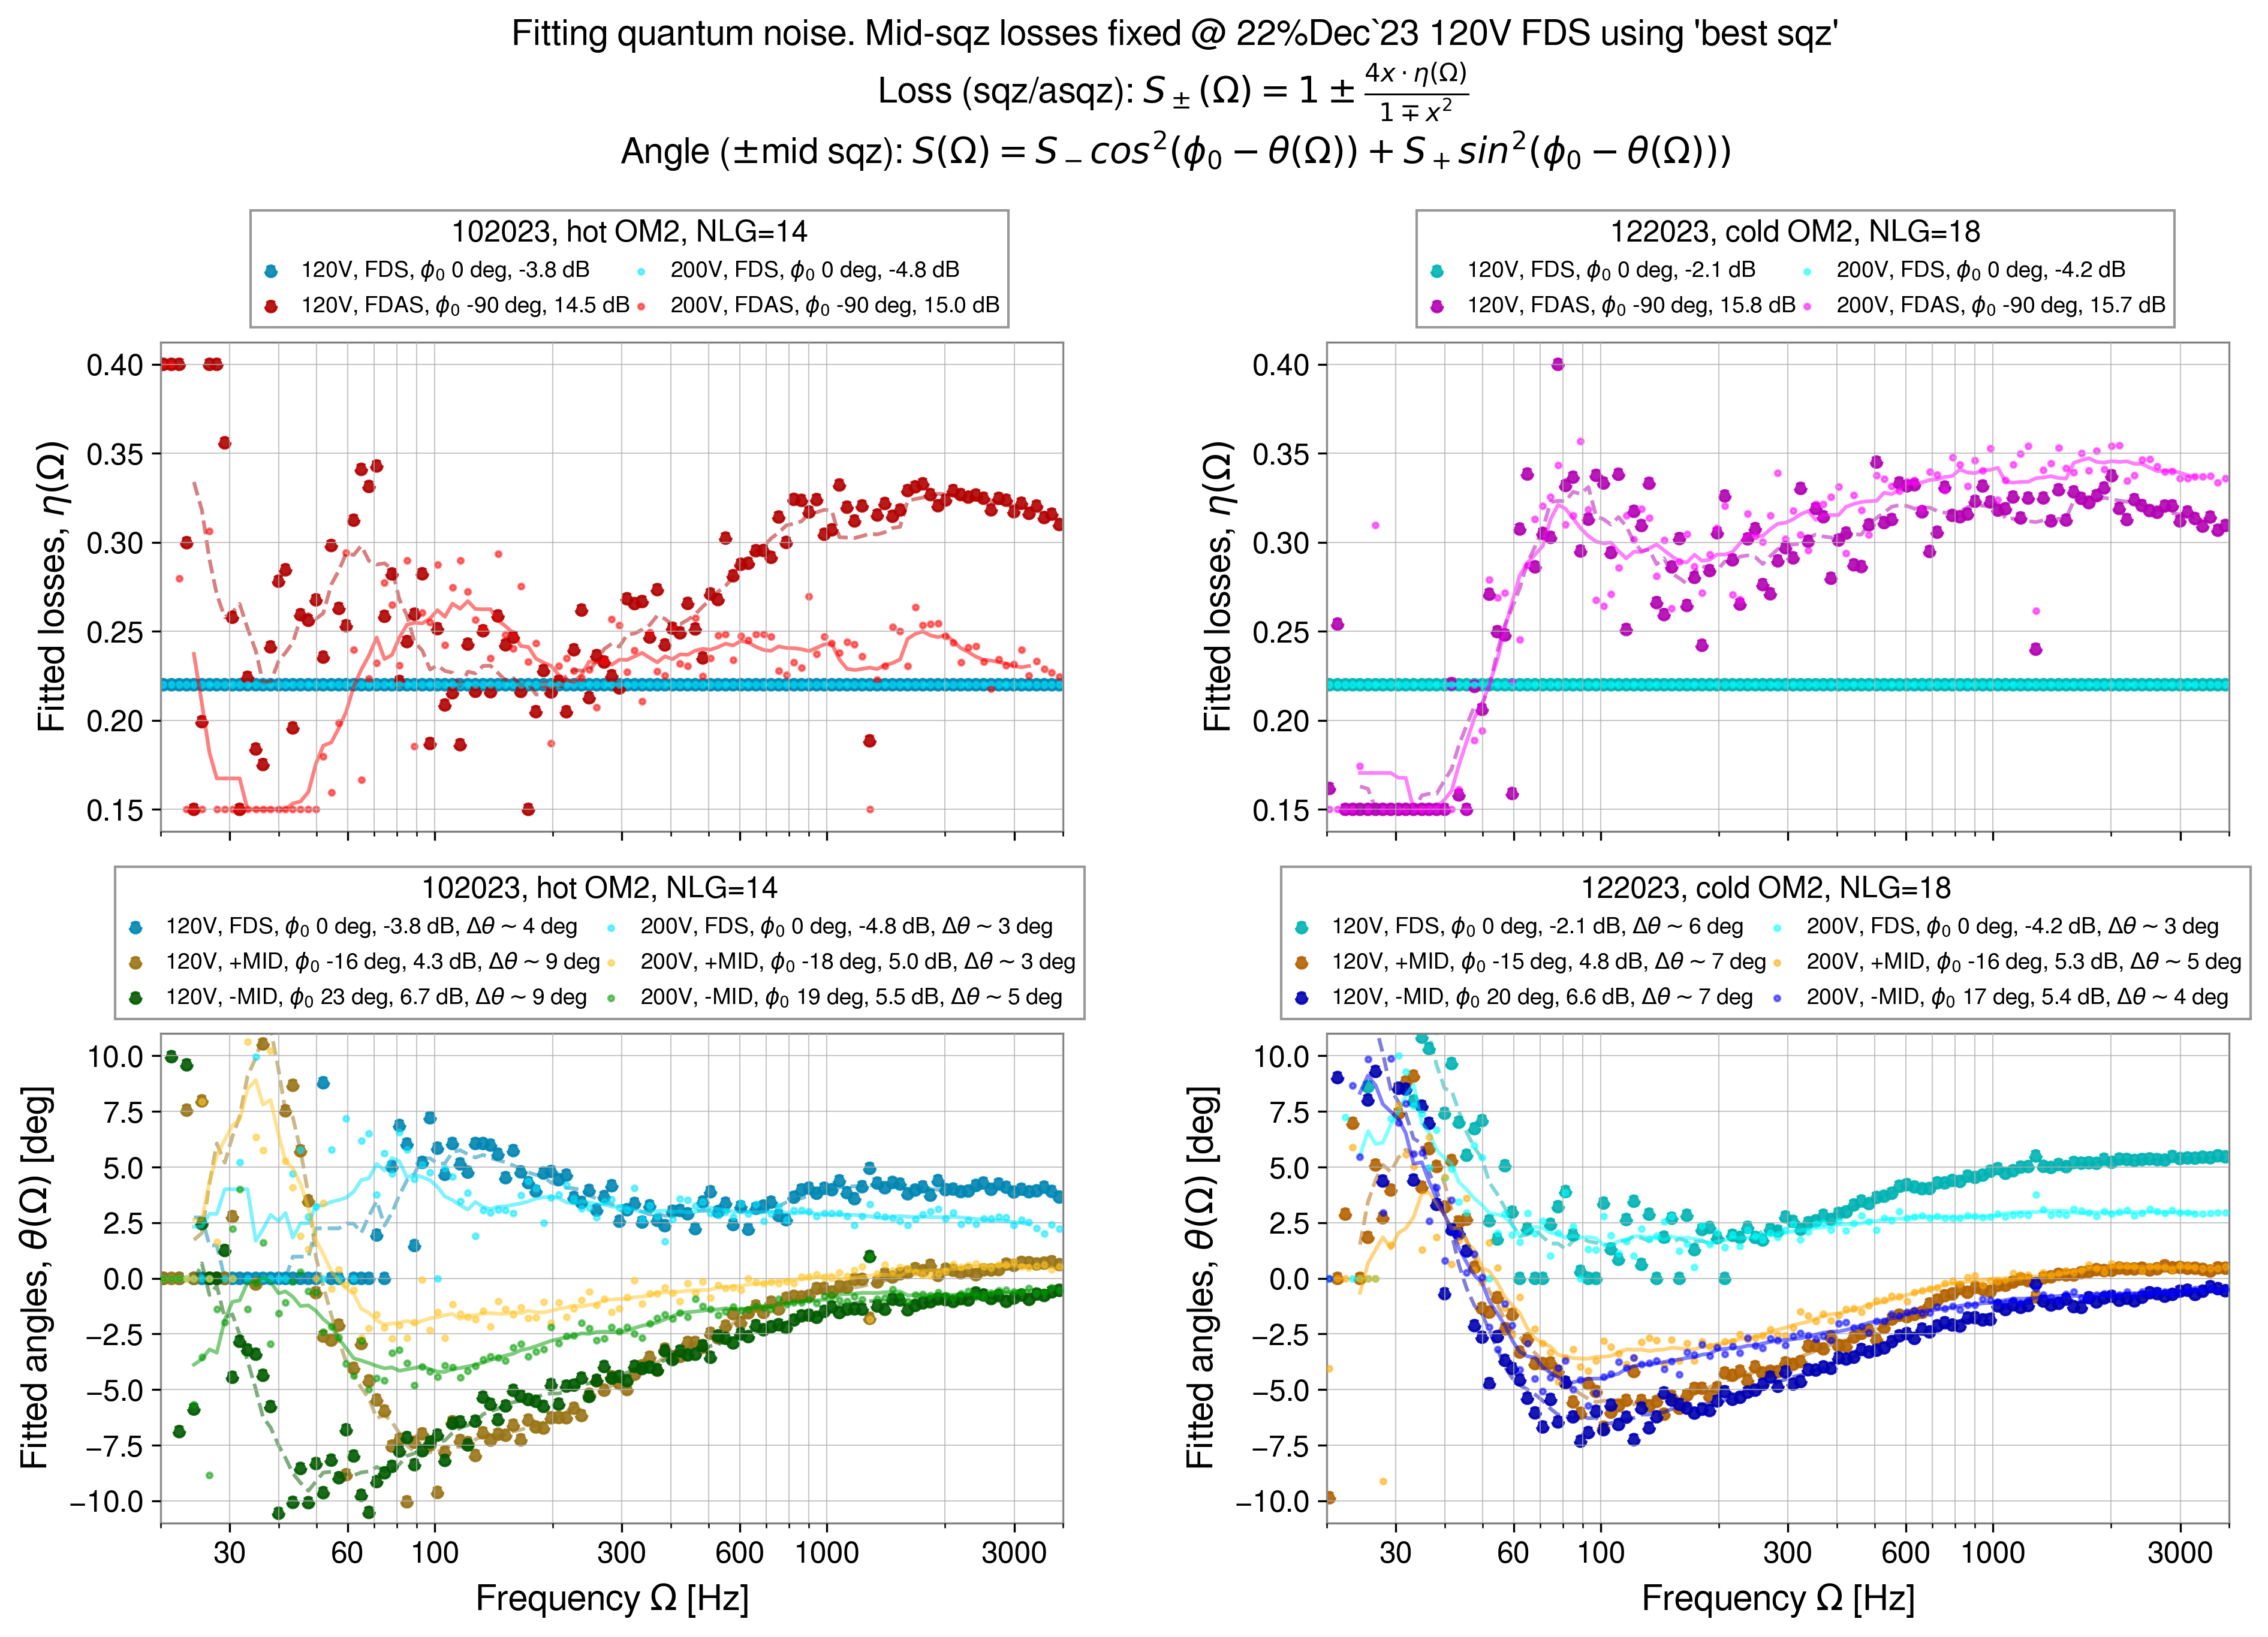
This the main takeaway plot - it shows the squeezing angle's frequency dependence as we varied PSAMS settings (ie, squeezer beam shape), at two different OM2 temps (ie, different IFO-OMC path mode matchings). Smaller dots == PSAMS 200/200, bigger dots == PSAMS 120/120. Dots = data, lines = moving average of data (not a fit) to guide the eye.
---> Traces with 200/200 (smaller dots) have less degrees of sqz angle rotation across the band, i.e. they are flatter. We could interpret this flatter sqz as better squeezer mode matching.
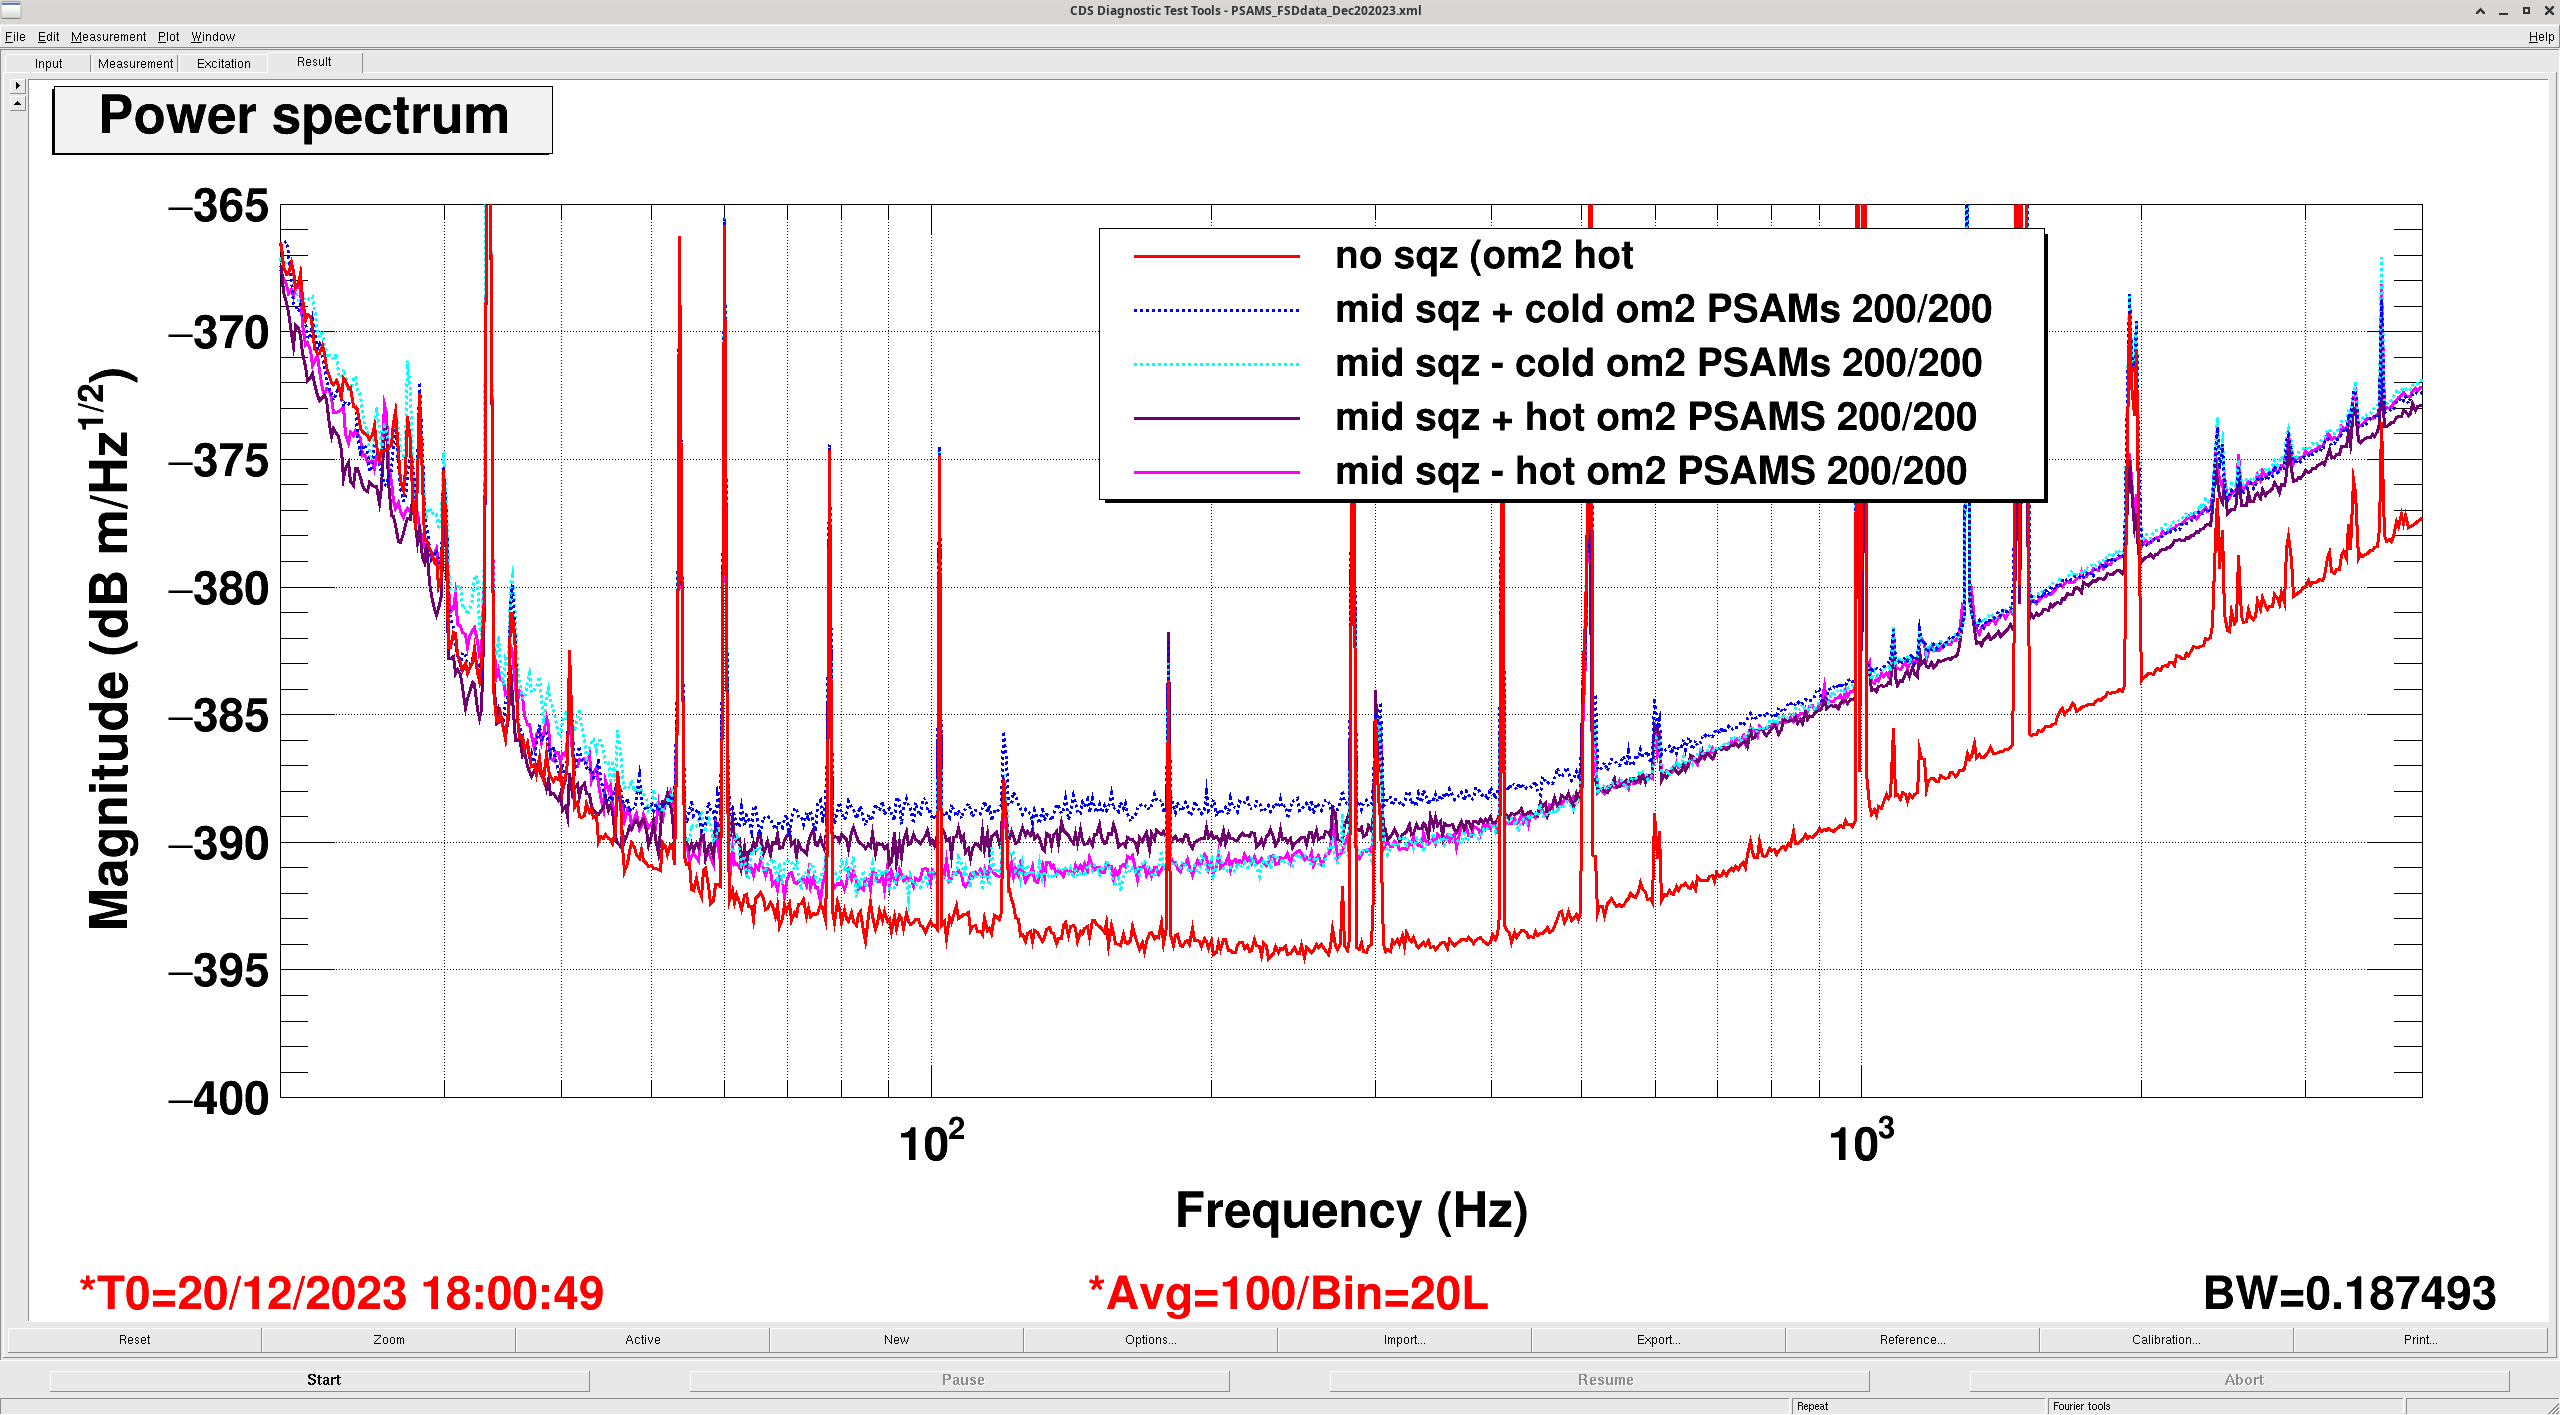
For the process: this screenshot shows all the DARM PSAMS data we started with, and the squeeze dBs from all the configurations after subtracting classical noise. From this squeeze dB data, at each frequency we ues standard sqz equations: for anti-sqz we fit losses, for +/- mid-sqz and sqz data we fit the squeeze angle. Altogether, we get the above main plot of freq-dep losses and angle variations.
To add to this analysis -
- Use sqz+asqz data to solve for the nonlinear gain (ie, generated sqz level) and loss at each frequency. Maybe even include the angle variations. In principle we have 2 equations, 2 measurements, 2 unknowns, so this is do-able. See if one configuraiton has higher losses than the other. Until we do this, I think the absolute loss levels (the y-axis of top row in main plot) are somewhat untrustworthy. Even for the freq-dependence of the anti-sqz losses, that is believably be due to sqz angle variations and not due to frequency-dependent losses (which I don't see strong evidence for).
- Fit these squeeze angle variations to quantum noise mode-matching models. Ideally we could estimate how much mode-mismatch is where from these squeeze metrics.
- Reconcile the squeezer mode-matching situation with the as-built beam paths and PSAMS settings, which Kevin is working on. Hopefully while in-chamber, we can get more photos of optic locations and beam profiles, to do this analysis after the break.