Trent, Georgia
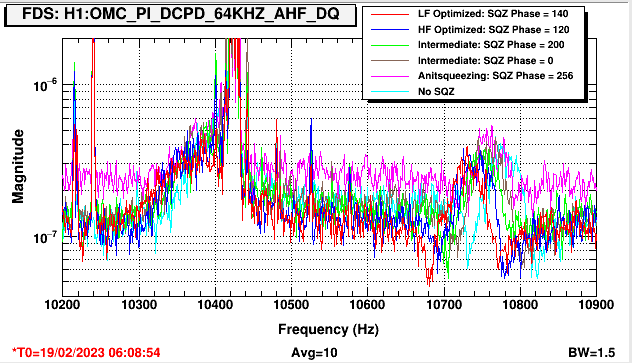
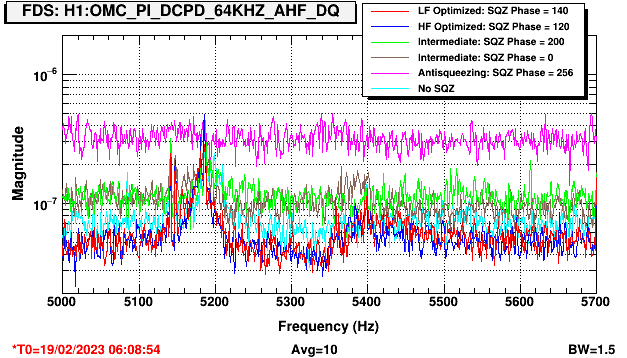
We wanted to see how the arm cavity higher order modes changed with squeezing phase, so we plotted Dhruva's data from 19 February 2023 zooming in on the appropirate frequency range. See Dhruva's post for more info about the data. We have two plots, one at higher frequency (10200Hz - 10900Hz) (02 20 modes) and one at lower frequency (5000Hz - 5700Hz) (01, 10 modes).
Note that for the high frequency plot, the y-arm HOM is degenerate with the acoustic modes of the test masses (at ~10.4kHz) and the acoustic modes dominate the signal at this frequency. Therefore, we can't say much about the squeeze angle dependance of the y-arm HOM but the x-arm HOM amplitude does not seem to change with the squeeze angle.
The low frequency plot also does not show a significant change in the HOM amplitude.
The list below gives the GPS times and the corresponding curve colors.
Ref 0: 1360822152 (Red)
Ref 1: 1360822844 (Blue)
Ref 2: 1360823864 (Green)
Ref 3: 1360824833 (Brown)
Ref 4: 1360825873 (Pink)
Ref 10: 1360834978 (Teal)
A nice DARM video is found in this post which shows the arm HOM shifting in frequency as the test masses thermalize.
I made a Dan-style DARM movie of the second order arm transverse modes during the squeezer phase adjustments, in case there is something we missed with the PSDs. The noise at 10k goes up and down with squeezing and anti-squeezing, but the modes dont seem to be affected.
