jeffrey.kissel@LIGO.ORG - posted 11:38, Thursday 14 March 2024 (76381)
bbssopt.m Parameter Set updated to match H1 (er, X1) BBSS First Article
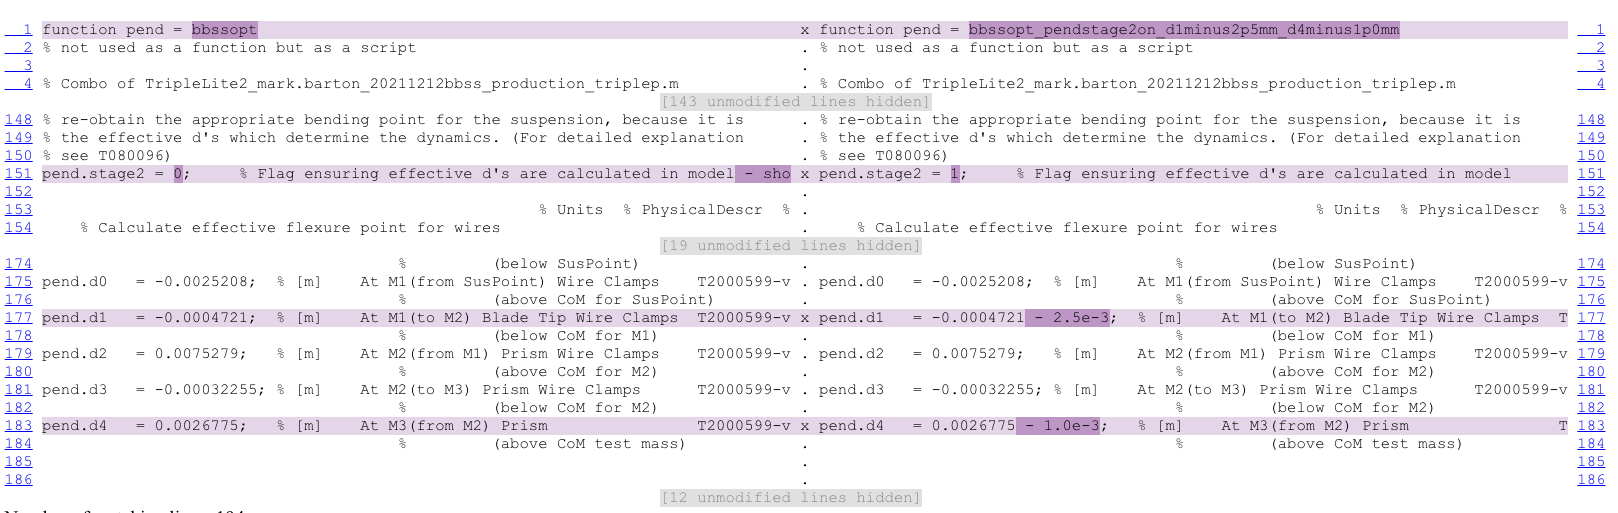
M. Barton, J. Kissel. O. Patane

Recall, we'd had issues understanding why the modeled top-mass pitch to pitch transfer function looked so weird (see LHO aLOGs 75787 and 75947).

After
    - Mark's suggestion of the problem (suggested over email and mentioned on the 2024-02-29 a+ SUS call), and
    - Oli's hard work proving that that *was* the problem (see LHO:76071),

I've now closed the loop for the bbssopt.m Bigger Beam Splitter Suspension's production model parameter set that best matches the first article data:
    - Added a few more slides to G2400442 conveying the resolution, now at -v2
    - copied over the temporary bbssopt_pendstage2on_d1minus2p5mm_d4minus1p0mm.m parameter set on top of bbssopt.m parameter set,
    - committed bbssopt.m to the SusSVN as of rev 11778.

The screenshot of the comparison shows the differences between the previous rev and the current rev:
    - the pend.stage2 boolean flag is now set to 1.0, which matches that the ds are defined as physical ds, and
    - d1 and d4 are (slightly) adjusted to better match the first article.

To generate transfer functions from this production model parameter set,
    (1) find a computer with the
    /ligo/svncommon/SusSVN/sus/trunk/Common/MatlabTools/TripleModel_Production/

folder checked out,
    (2) open Matlab,
    (3) Run the following commands:
        >> freq = logspace(-2,2,1000);
        >> buildType = 'bbssopt';
        >> svnDir = '/ligo/svncommon/SusSVN/sus/trunk/';
        >> plotFlag = false;
        >> [bbss,~,~,pend] = generate_Triple_Model_Production(freq,buildType,svnDir,plotFlag);
        >> figure(1);
        >> ll=loglog(freq,abs(squeeze(bbss.f(bbss.out.m3.disp.L,bbss.in.gnd.disp.L,:)))); %%% Chose which DOF you want to plot here
        >> set(ll,'LineWidth',2);
        >> grid on;
        >> title('BBSS Susp. Point. L to Optic L');
        >> xlabel('Frequency [Hz]'); ylabel('Magnitude [m/N]')
        >> shg
which will produce the attached plot.
Images attached to this report
Non-image files attached to this report
