artem.basalaev@LIGO.ORG - posted 13:40, Wednesday 20 March 2024 - last comment - 12:31, Saturday 30 March 2024(76537)
Excess noise in DARM: relation to squeezing
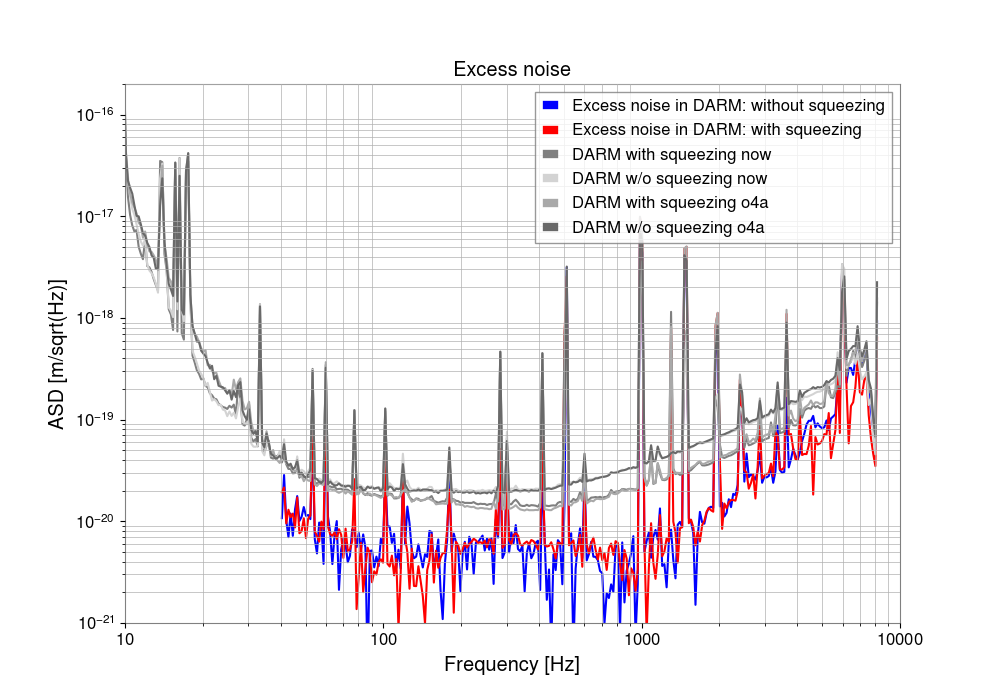
Artem, Jennie W., Gabriele

Following up on alog 76516.

We compared DARM for following configurations:
* No squeezing O4a, 12/20/2023 18:10-18:20
* With squeezing O4a, 01/12/2024 01:35:15-01:45:15
* No squeezing now, 03/17/2024 04:45:31-04:55:31
* With squeezing now, 03/17/2024 08:18:46-08:28:46

Specifically, following ASDs were calculated: sqrt(abs(no_sqeezing_now^2 - no_squeezing_o4a^2)), and sqrt(abs(squeezing_now^2 - squeezing_o4a^2)). These are shown as blue and red traces on the attached plot. The original DARM traces are shown in gray.

Our preliminary conclusion from this is that it appears that excess noise is ~same with and without squeezing.

We'll make this plot with longer time series and do some more tests.

Jupyter notebook is available here.
Images attached to this report
Comments related to this report
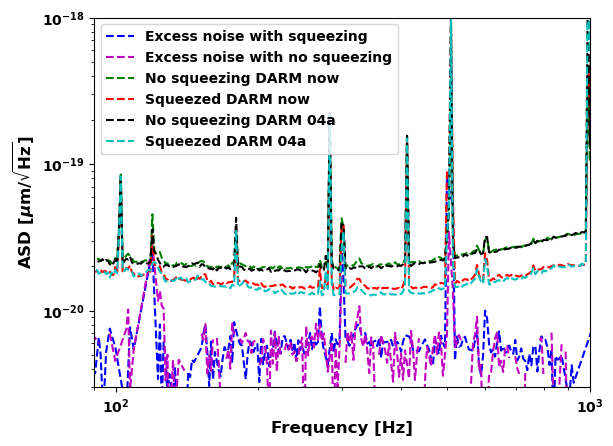
Here is my plot which is just binning calibrated CAL-DELTAL_EXTERNAL_DQ and then excluding all the ASD values where the noise now is better than the noise in 04a (these are at low frequency and this is where our noise has improved due to ASC control noise improvements and new DARM configuration).
Then I use the same maths as Artaem to get:
excess noise with no squeezing = sqrt( (ASD with no squeezing now)^2 + (ASD with no squeezing in 04a)^2)
excess noise with no squeezing = sqrt( (ASD with squeezing now)^2 + (ASD with squeezing in 04a)^2)
These also seem to be the same in my plot, which implies that the excess noise is indeed due to some correlated noise (i.e. non-quantum).
Images attached to this comment
See evolution and reduction with ZM alignment: 76757