gabriele.vajente@LIGO.ORG - posted 13:36, Tuesday 26 March 2024 (76716)
Looking at X arm A2L steps
I noticed in the summary pages spectrogram that the low frequency sensitivity was changing during one of the A2L step experiments (this is ETMX ITMX test).
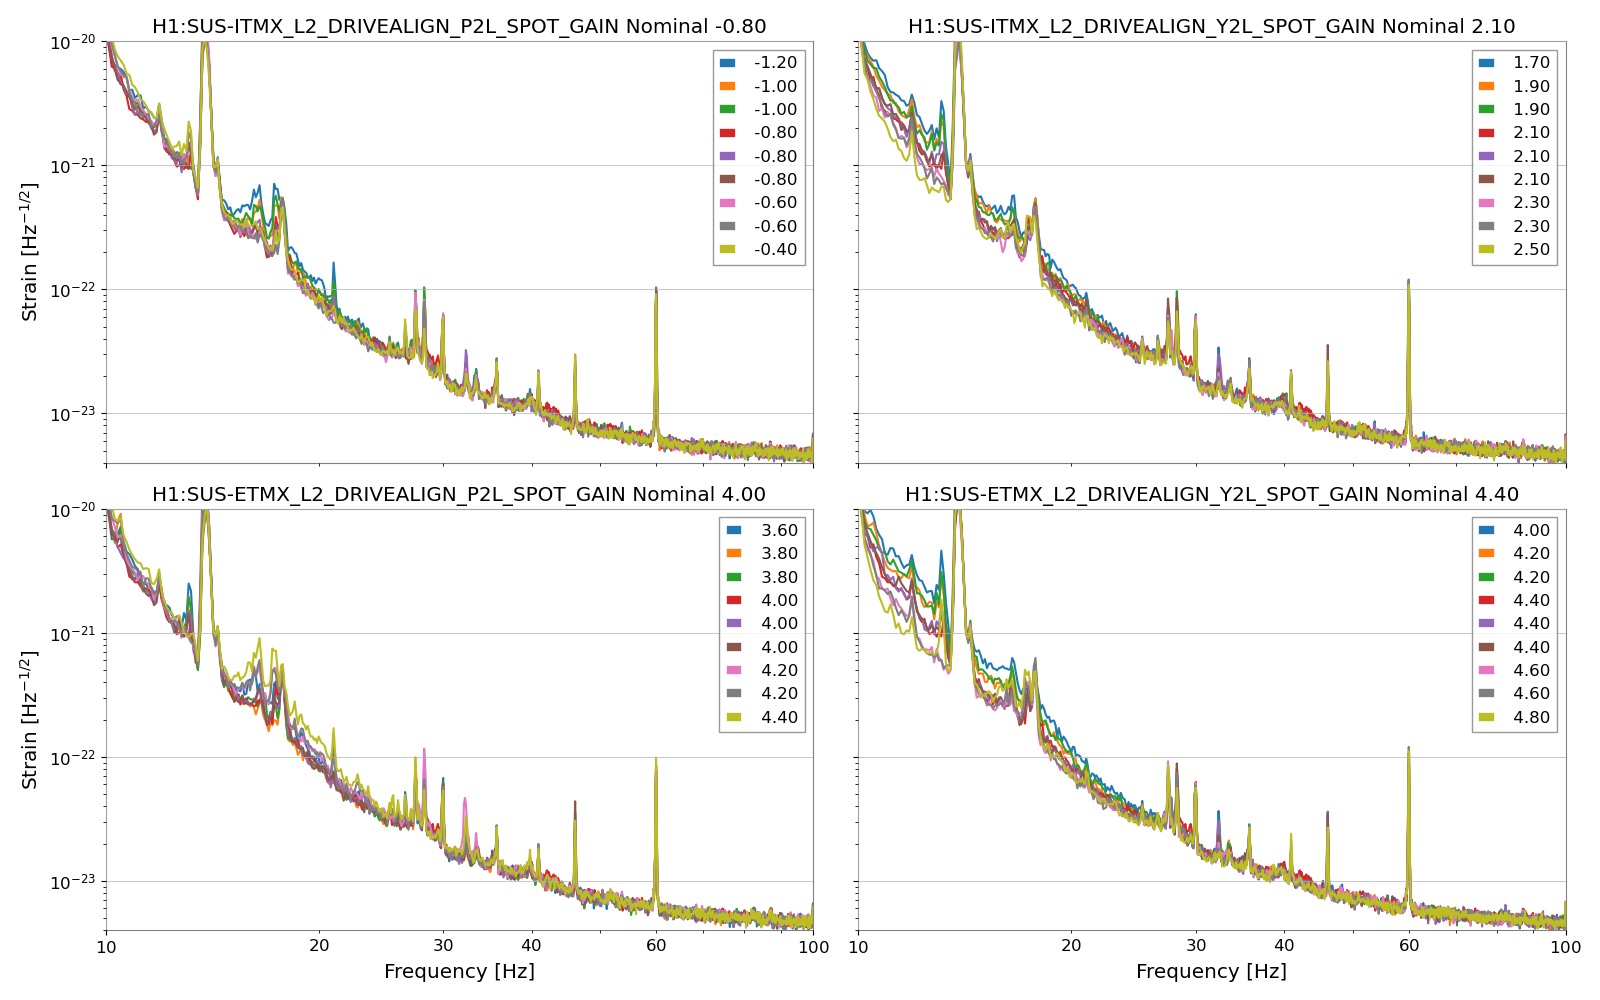
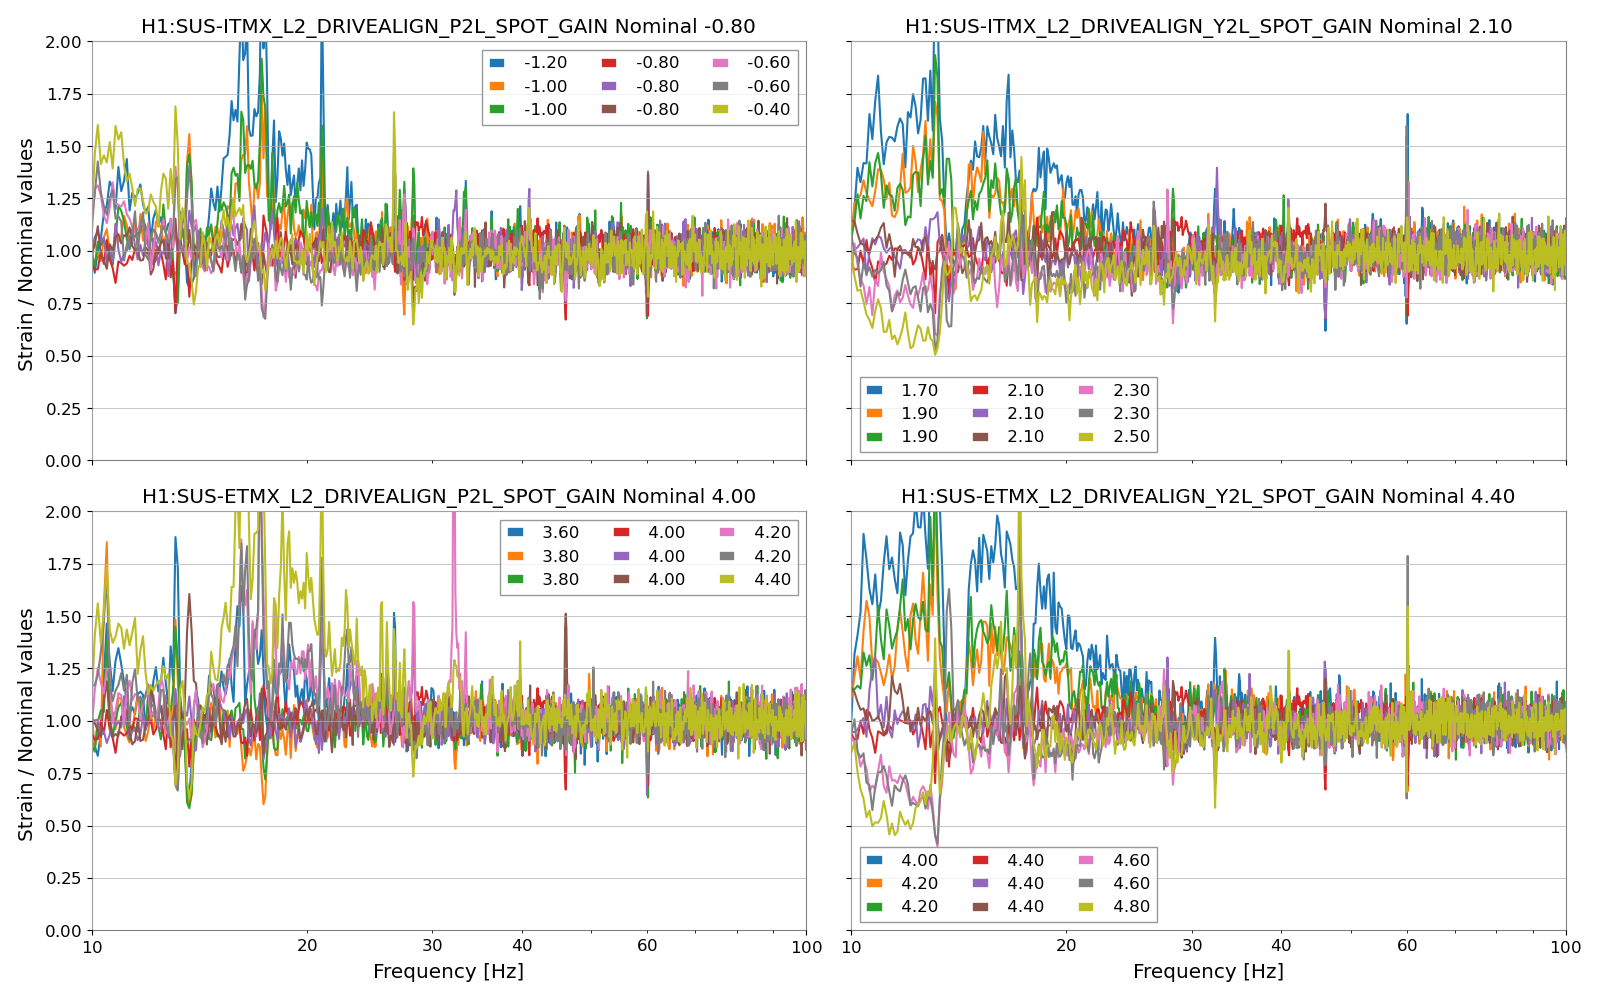
The first plot shows the strain spectrum (GDS-CALIB_STRAIN_CLEAN) for 900 seconds for each available step of P2L and Y2L for the x arm. Some steps were repeated twice. In each panel, the title shows what A2L gain is being changed, and what's the nominal value. The second plot shows the ration of strain spectrum for a given A2L gain over the averaged strain spectrum with the nominal A2L value. So lower than one means the A2L value is improving the sensitivity.
There is evidence that yaw values away from nominla make the nosie below 30 Hz better.
Images attached to this report