Eric, Camilla, Naoki
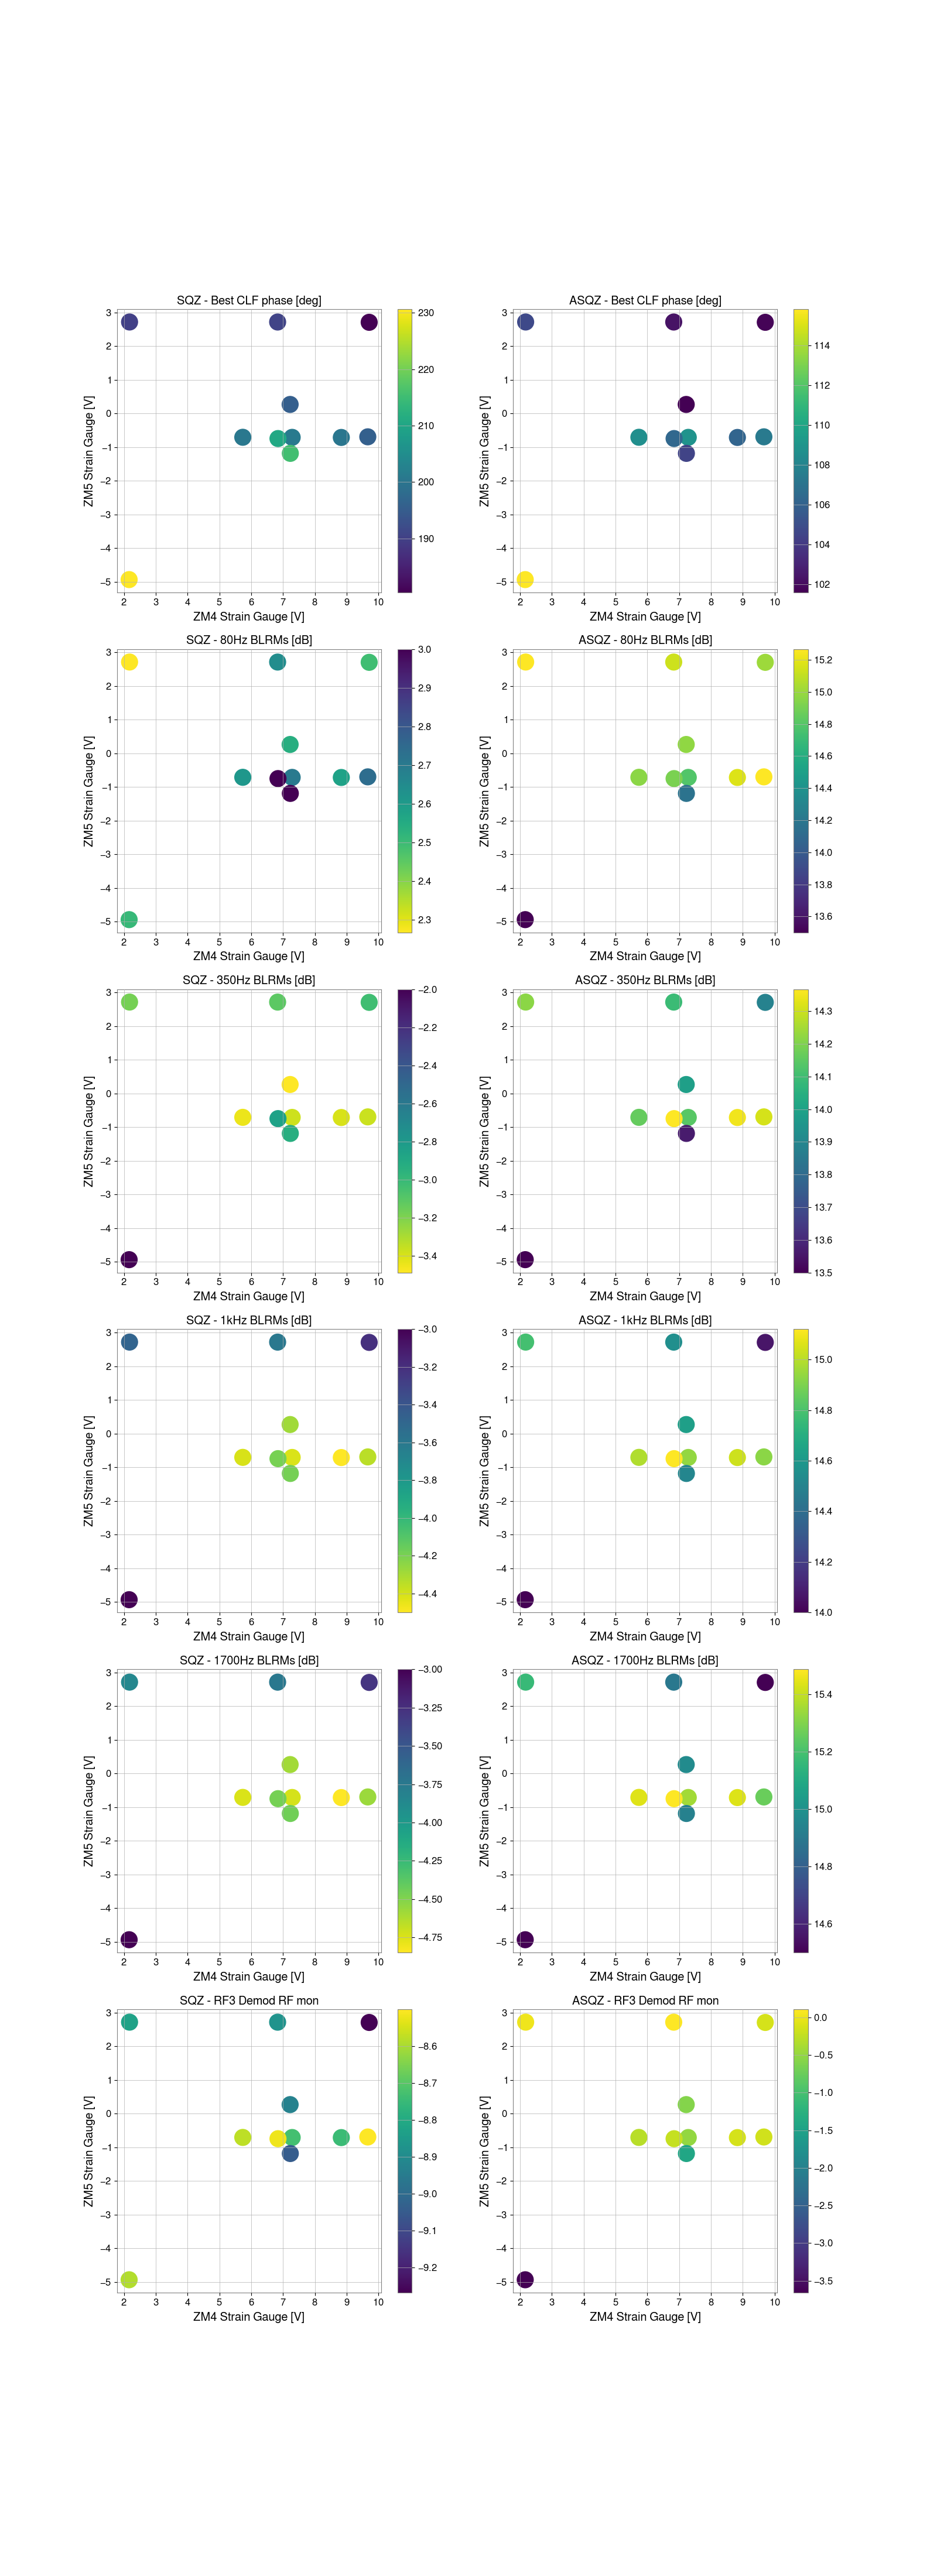
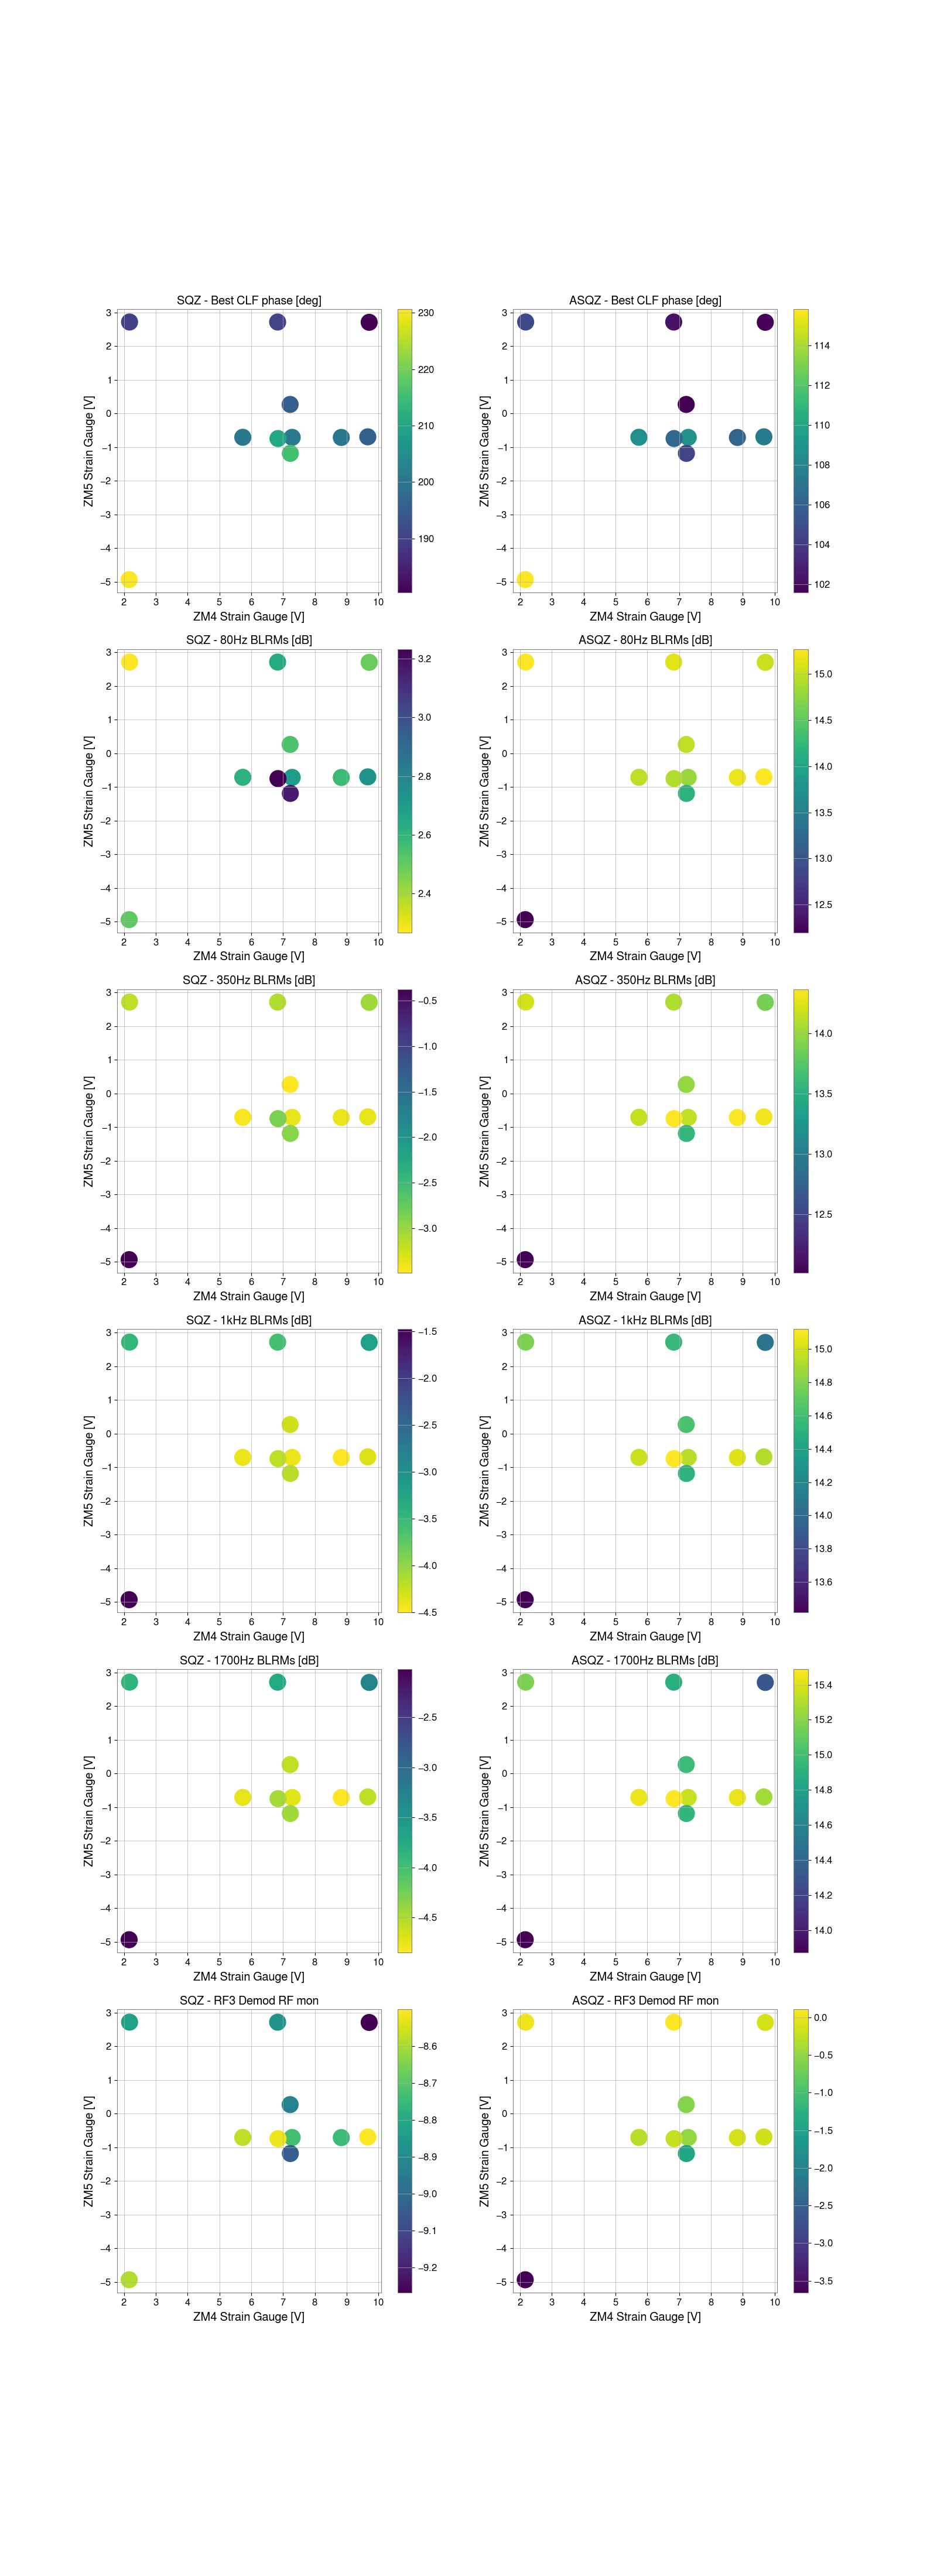
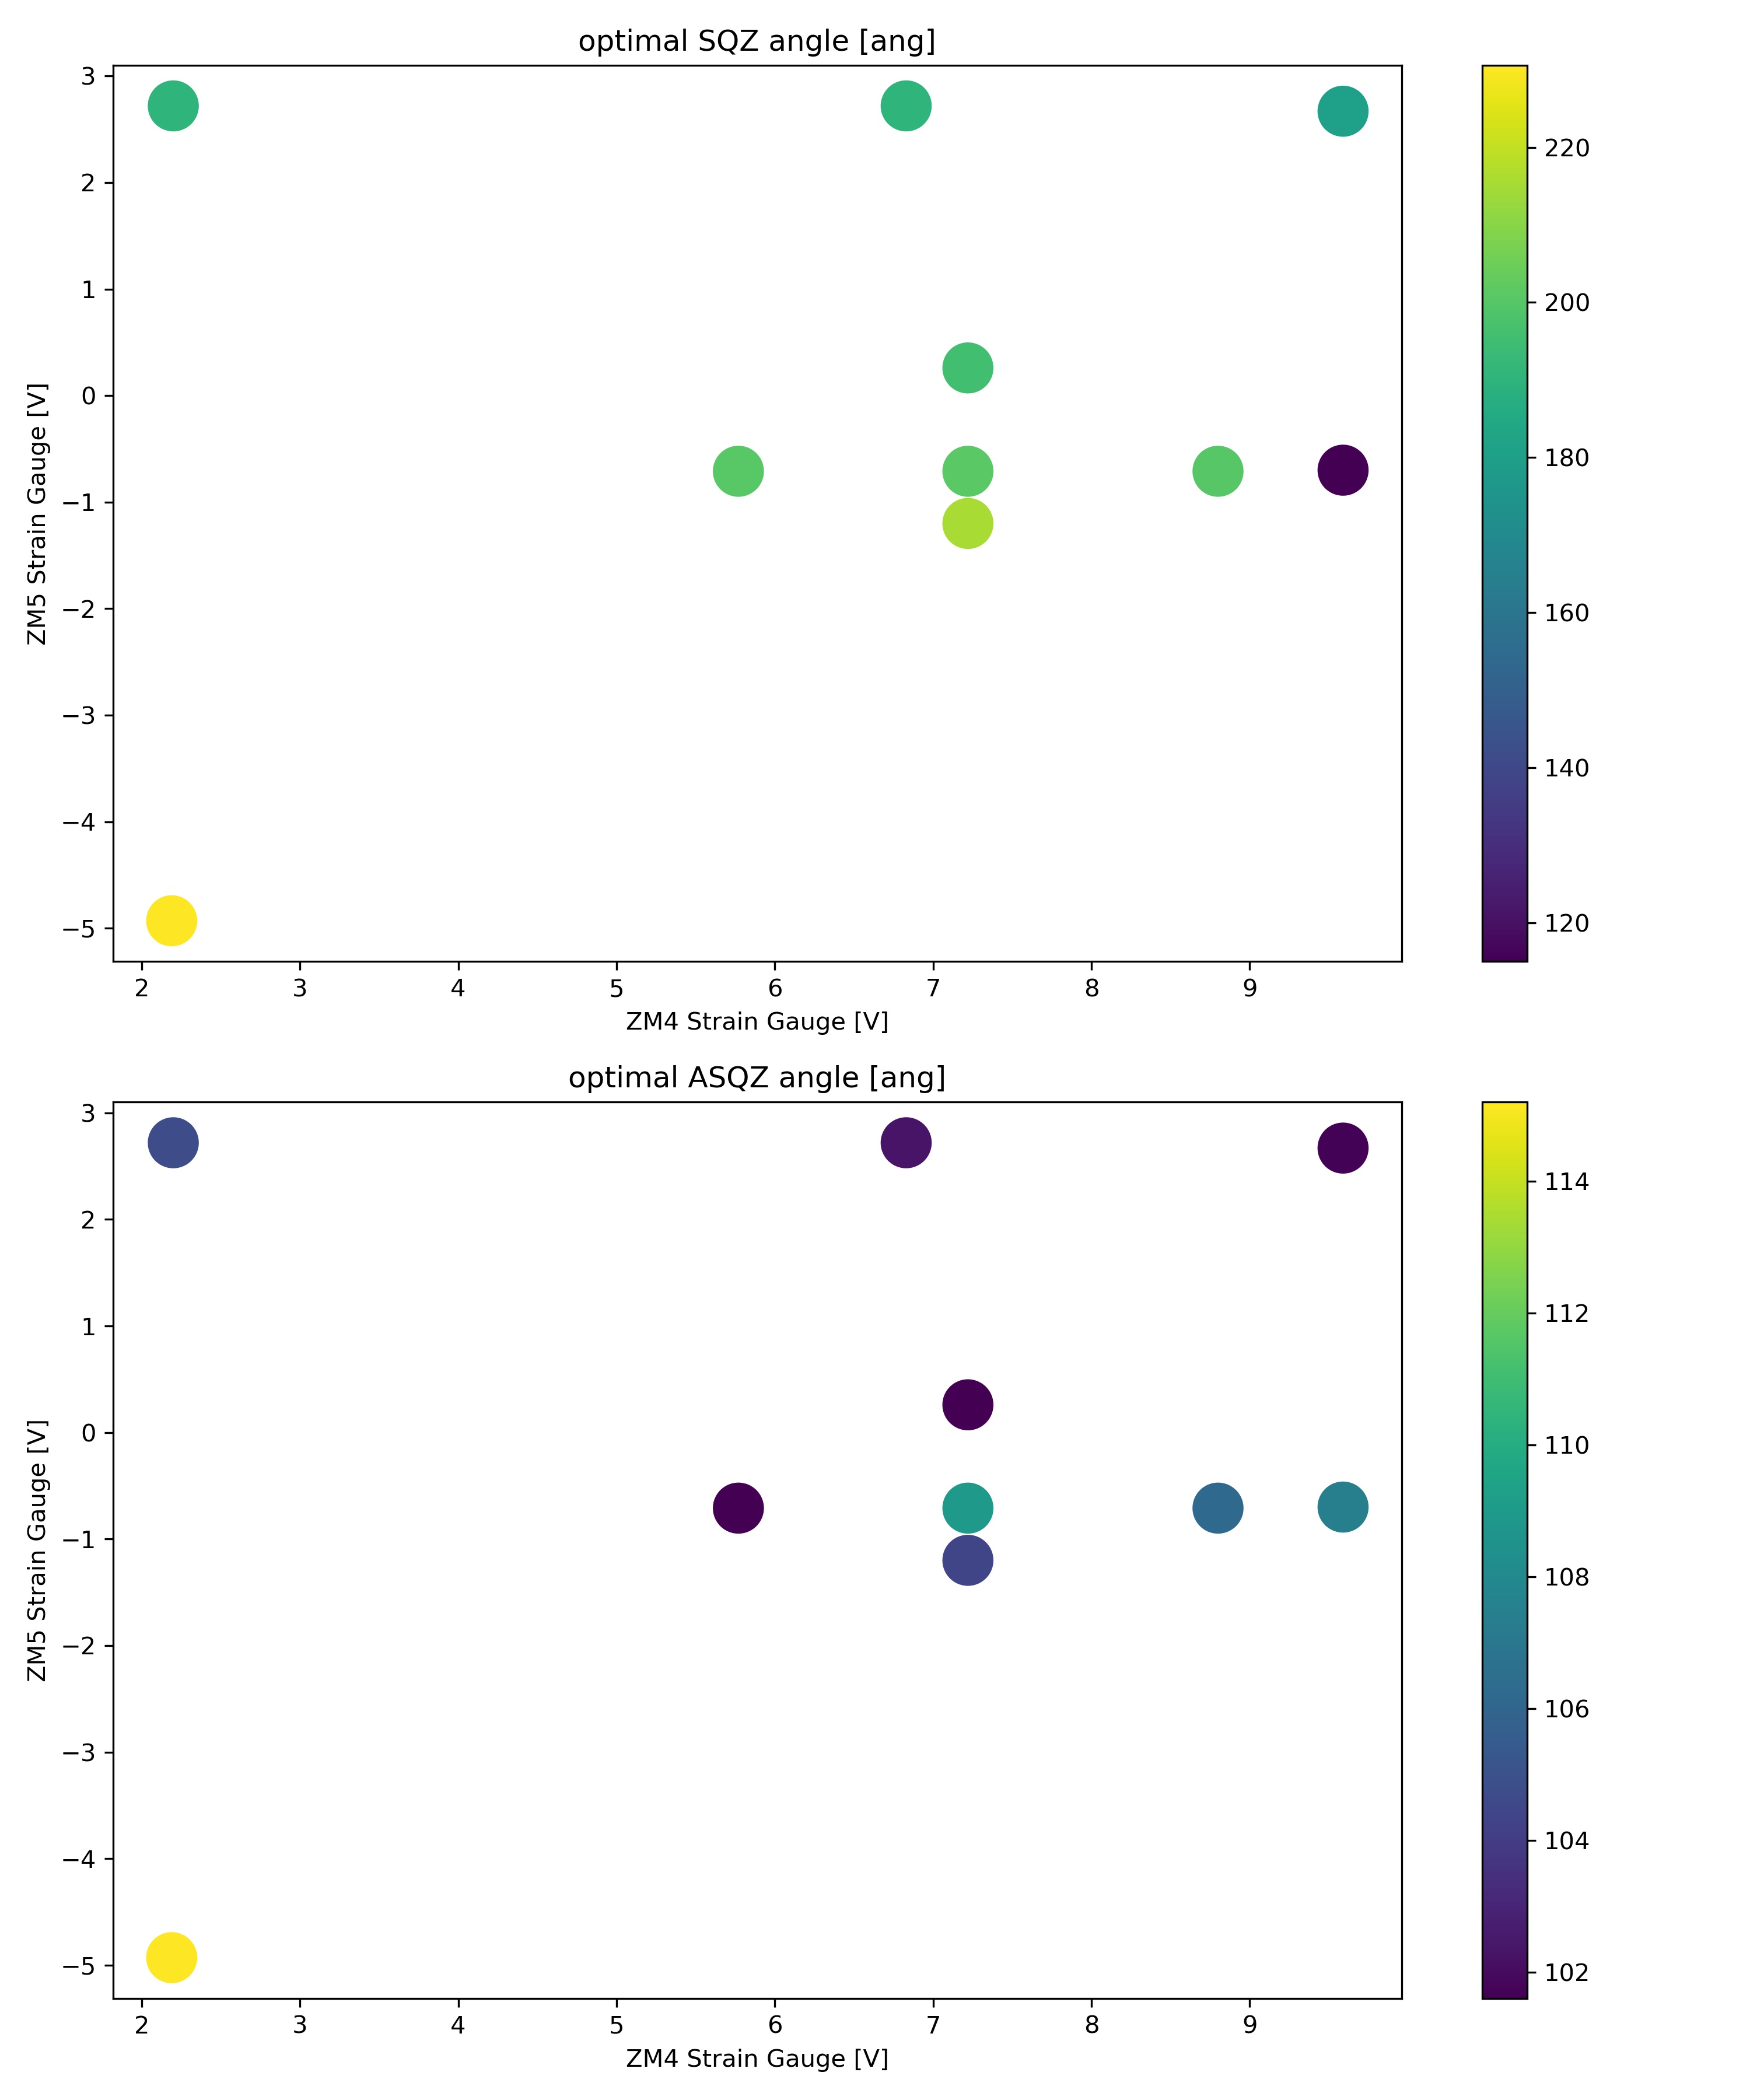
Attached are some plots showing several FOM for the impact of changing the ZM4 and ZM5 PSAMS on the squeezing seen in DARM. The axes of these plots show the strain gauge readouts for the PSAMs since the piezos are known to have issues with hysteresis. Our nominal setting is (7.2, -0.72).
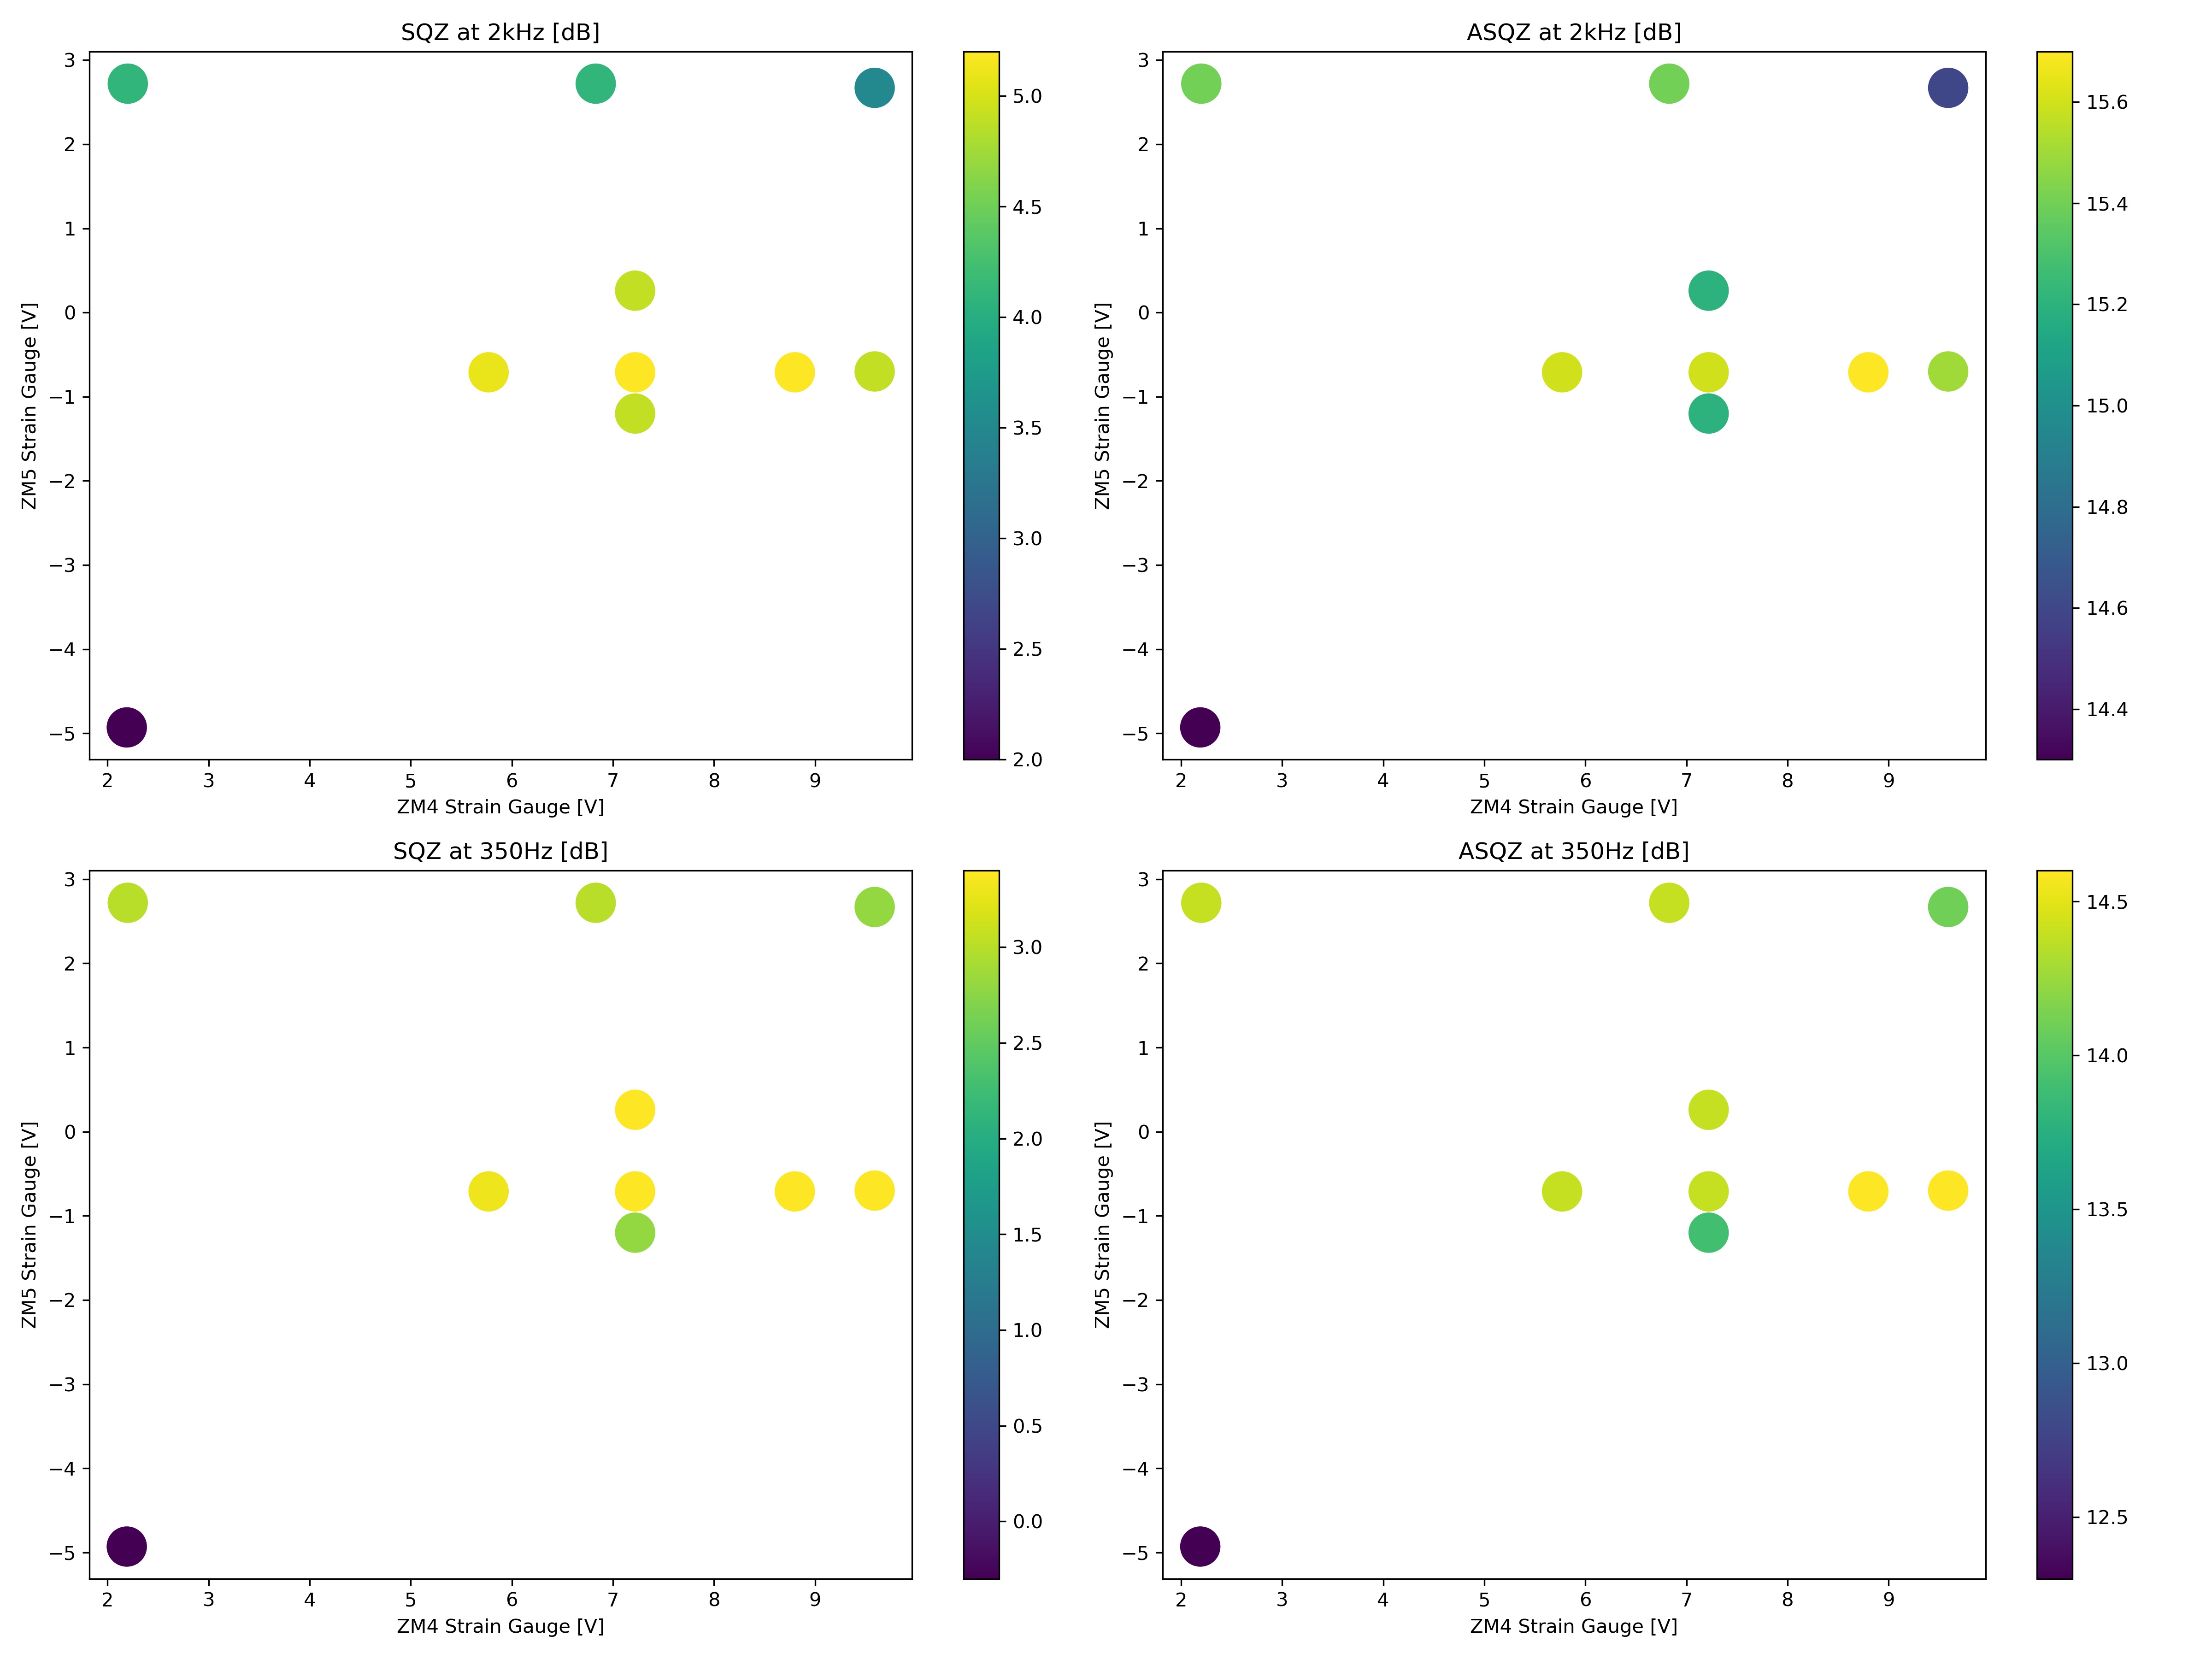
Initially we had relatively little reason to believe that the current settings were optimal. Both PSAMS were centered in their range in terms of voltage after offloading during the commissioning break. We decided to start with a broad scan (see PSAMS.jpg) and chose to prioritize regions not covered by the PSAM scan in 76507. We Note, however, that the scans in 76507 were completed prior to the recomissioning of the SQZ alignment optimization scripts which may impact those results to some degree. We learned that the current point is actually not too far from optimal.
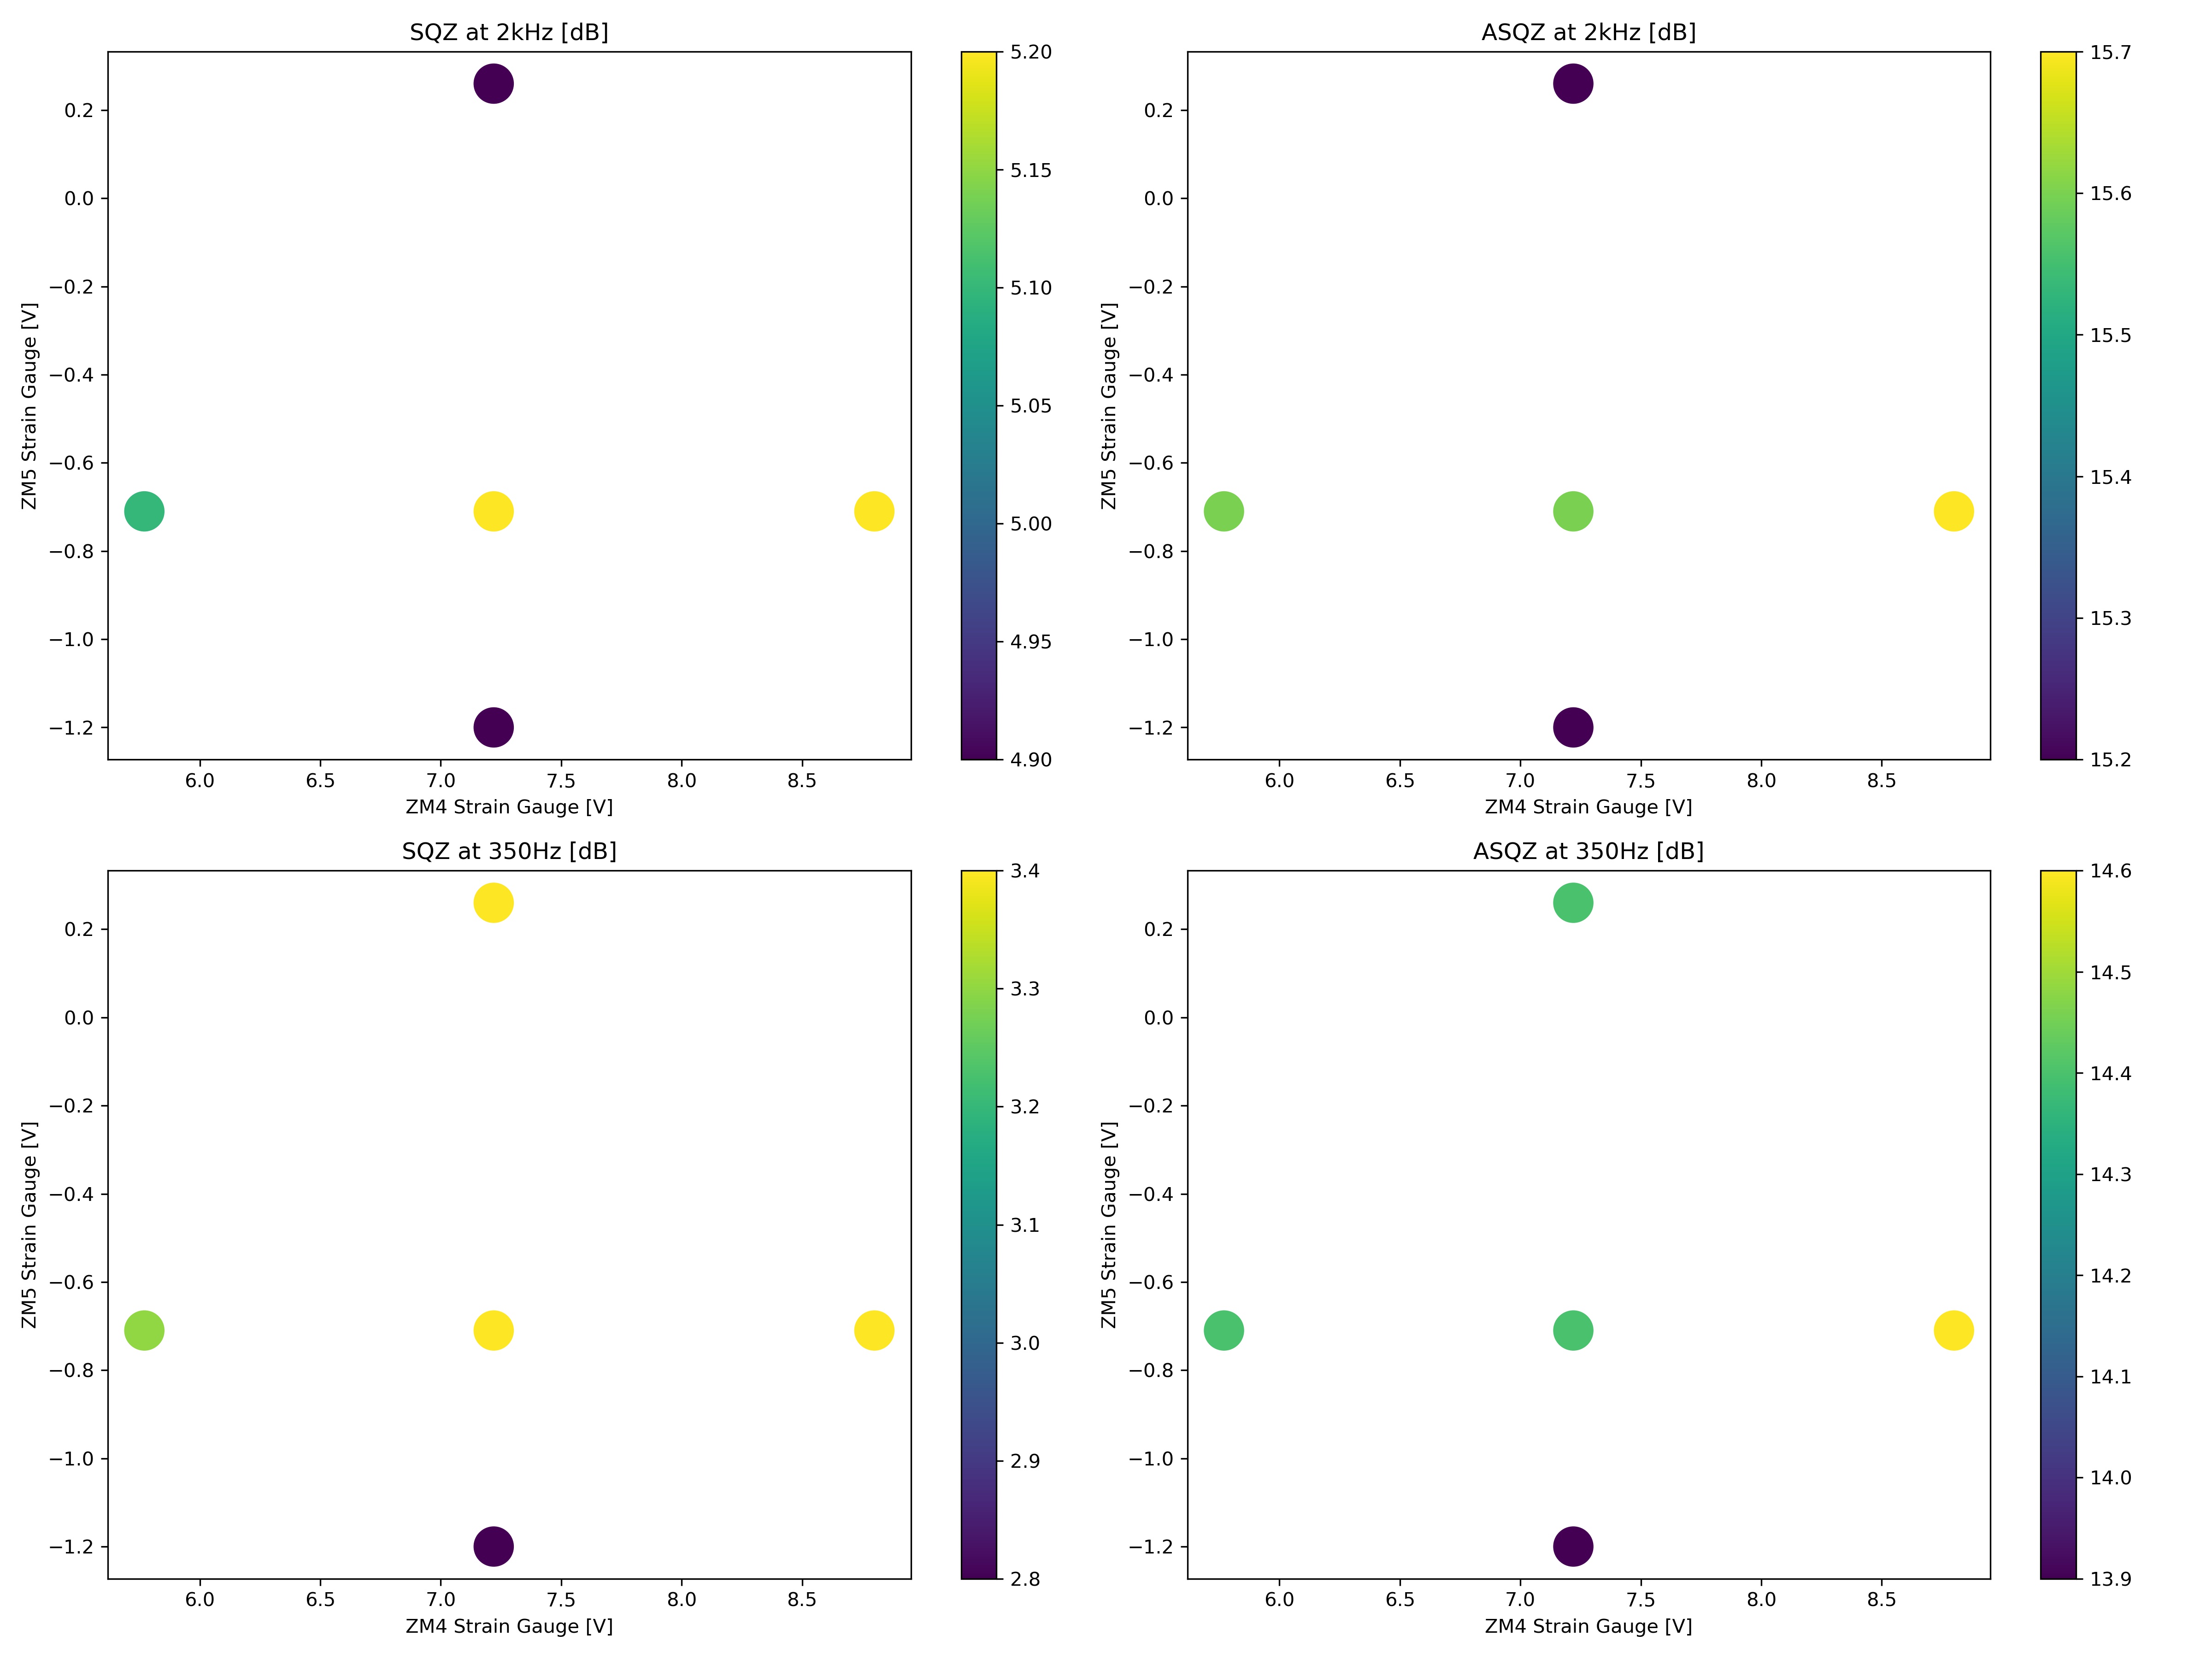
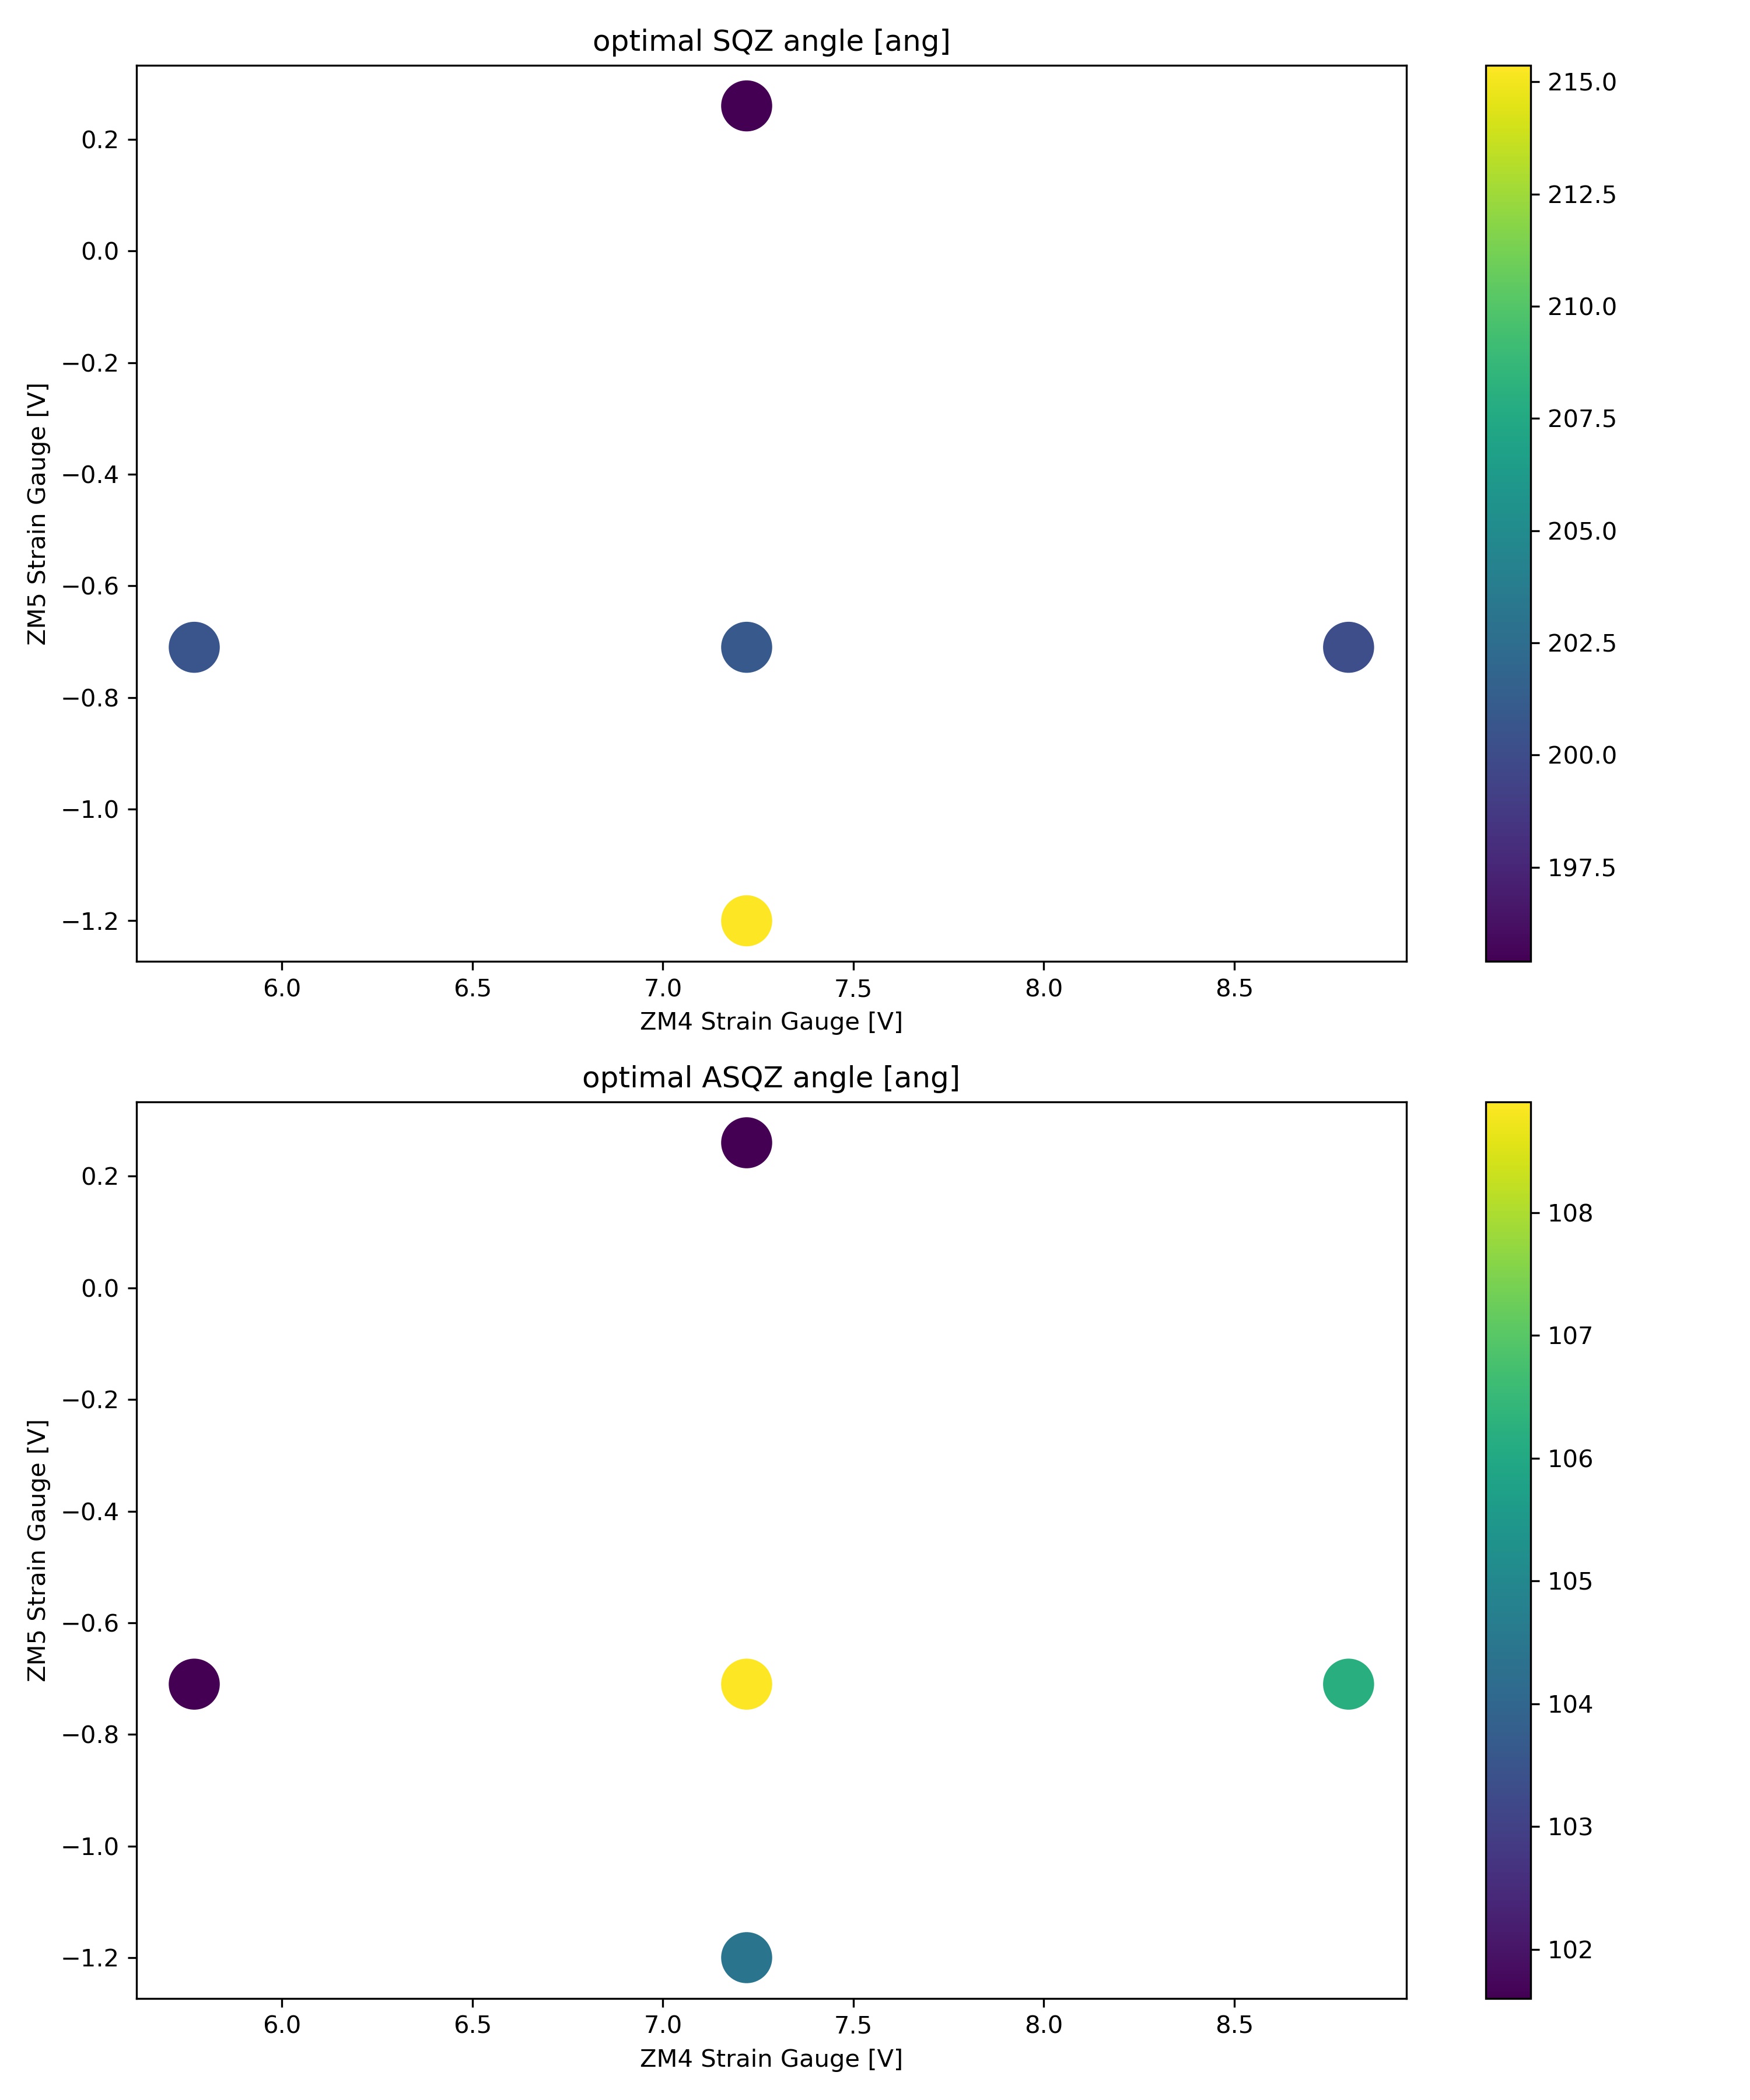
We then narrowed in on points closer to (7.2, -0.72) (see PSAMS_zoom.jpg). It looks like there may be a point which produces slightly higher levels of ASQZ. We would like to explore the area around this PSAM setting more carefully.
A few comments:
- Our process was as follows when optimizing for a new PSAM value:
- Change the voltage on one PSAM optic. This tends to pitch the optic a bit; this is a known issue with the PSAM suspensions.
- Roughly restore the alignment by tilting the PSAM optic to recover the old values in the witness channels.
- Tune the sqz angle to antisqueezing
- Optimize the alignment by running a alignment scan to maximize antisqueezing.
- Repeat with the other PSAM if required.
- Take DARM spectra with the squeezing angle optimized for Squeezing and then Antisqueezing at high frequencies
- We found that step 2 above was much less effective for ZM5 than for ZM4. We speculate that this may be due to the fact that the beam is not completely centered on the ZM5 optic, an observation made during the PSAM offloading in January.
- For now, we are getting our squeezing/asqueezing levels from dtt, but are working on scripting the analysis to use BLRMS data instead.
We've added a script to pull data to do this analyisis to opt/rtcds/userapps/release/sqz/h1/scripts/PSAMS_data/pull_PSAMS_data.py.
It looks at channels = ['H1:AWC-ZM4_PSAMS_STRAIN_VOLTAGE','H1:AWC-ZM5_PSAMS_STRAIN_VOLTAGE', 'H1:SQZ-CLF_REFL_RF6_PHASE_PHASEDEG', 'H1:SQZ-DCPD_RATIO_1_DB_MON', 'H1:SQZ-DCPD_RATIO_3_DB_MON', 'H1:SQZ-DCPD_RATIO_4_DB_MON', 'H1:SQZ-DCPD_RATIO_5_DB_MON', 'H1:SQZ-OMC_TRANS_RF3_DEMOD_RFMON'] which is BLRMS at 85Hz, 350Hz, broad 1kHz, 1.7kHz.
You need to feed it a list of ASQZ and SQZ gpstimes as a text file, example attached, we used data from 76949 and 76925.
Results attached. As expected they mainly agree with Eric's.
First plot zoom_heatmap.png is with reduced color bars to show the details of which of the better PSAMS positions are best, heatmap.png has full color bars showing how bad the minimum PSAMS settings are.