DriptaB, TonyS, RickS, FranciscoL
On Wednesday, April 24, we updated the EPICS variables,
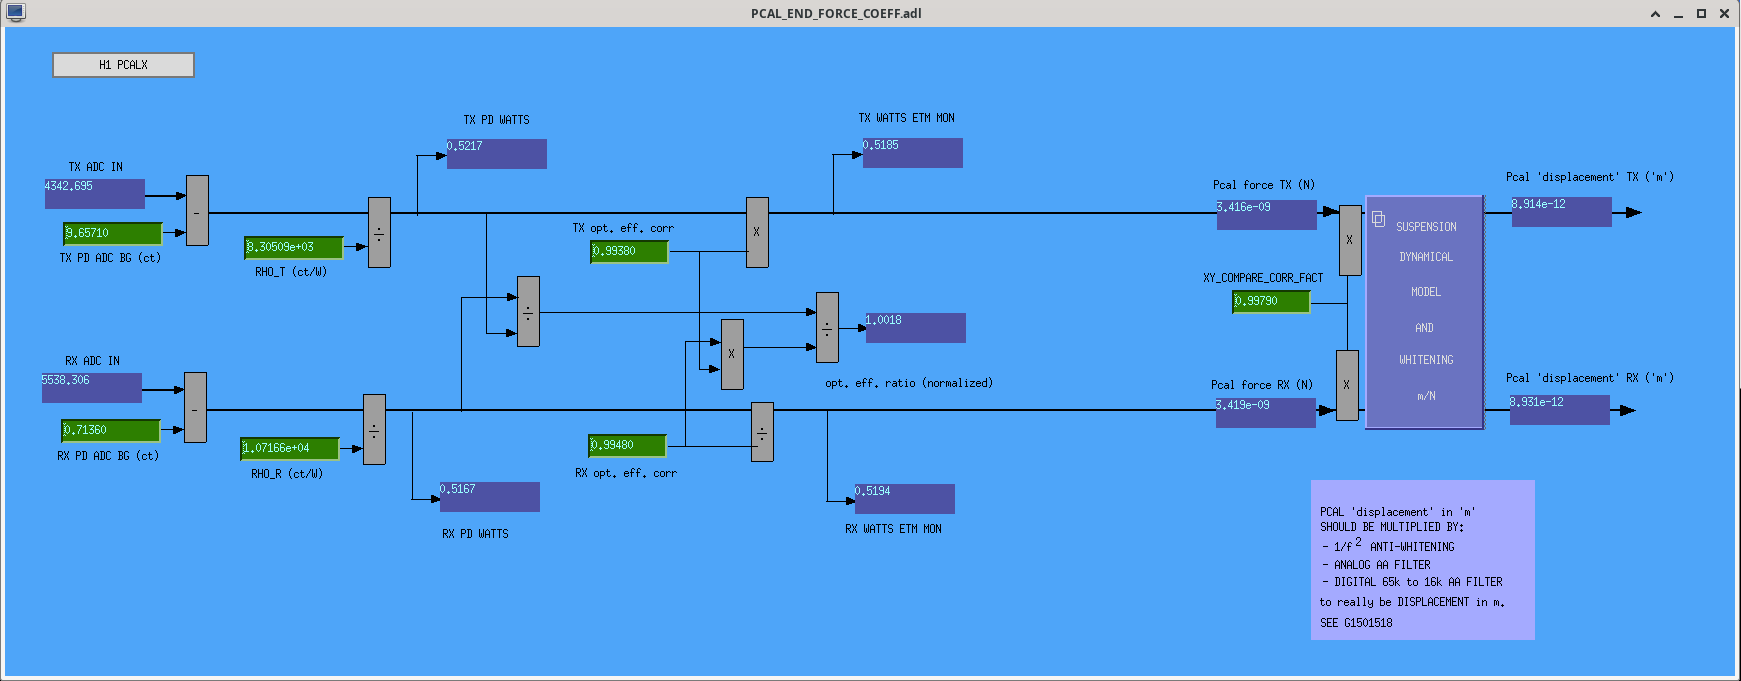
for X-End OLD --> NEW:
H1:CAL-PCALX_FORCE_COEFF_RHO_R | 10692.3 --> 10716.6
H1:CAL-PCALX_FORCE_COEFF_RHO_T | 8334.52 --> 8305.09
H1:CAL-PCALX_FORCE_COEFF_RX_OPT_EFF_CORR | 0.99460 --> 0.99480
H1:CAL-PCALX_FORCE_COEFF_RX_PD_ADC_BG | 0.25990 --> 0.71360
H1:CAL-PCALX_FORCE_COEFF_TX_OPT_EFF_CORR | 0.99350 --> 0.99380
H1:CAL-PCALX_FORCE_COEFF_TX_PD_ADC_BG | 8.81310 --> 9.65710
H1:CAL-PCALX_XY_COMPARE_CORR_FACT | 0.99880 --> 0.99790
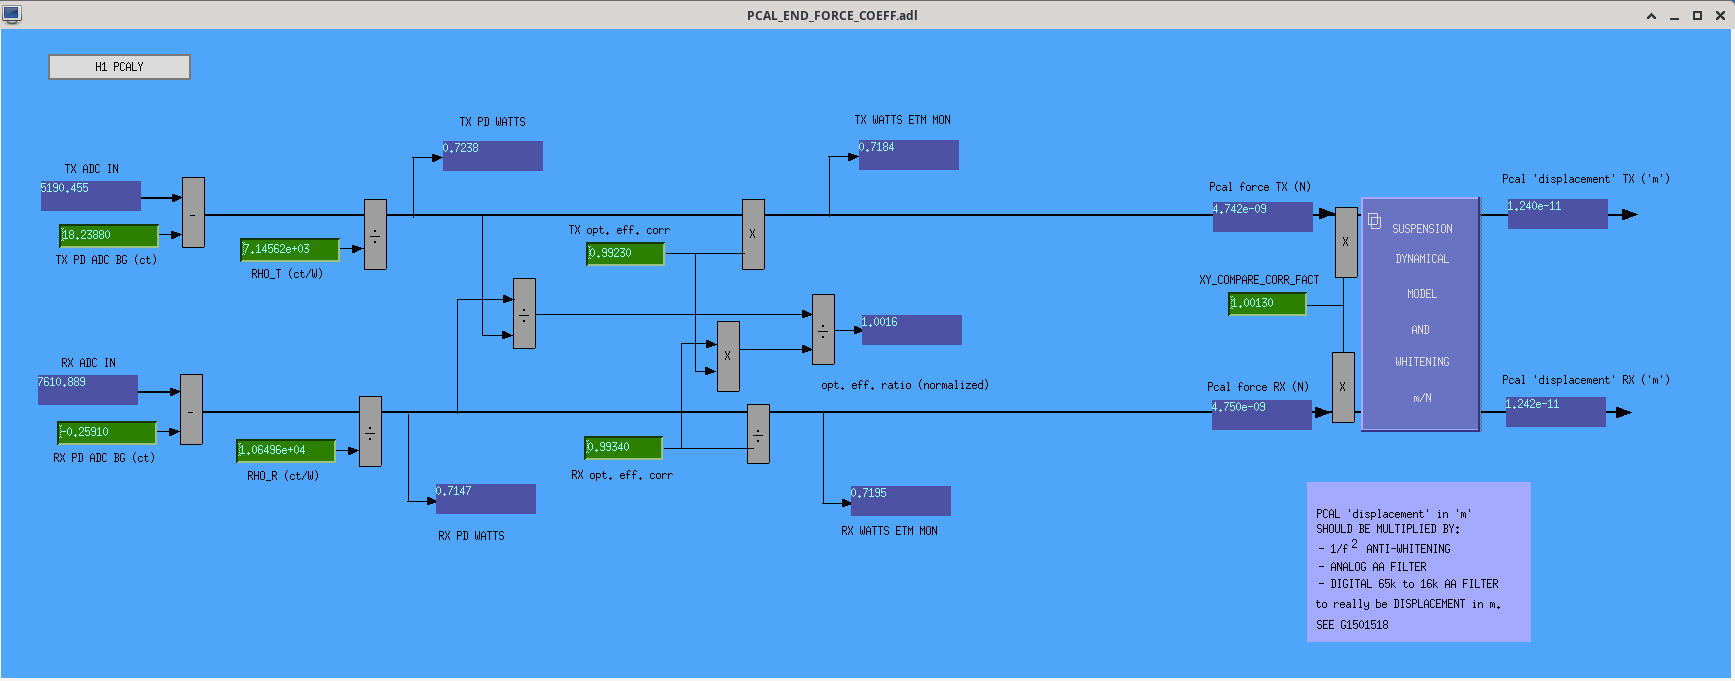
For Y-End OLD --> NEW:
H1:CAL-PCALY_FORCE_COEFF_RHO_R | 10652.0 --> 10649.6
H1:CAL-PCALY_FORCE_COEFF_RHO_T | 7157.80 --> 71456.2
H1:CAL-PCALY_FORCE_COEFF_RX_OPT_EFF_CORR | 0.93100 --> 0.99340
H1:CAL-PCALY_FORCE_COEFF_RX_PD_ADC_BG | -8.15000 --> -0.25910
H1:CAL-PCALY_FORCE_COEFF_TX_OPT_EFF_CORR | 0.92000 --> 0.99230
H1:CAL-PCALY_FORCE_COEFF_TX_PD_ADC_BG | 1.75161 --> 1.82388
H1:CAL-PCALY_XY_COMPARE_CORR_FACT | 1.00150 --> 1.00130
To reflect the most recent calibration of the receiving pcal power sensor (Rx) at both end stations. Screenshots of the MEDM screens show the new values on the green boxes. Attached .txt file shows the caput command used to change the values.
The total chage of -0.16% for X-End, and -0.02% for Y-End for the combined fiducial displacement factors.
We are planning on regularly updating the Pcal calibrations at a cadence of roughly 3 months since over the course of O4a we saw systematic variations on Rx sensor calibration (ct/W) by as much as +/- 0.3% at both sites. The systematic variations at LHO are shown in the 'RxprimeTrendsLHOXandYO4a_wRxTemp.pdf', the top panel for X-end and the bottom one for Y-end. The scatterplot with error bars represent Rx responsivity (units of ct/W) values from pcal end station measurements normalized to the EPICS variable entered for $\rho_R'$, where $\rho$ is the responsivity and prime denotes corrected for optical efficiency, at the beginning of O4a. Values are denoted on the left-hand side of the y-axis. The large dataset represents temperature measurements of the corresponding VEA, and the values are denoted on the right-hand side of the y-axis. These plots suggest that variations on the calibration of the Rx sensor might be due to outside temperature variations, investigations ongoing.
End station measurements allow us to monitor the change in Rx calibration over time. Every end station measurements produce a report that includes a plot in units of ct/W, along with a calibration of the working standard power sensor (WS) made on the same day. We will continue making end station measurements regularly and depending on how much the Rx calibration changes over time, we may update the Pcal EPICS variables.