Minhyo
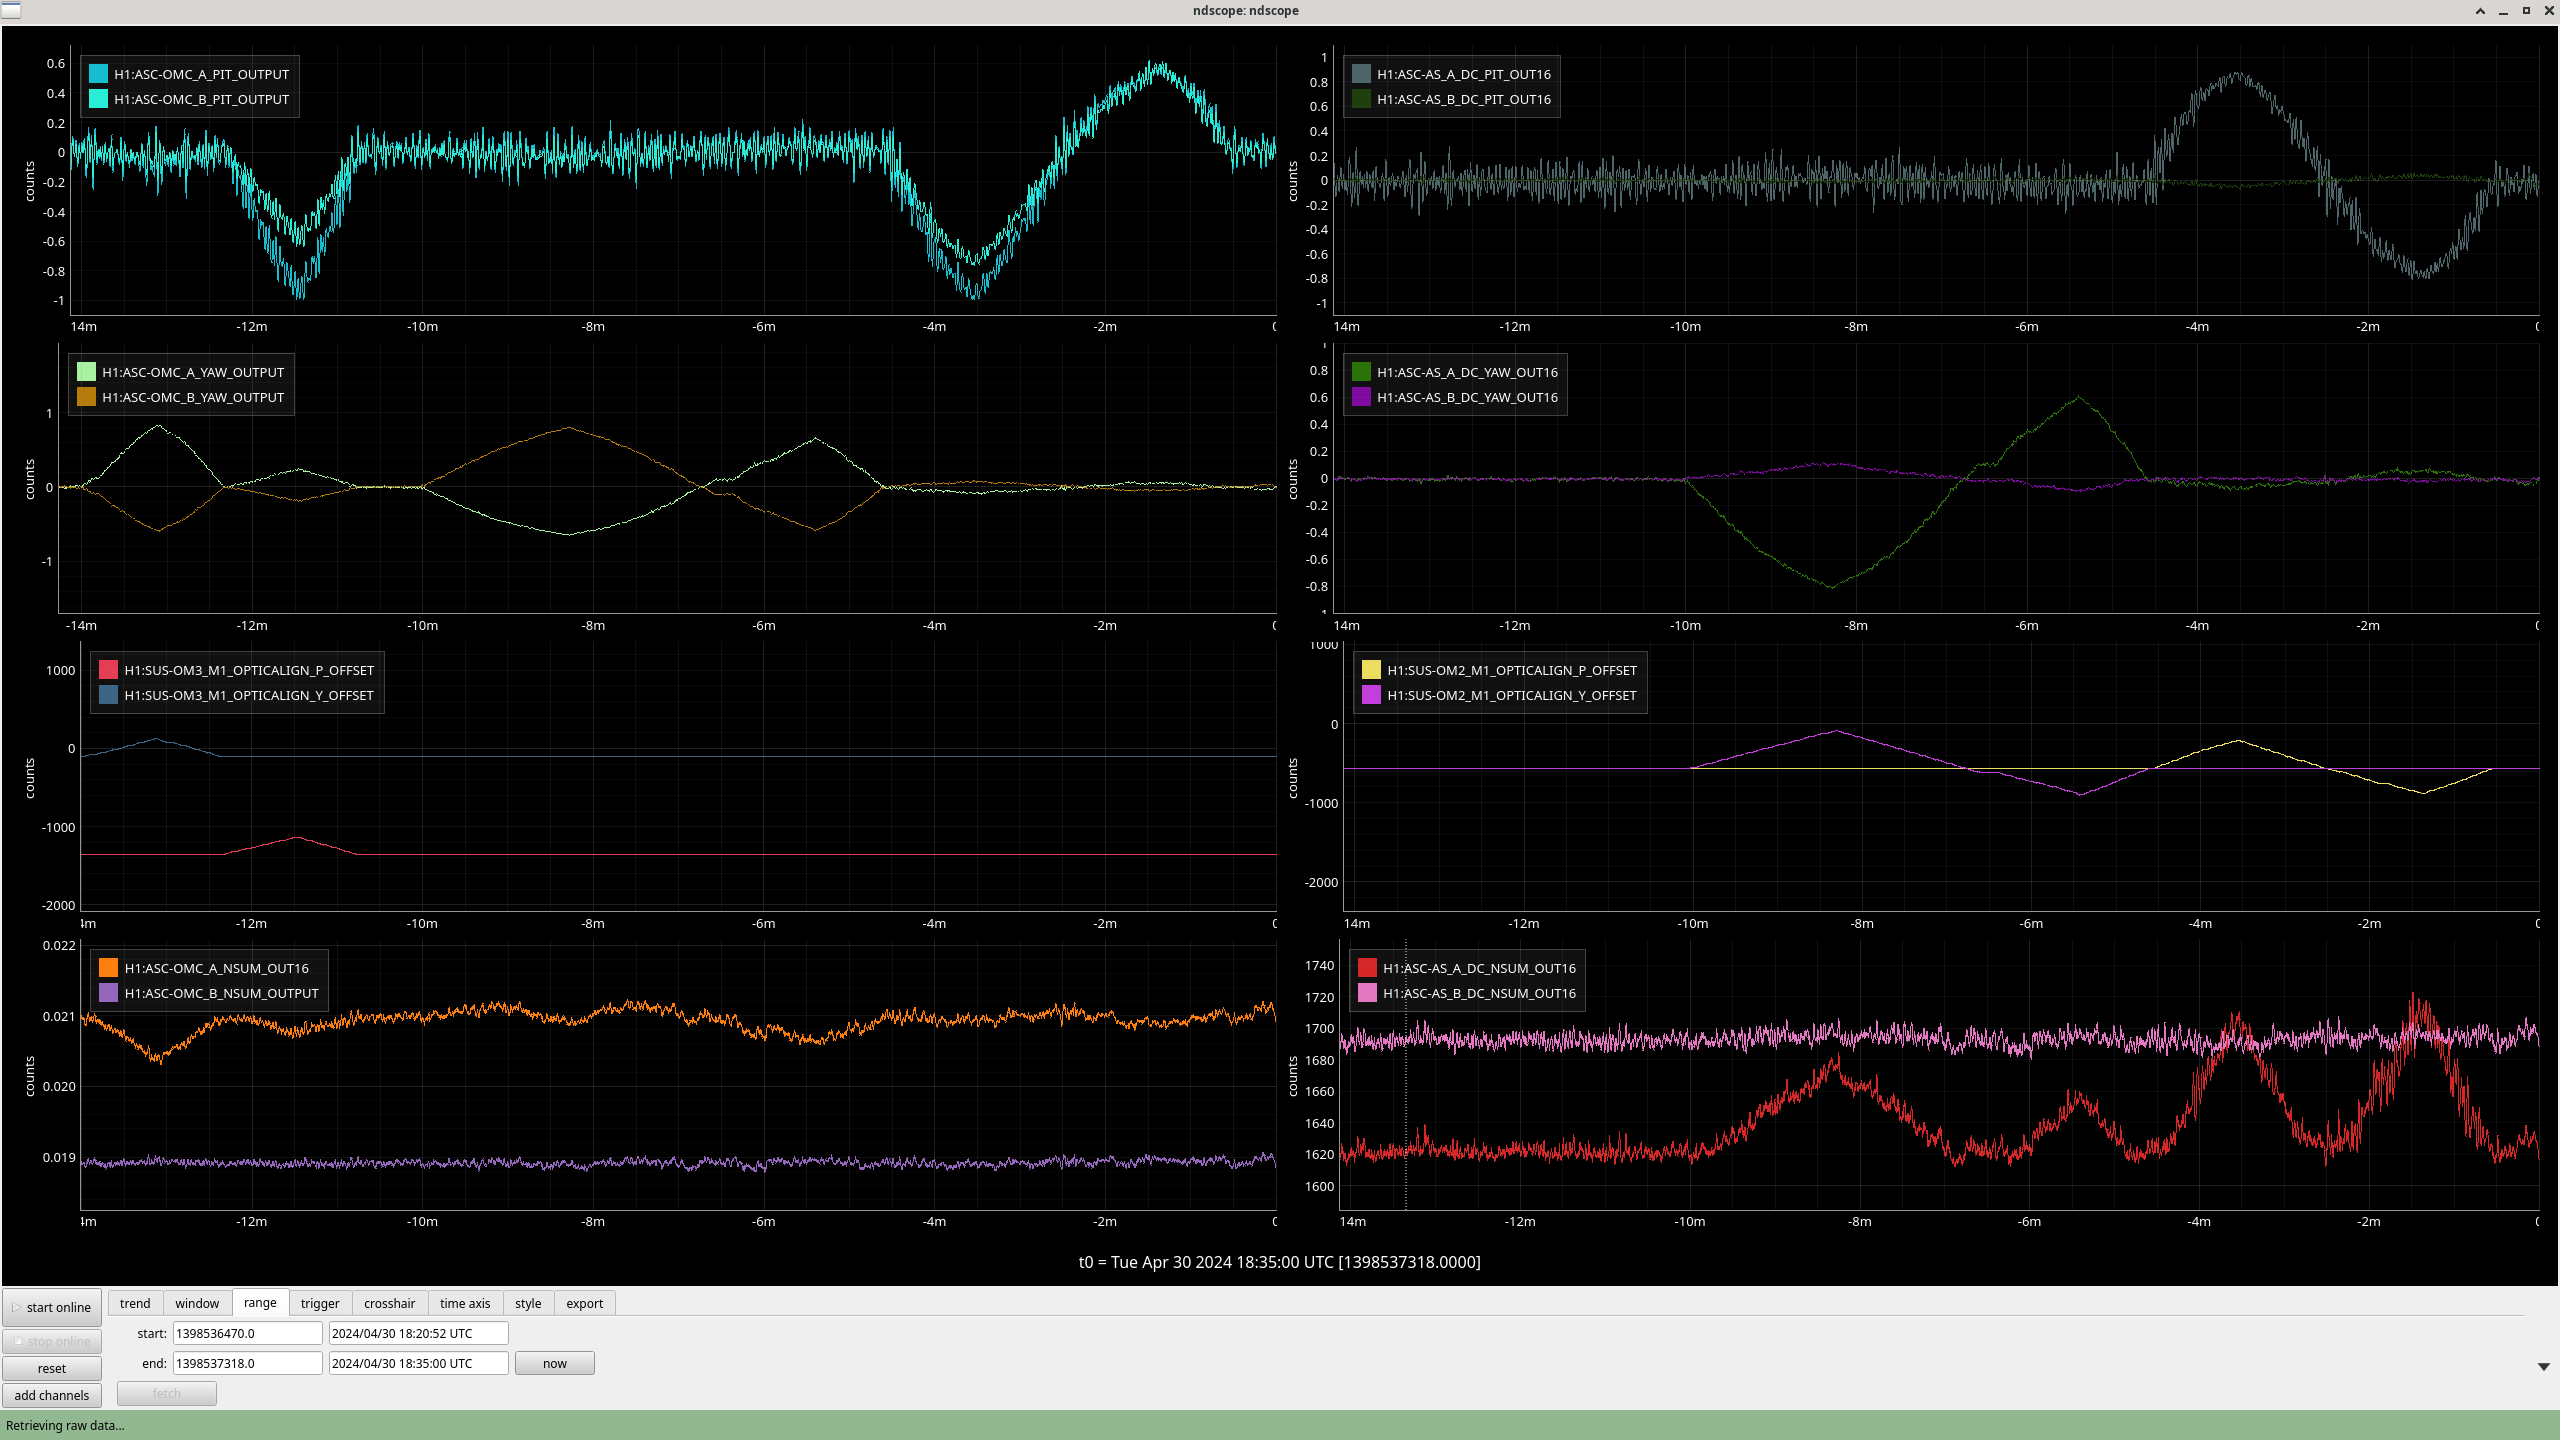
Tried move the beam on OMC QPD using single bounce beam (ITMX misaligned). Changed OM3 PIT & YAW from 18:04:45 UTC (gps: 1398534729).
- Tried same task with OM3, with turning off ASC centering, OMC centering, started new from 18:21:00 UTC (gps: 1398536470).
After finishing with OMC QPD, reverted all settings with OM3 and then moved to OM2.
- Moved OM2 PIT&YAW to check ASC-AS_A & B. Finished at 18:35:00 UTC (gps: 1398537318)
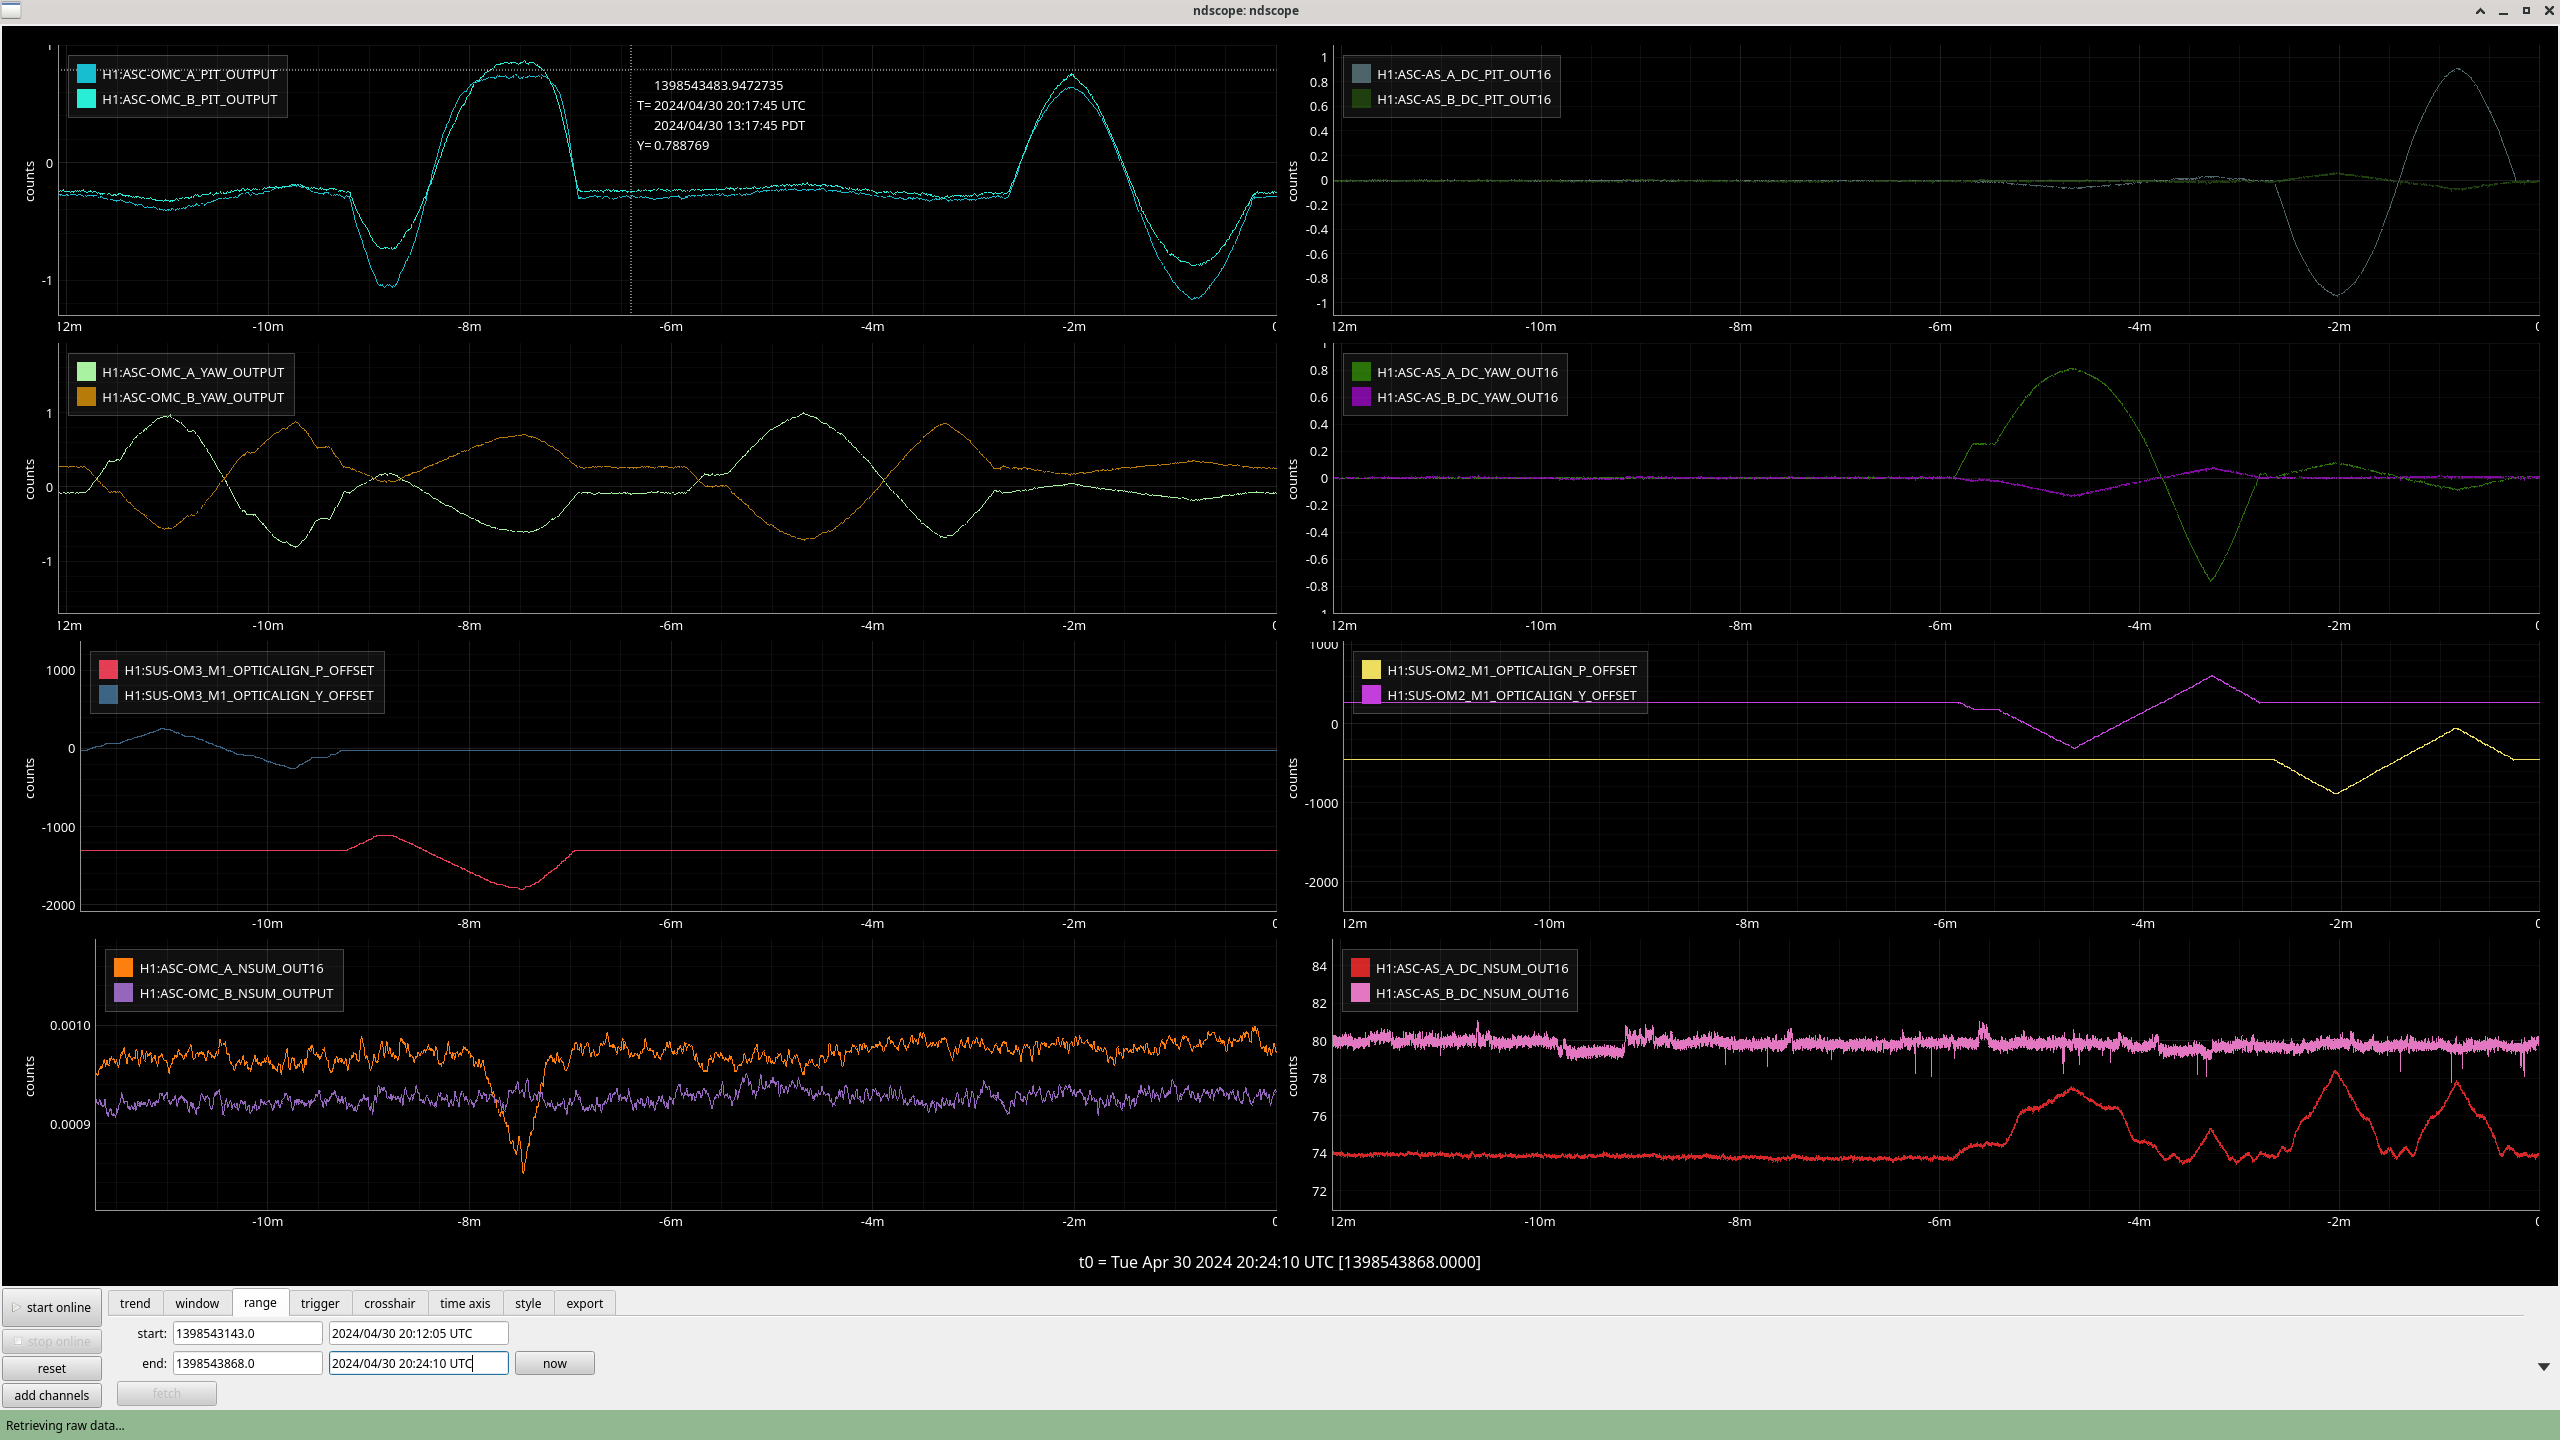
Same job was done (moving OM3 -> OM2) with SQZ beam on OMC (from 20:12:05 UTC to 20:24:00 UTC, gps:1398543158-1398543858)
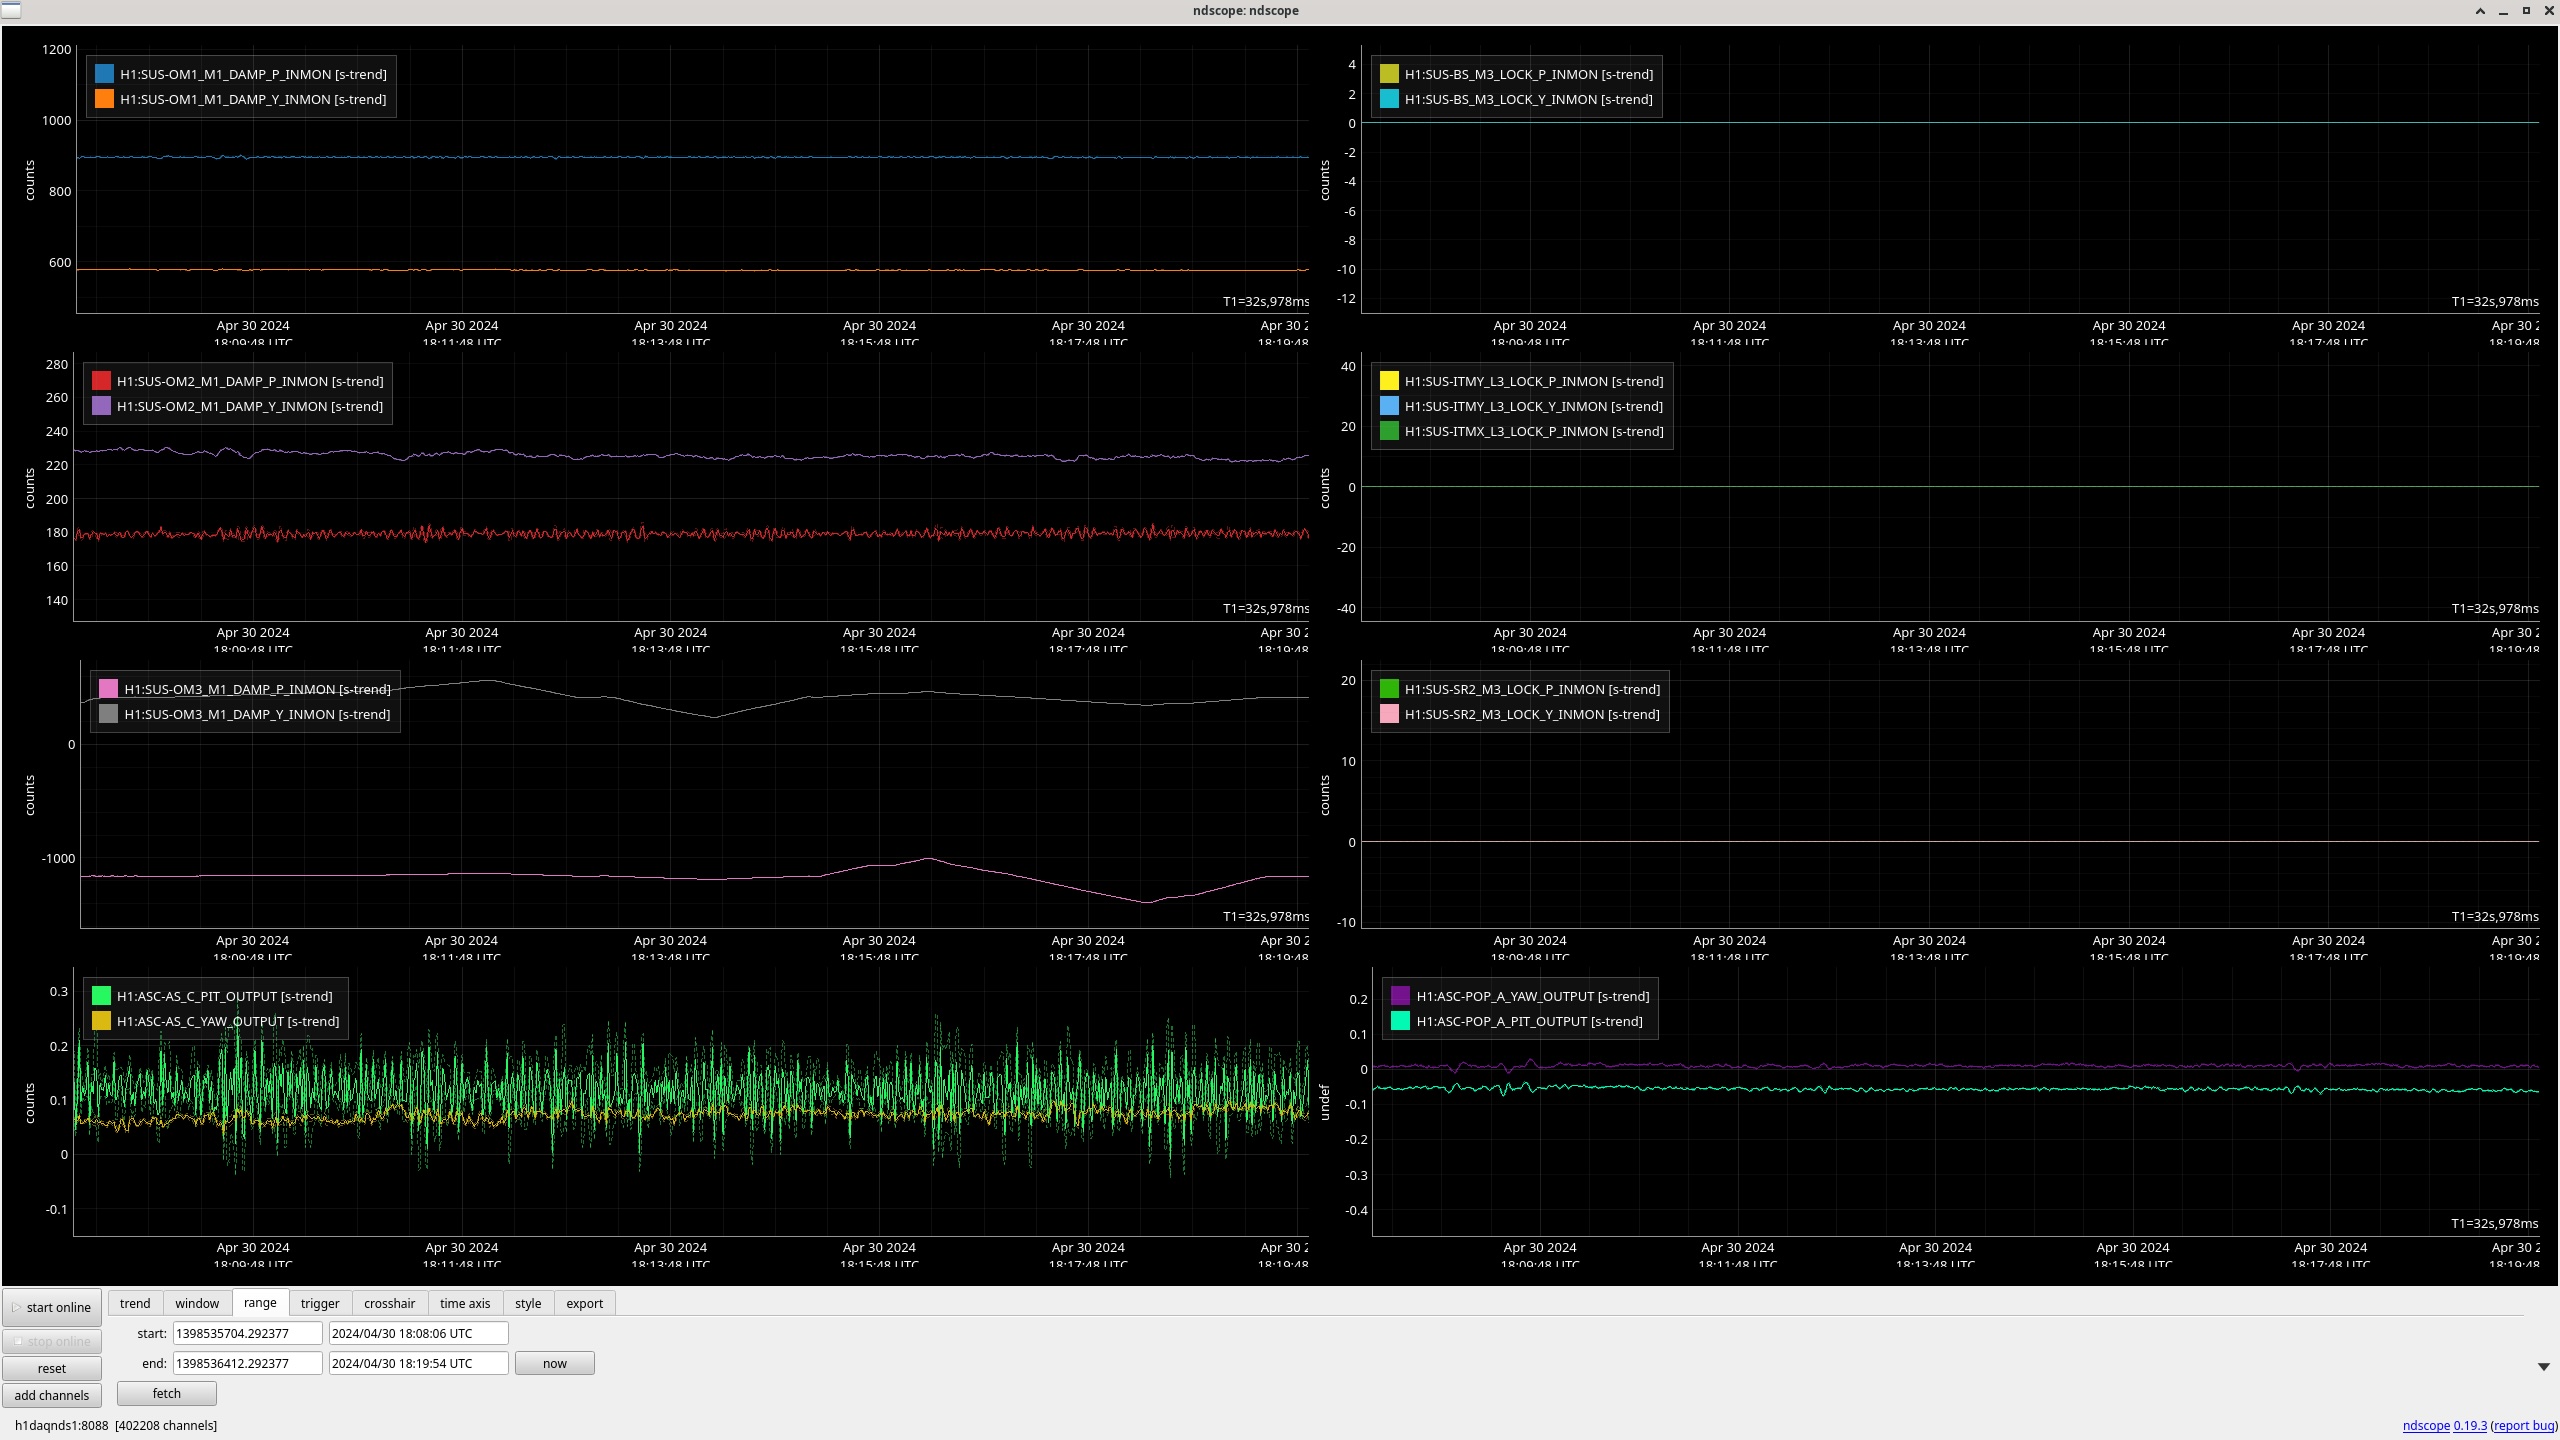
Screenshots (ndscope) are: 1) Measurement with single bounce beam, 2) Measurement with SQZ beam
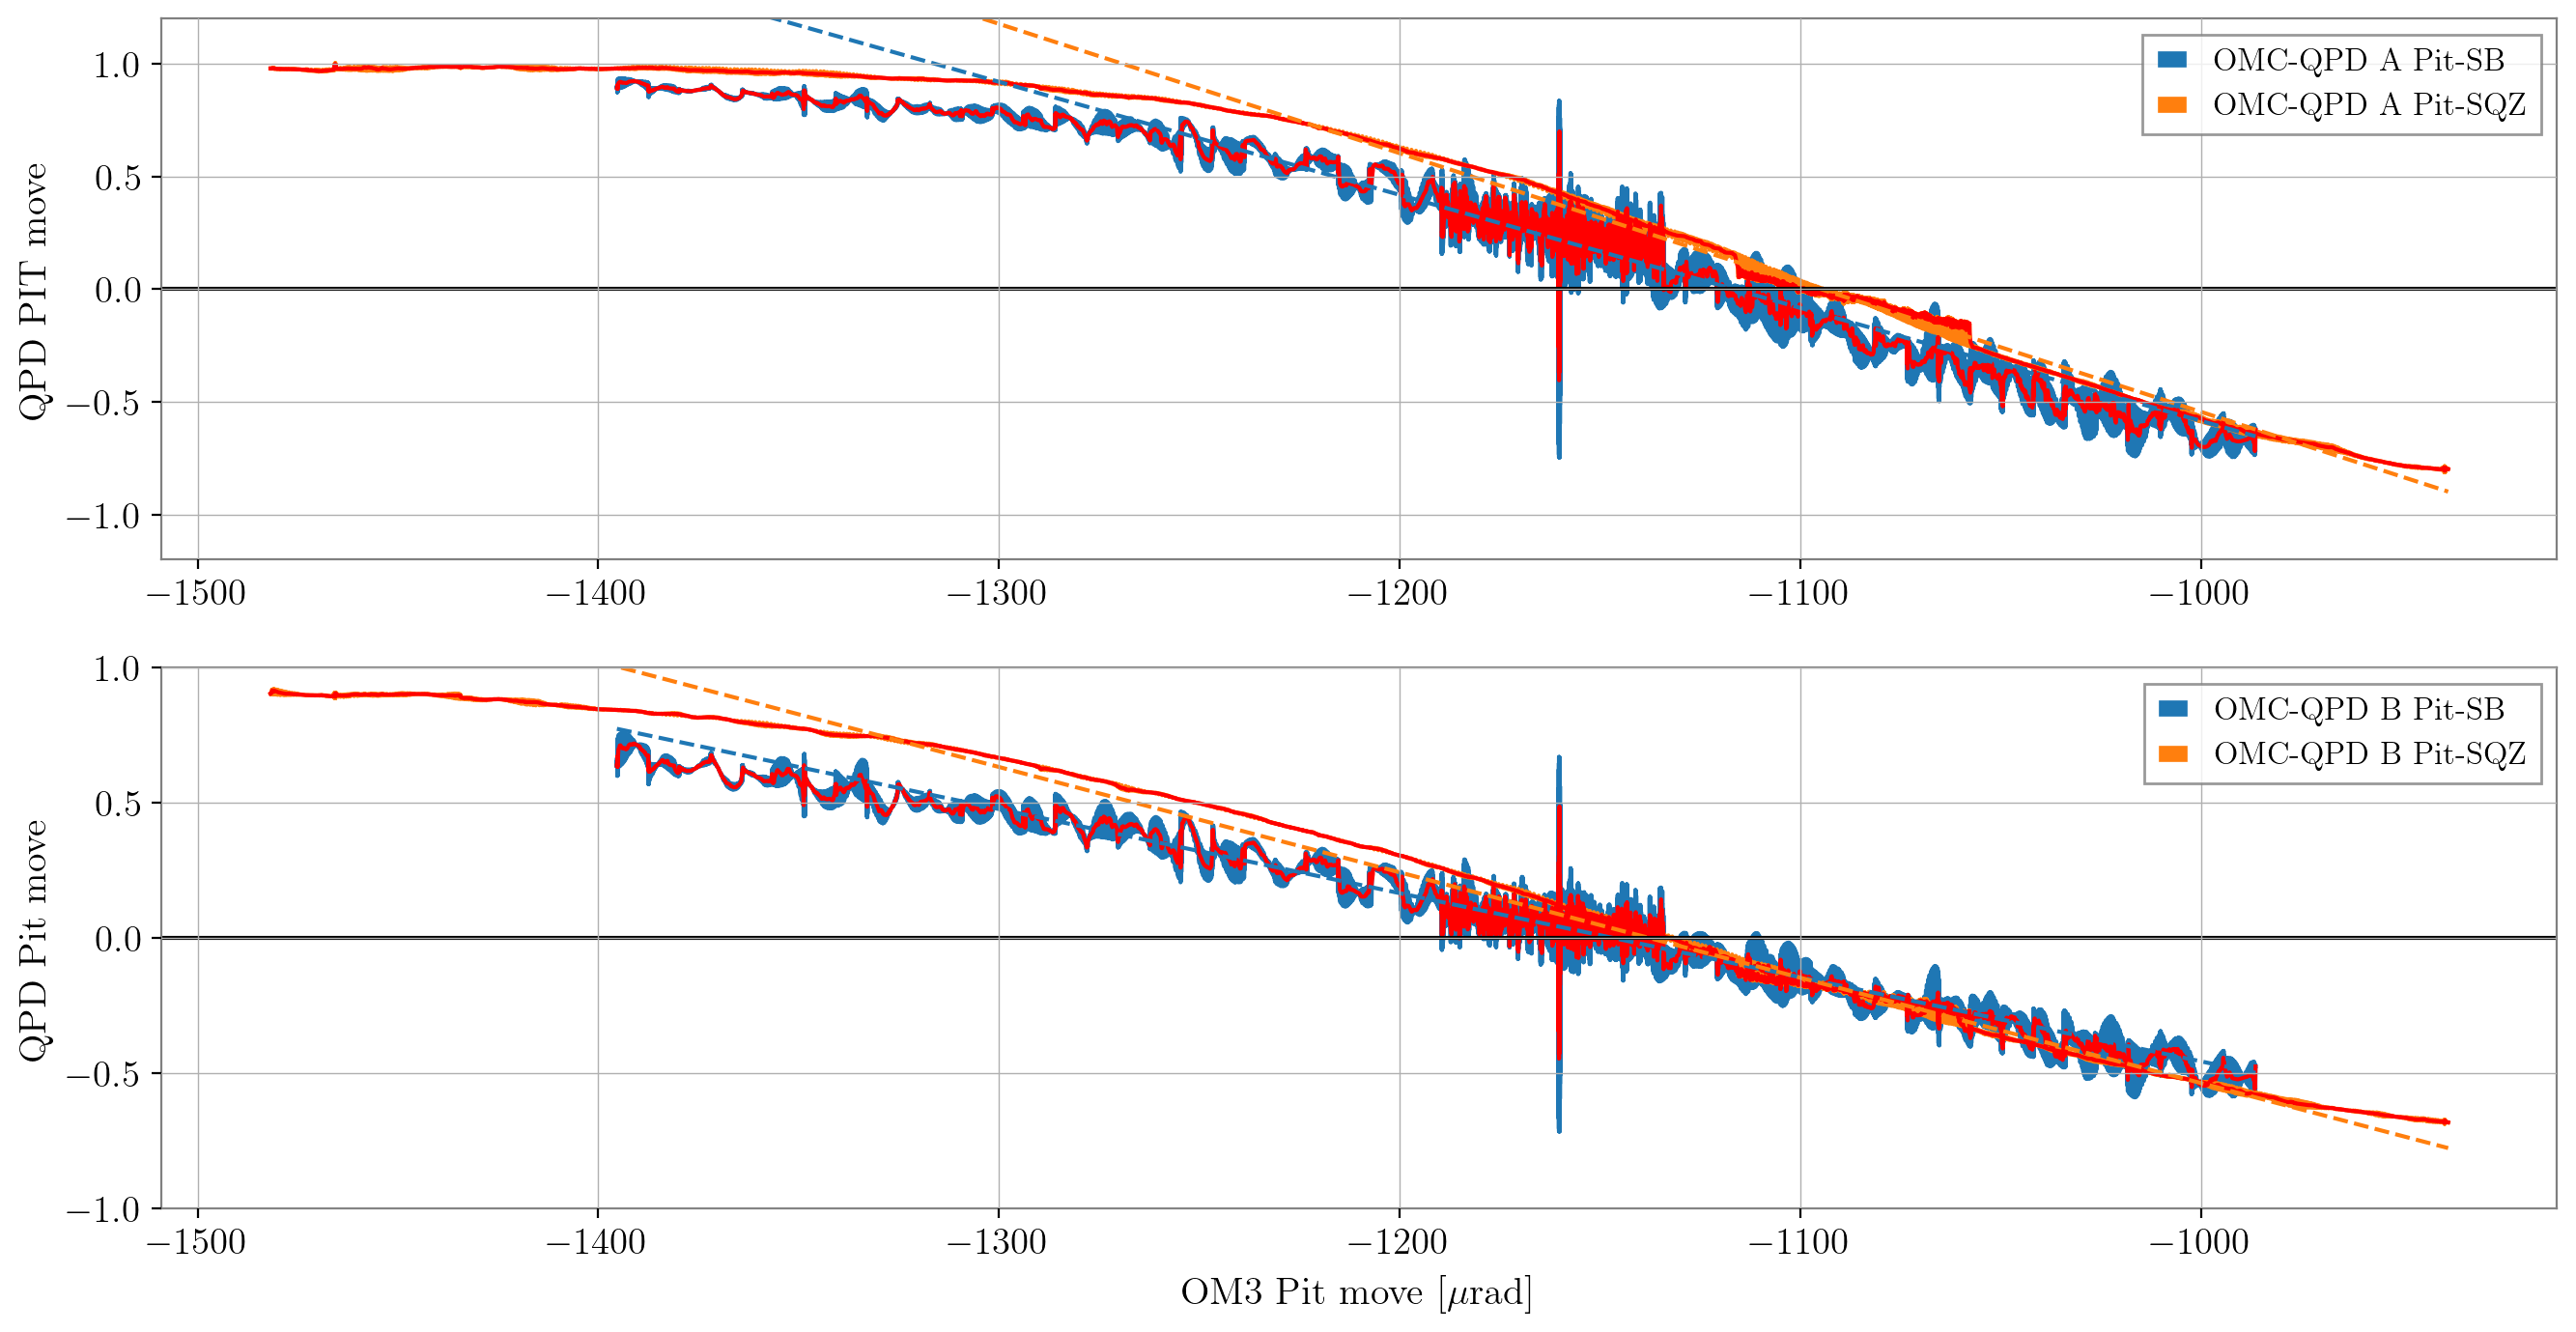
Summary of OMC-QPD profile measurement
Qualitative comparison of beam profile between single bounce (SB) beam and squeezer (SQZ) beam, arriving at the OMC-QPD. These measurement are done by comparing PIT and YAW response with OM3 movements. PIT and YAW response at around the center is expected to be inversely proportional to the beam diameter.
The valid data of each beam can be obtained
1) SB: 18:08:00 ~ 18:19:48 (UTC) -- with WFS centering on
2) SQZ: 20:12:00 ~ 20:18:00 (UTC) -- w/o WFS centering (mistake)
Since AS_C centering was off, it would be not perfect data, but judging from those measurement, SQZ beam is smaller than the SB beam. The
Below table is showing the relative ratio between SB and SQZ, with PIT and YAW individually.
| QPD A | QPD B | |
| PIT | 14.4% | 25.3% |
| YAW | 30% | 31% |
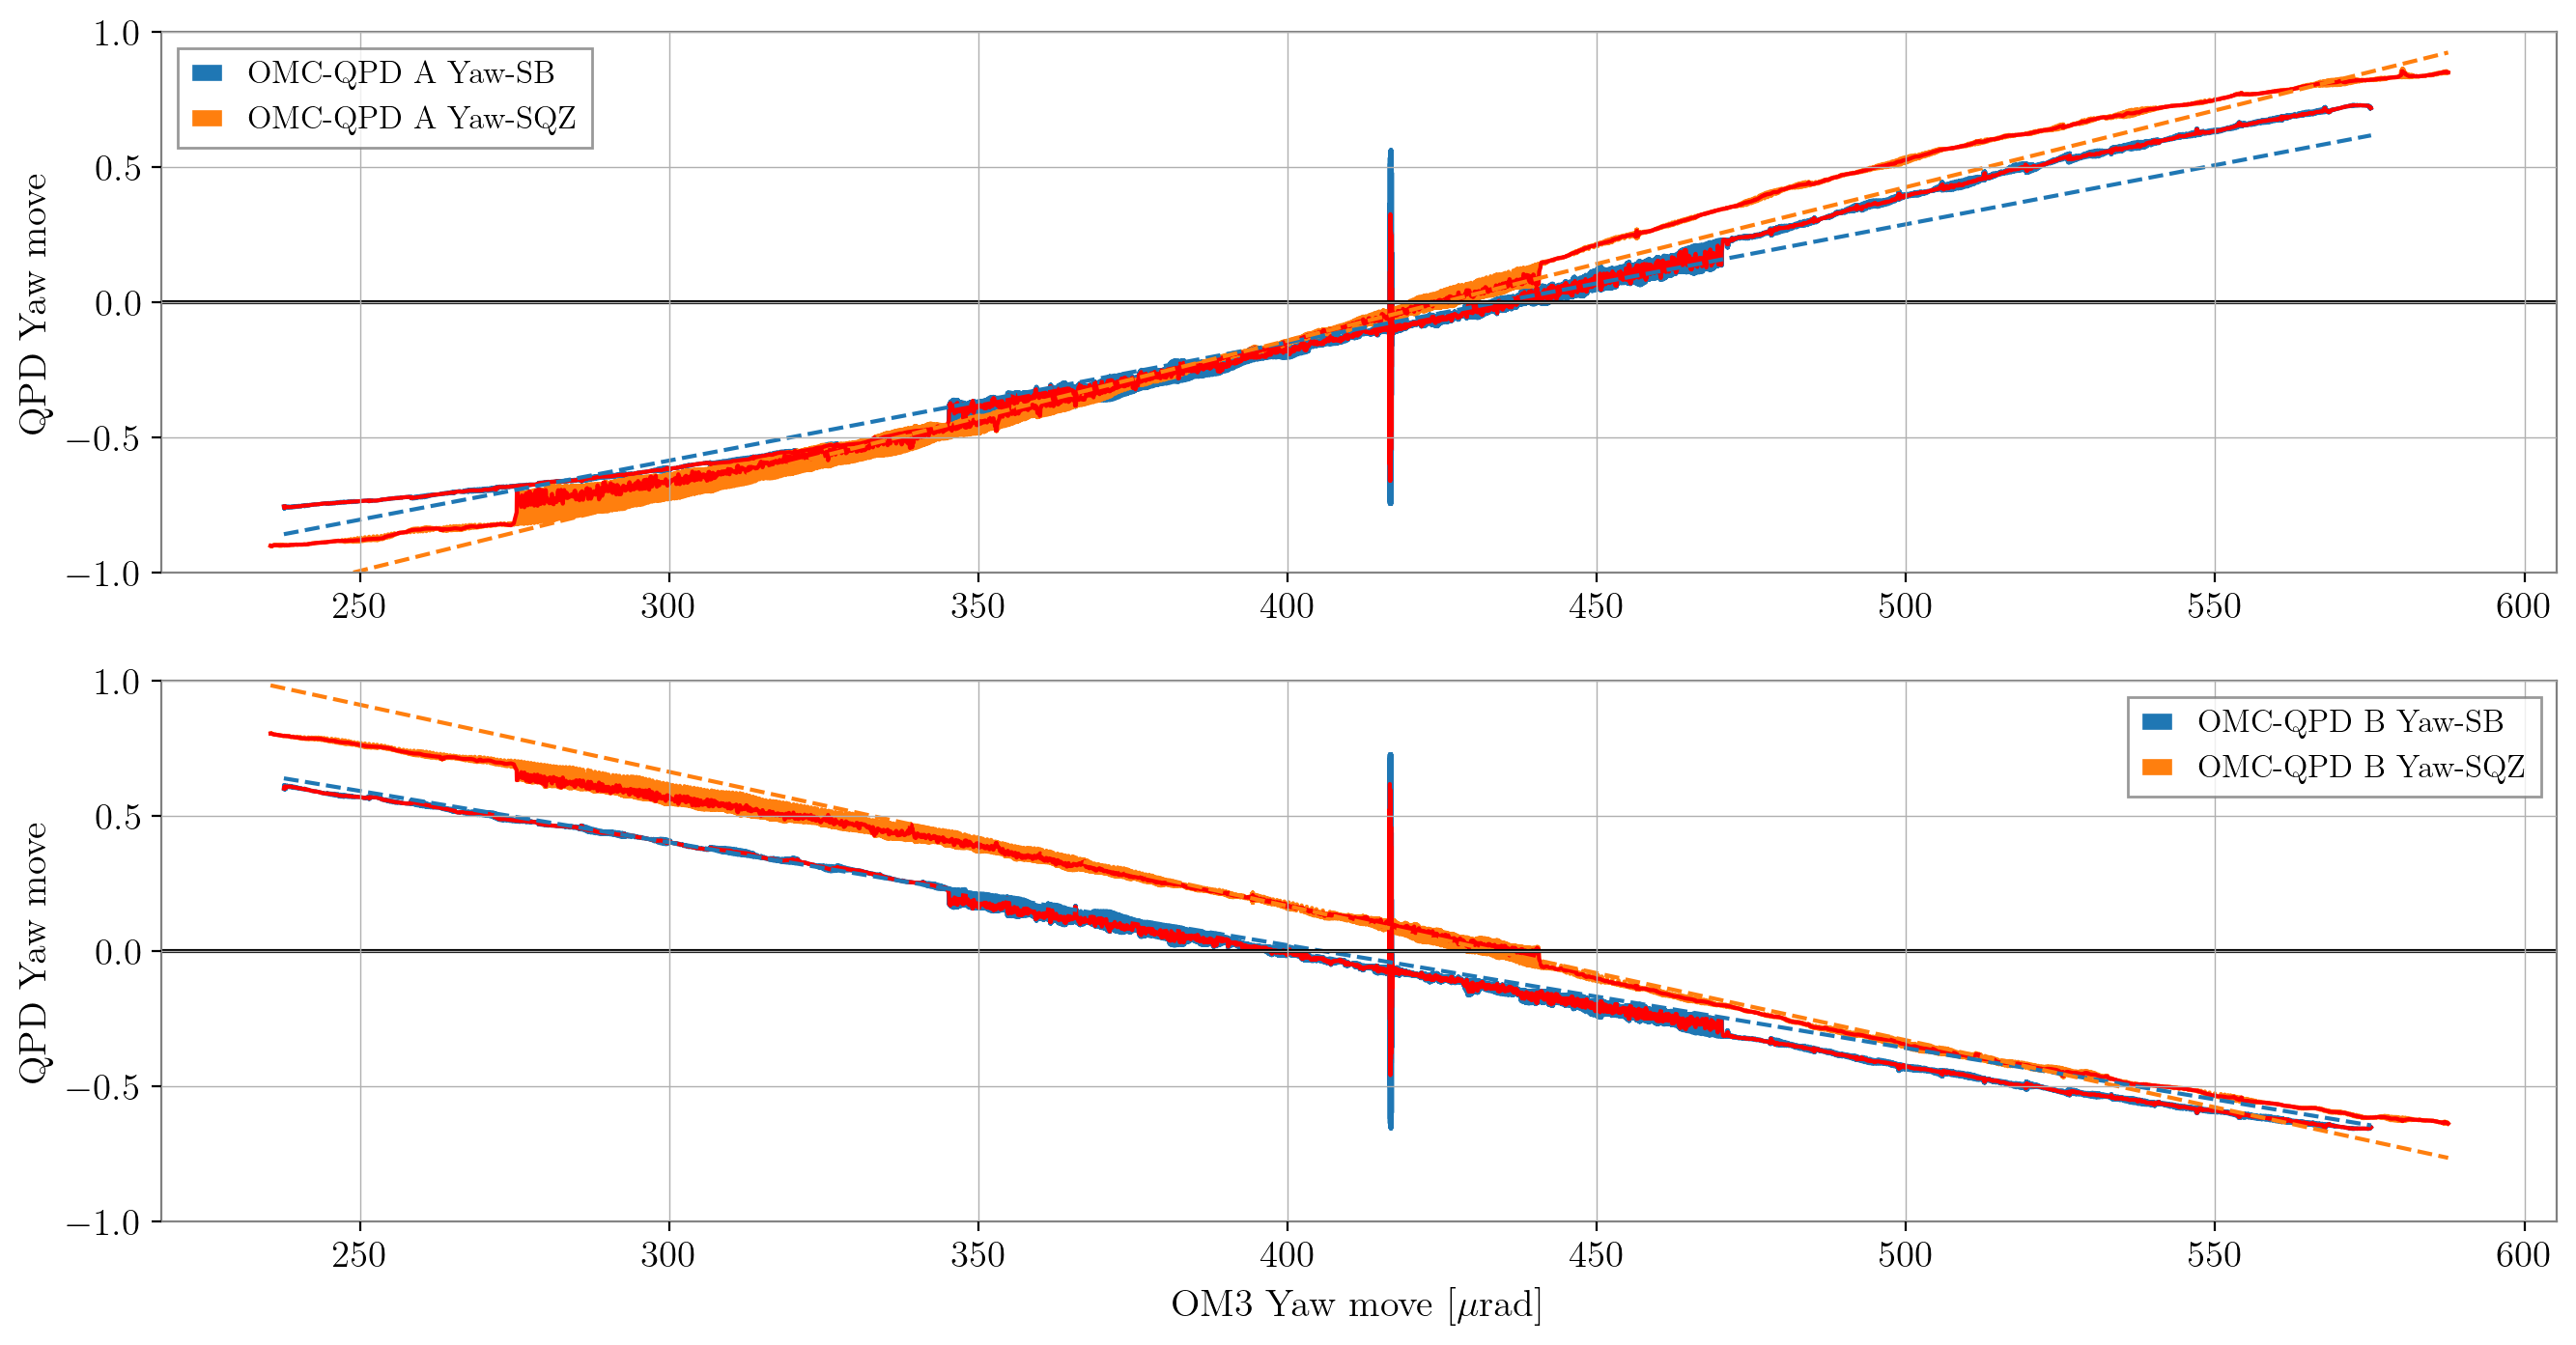
Added screenshots of comparison: 1) PIT comparison, 2) YAW comparison
Red lines are the plots that applied with the low-pass filter, and dashed lines are linear fitted lines in the range of (-1, 1) for both PIT and YAW.
Minhyo, Keita
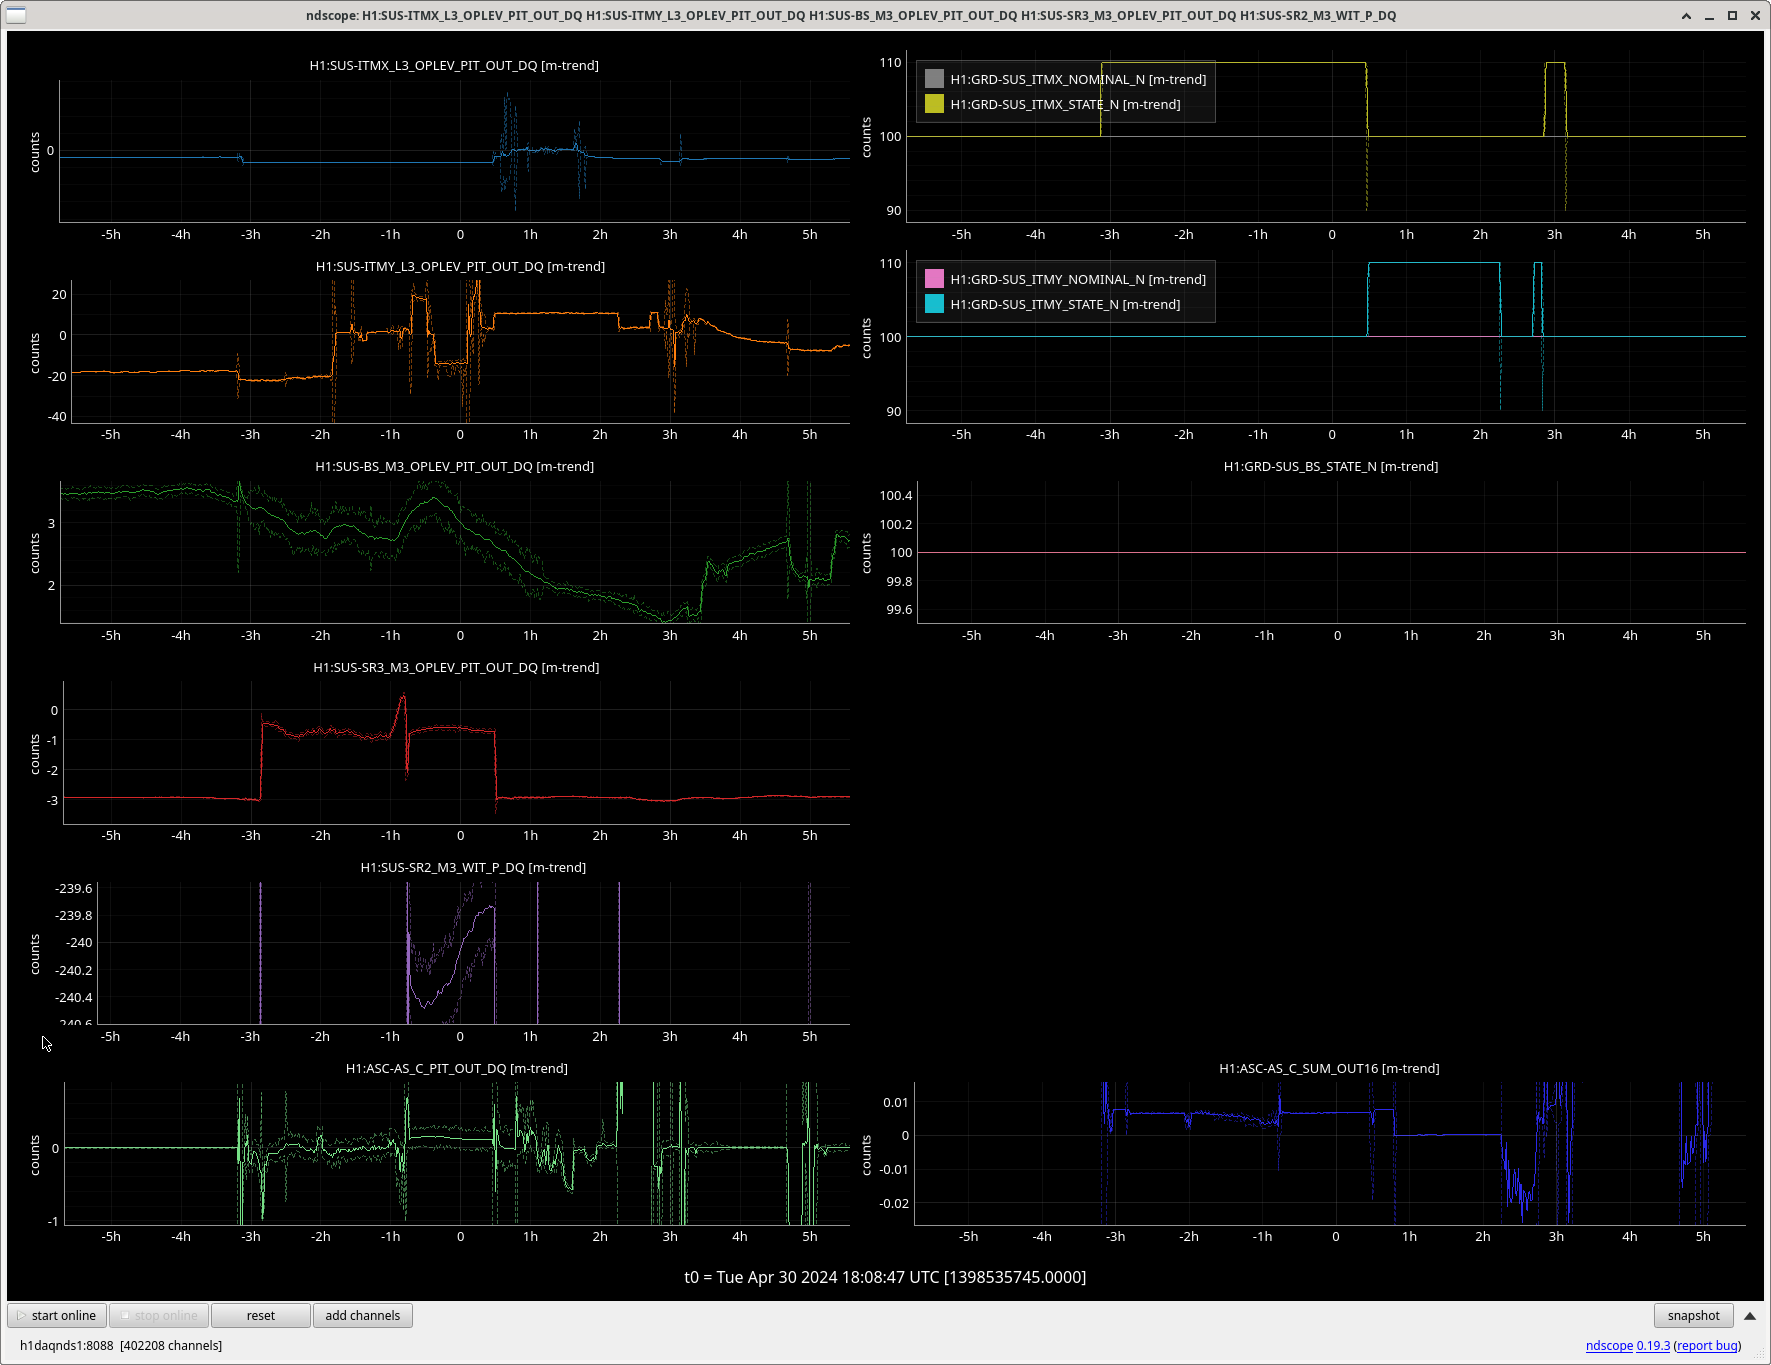
As the PIT response on both QPD A and B are noisy, Keita and I checked for the source of that noise. By looking at multiple channel (1st screenshot), we found that ASC-AS_C PIT is also showing large noises.
Keita checked on the witness sensors of the mirrors before ASC-AS_C, and found out that beam splitter (BS) mirror is also showing large oscillation at around the SB measurement time (2nd screenshot). Checking with the ITMX(Y) status, it seems that BS is noisy after making single bounce (SB) beam condition.
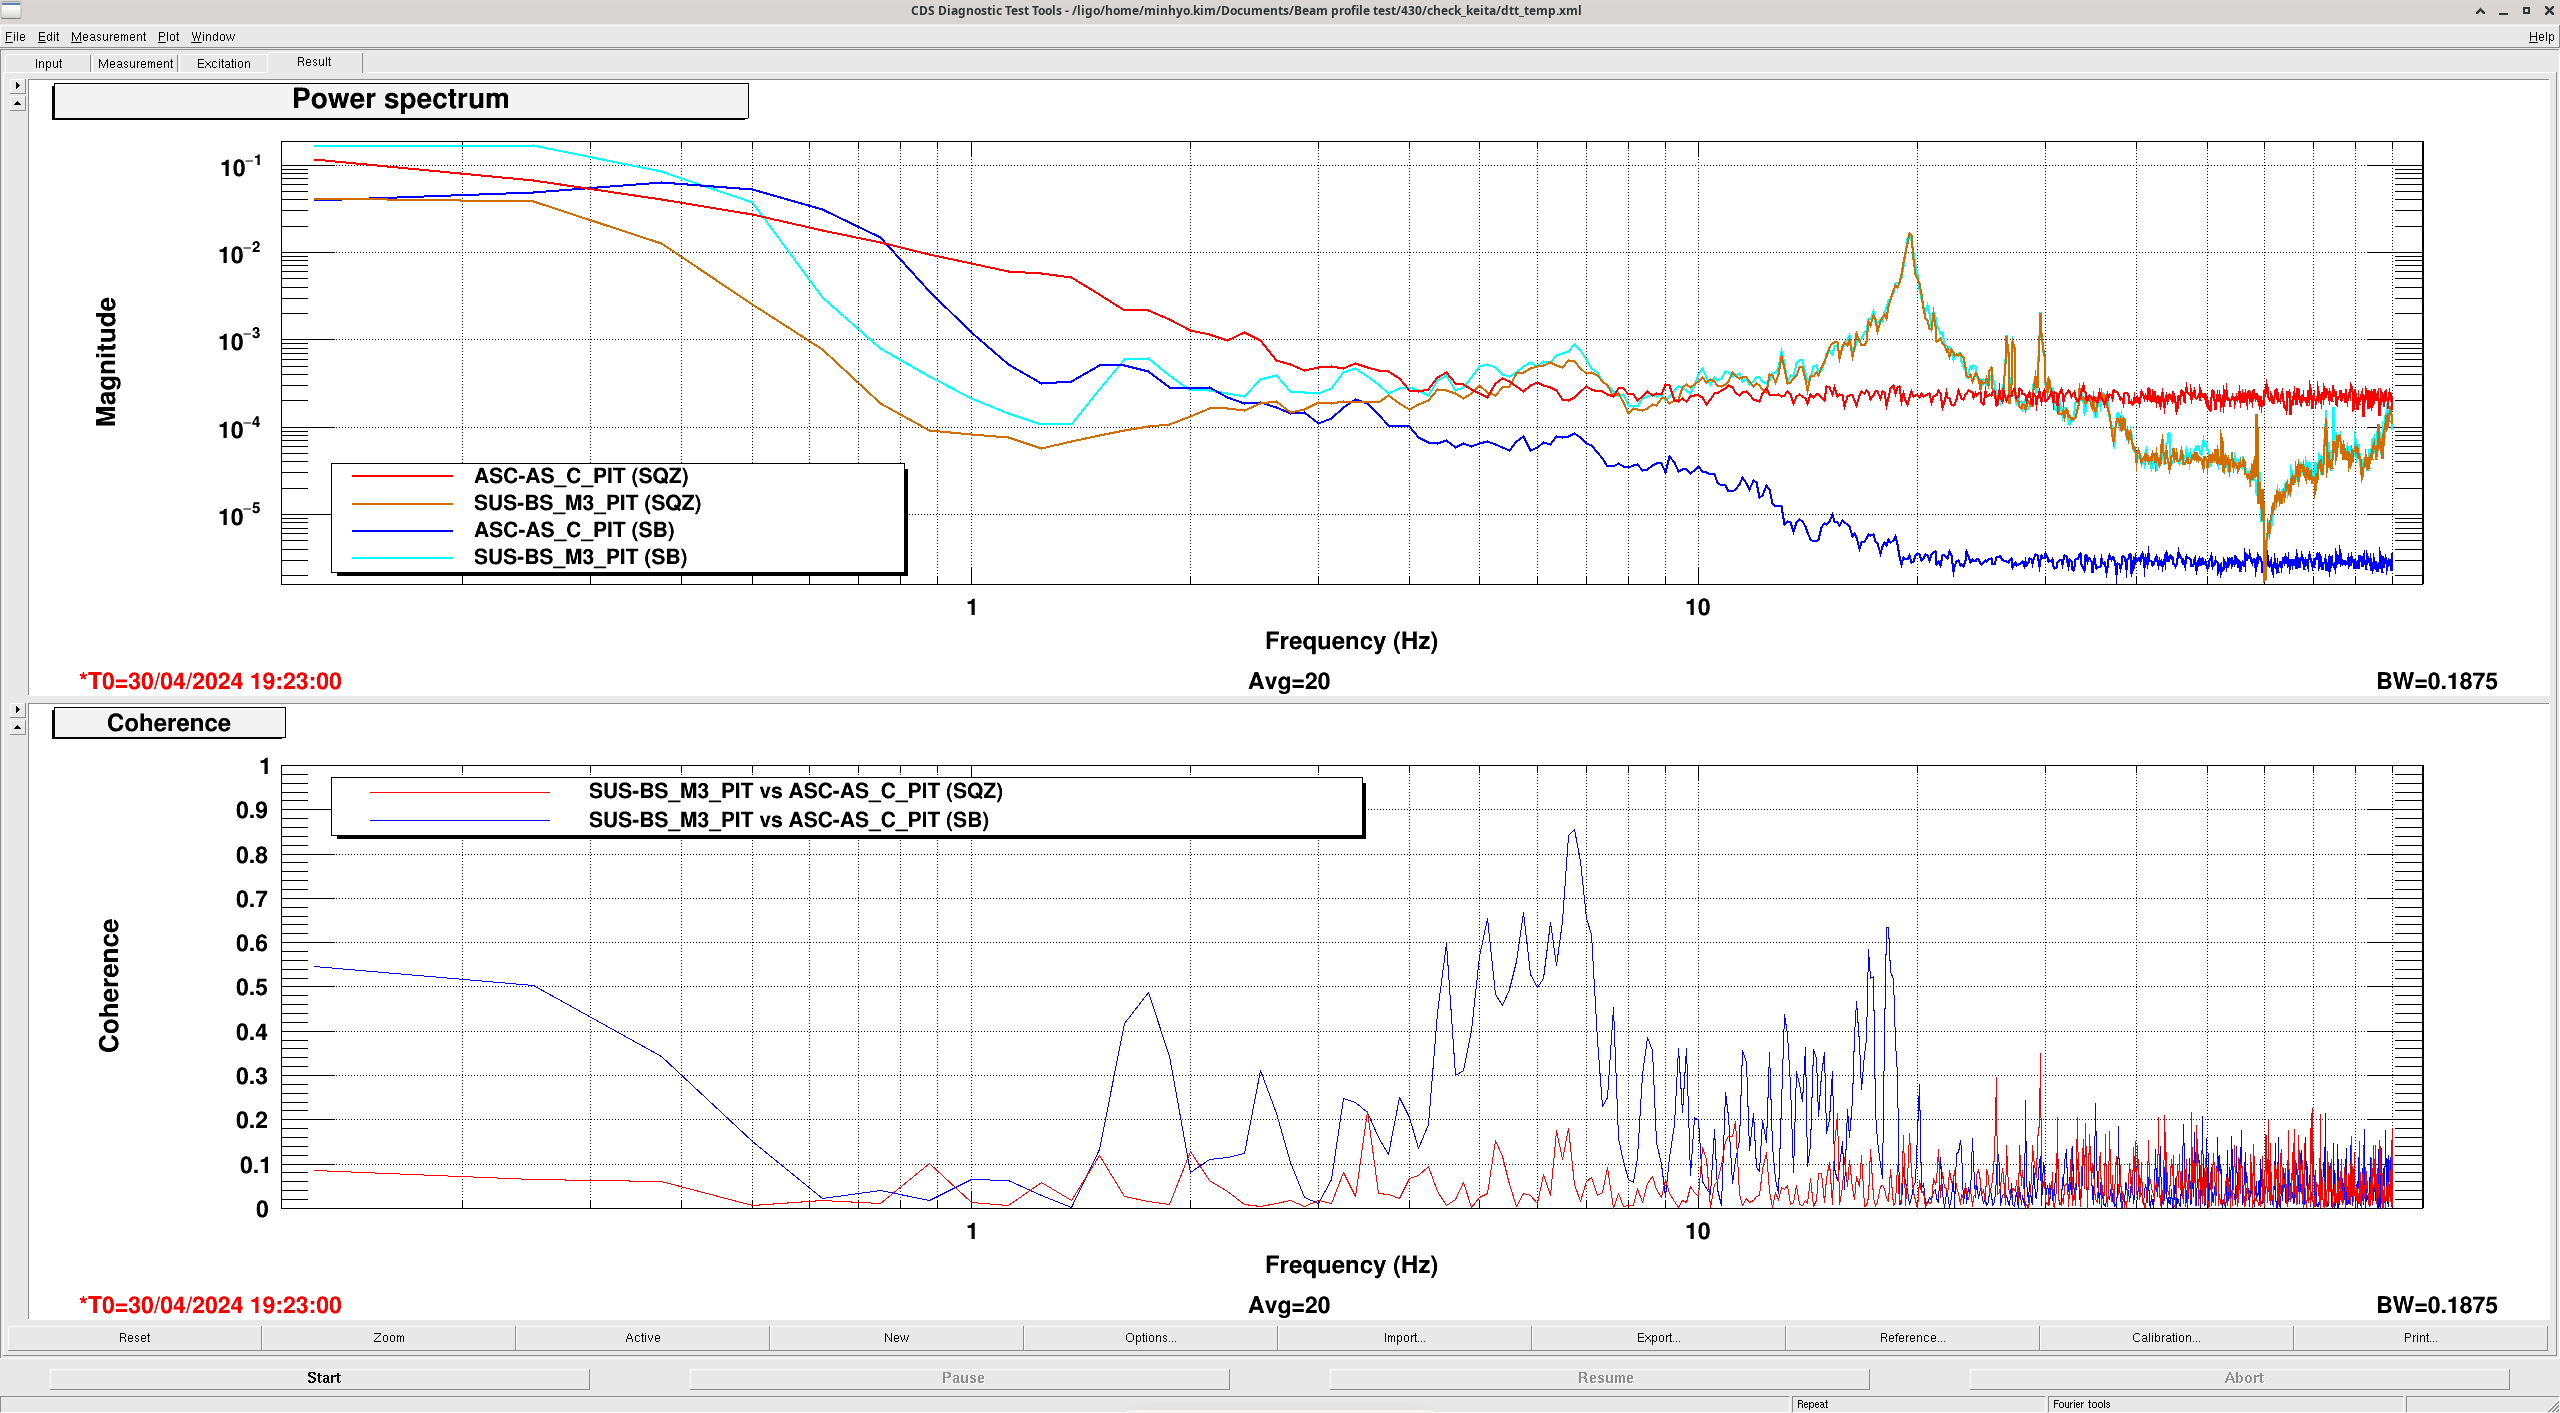
After checking with the power spectrum data of SUS-BS_OPLEV_PIT_OUT_DQ (3rd screenshot), we noticed that the noise is higher during the SB measurement under 10 Hz, which is also showing large coherence with ASC-AS_C_PIT. We still don't know the exact origin of this noise, but it have definitely affected the beam's PIT movement beyond BS.
Minhyo, Keita
(Accidently didn't write alog about this, so I'm posting this in the comment)
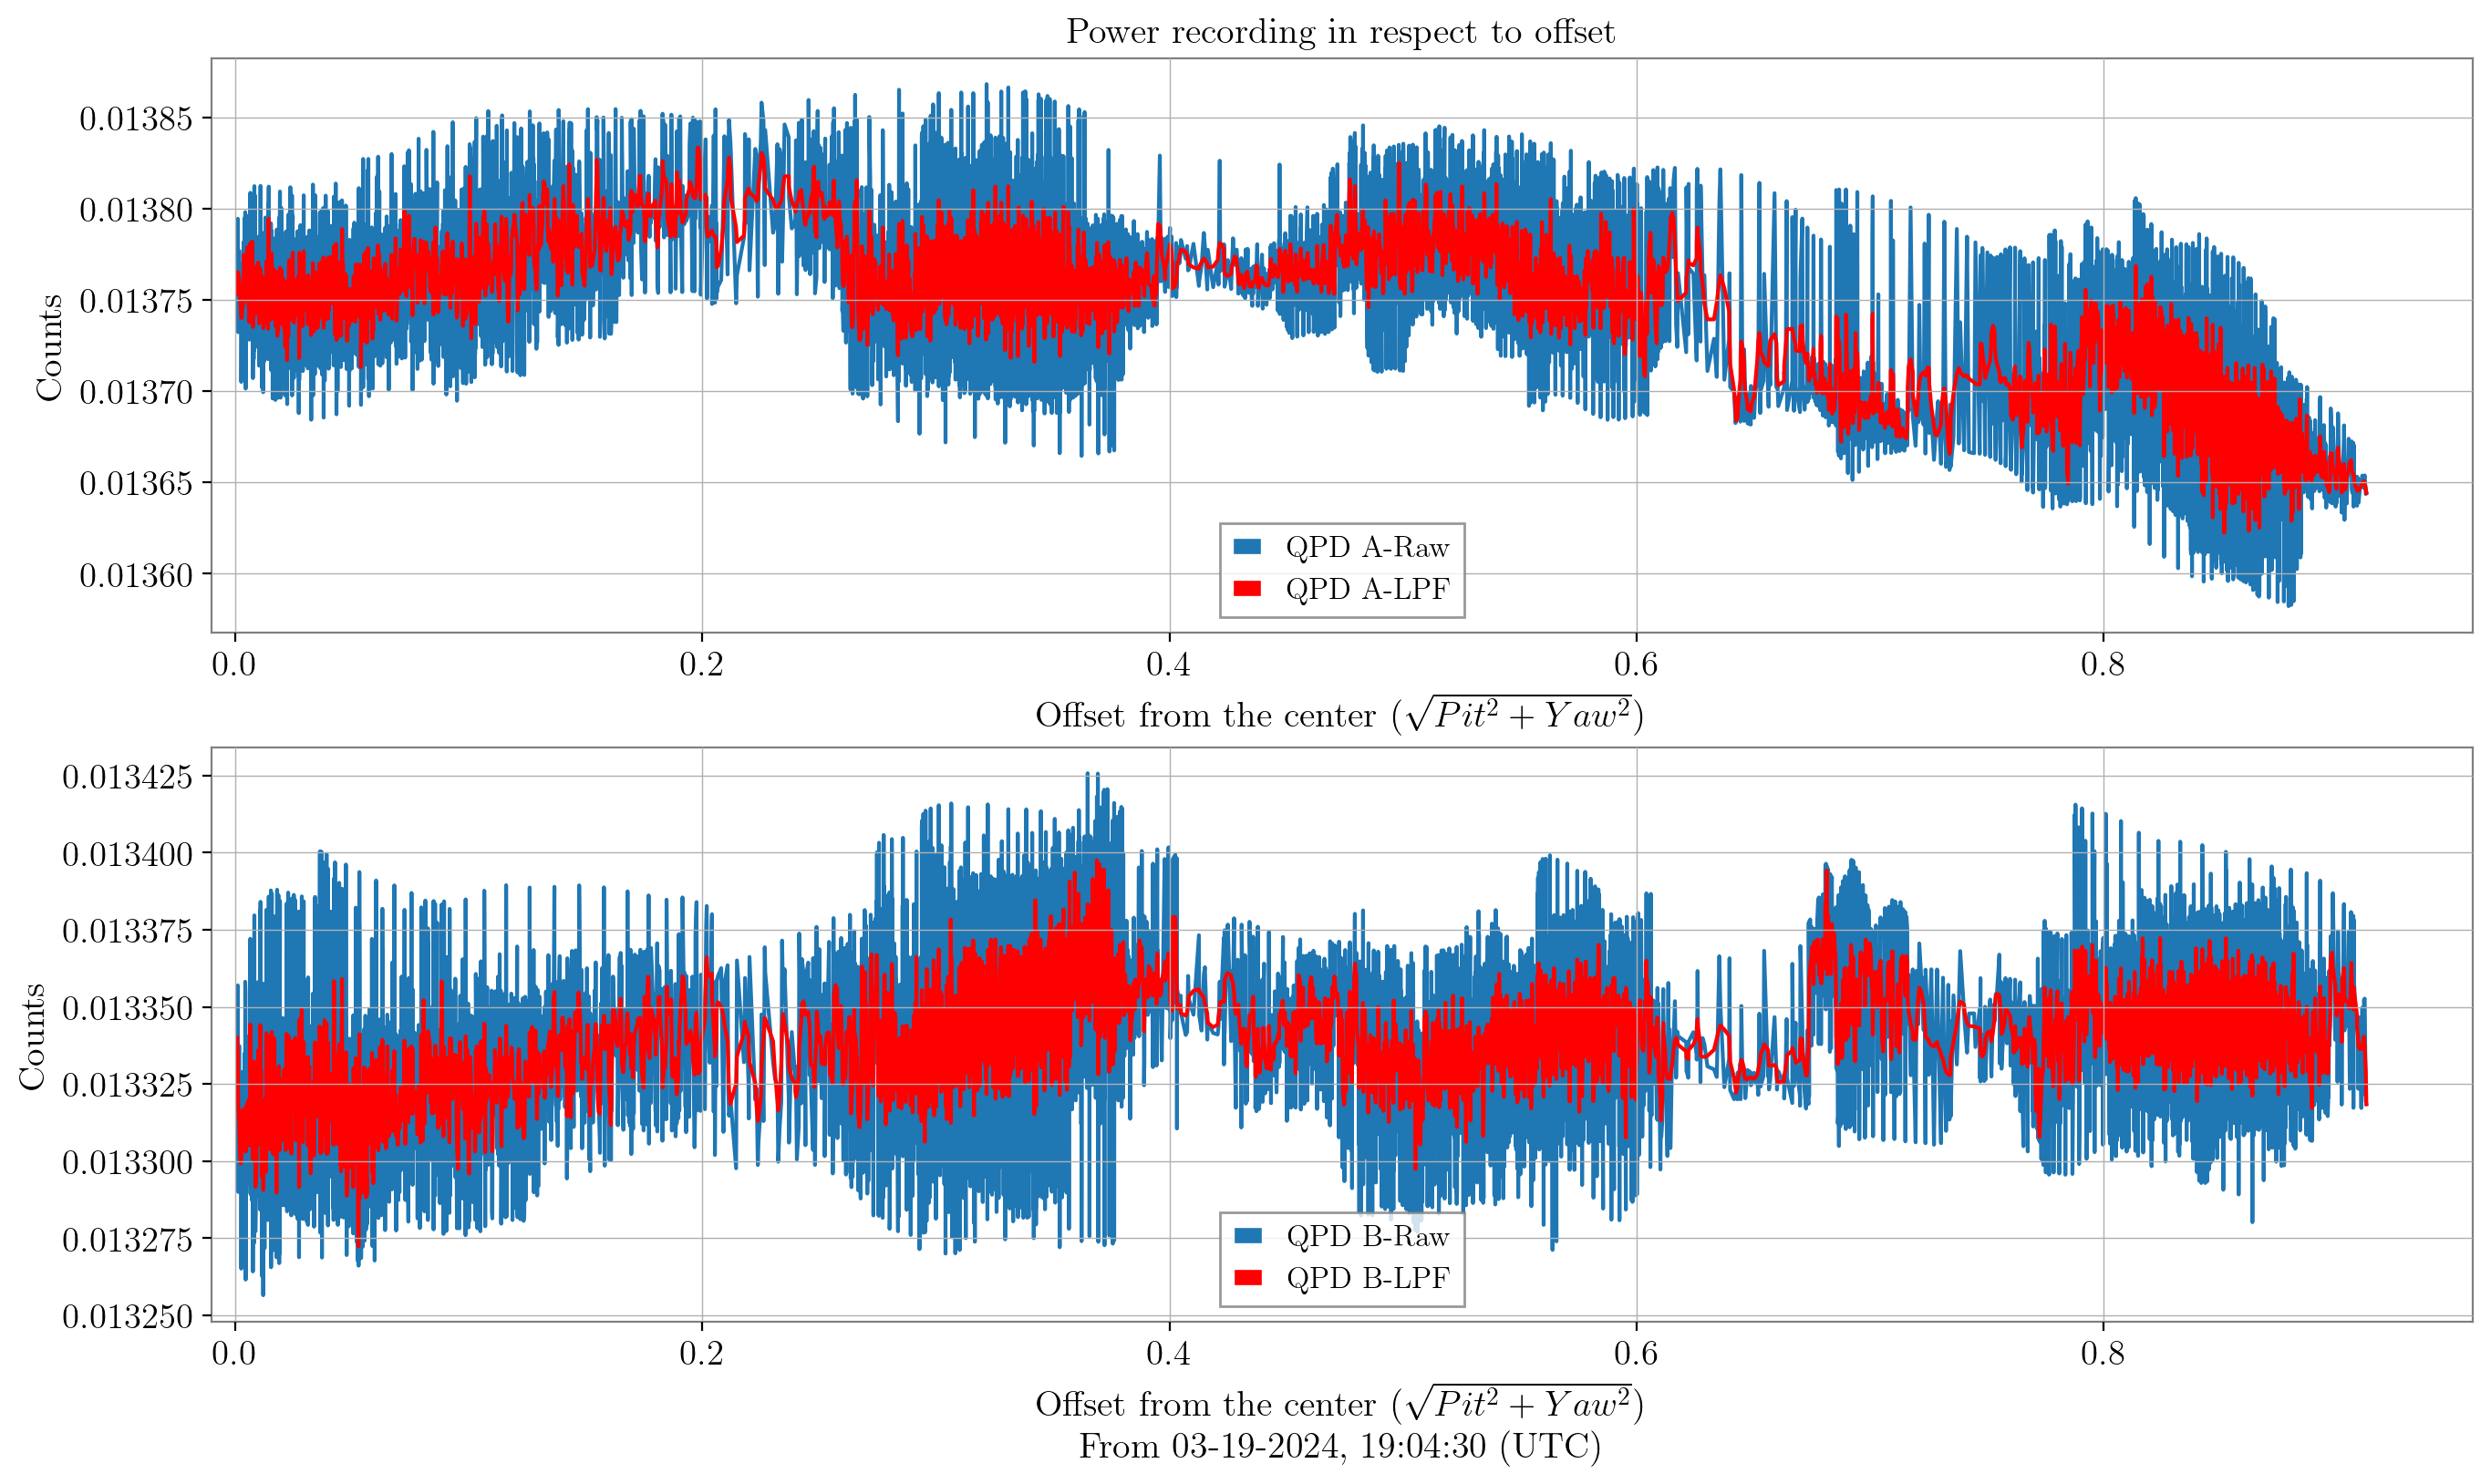
We tried to measure the beam diameter that falls onto OMC-QPD (T1000276). The theory is to use the center gap of QPD as a calibration source, measuring the QPD SUM output data can give the information about the beam radius, since the power loss will occur due to the center gap in the QPD. It is expected that the SUM output will be minimum at the center, and gradually increase in respect to the offset from the center of QPD.
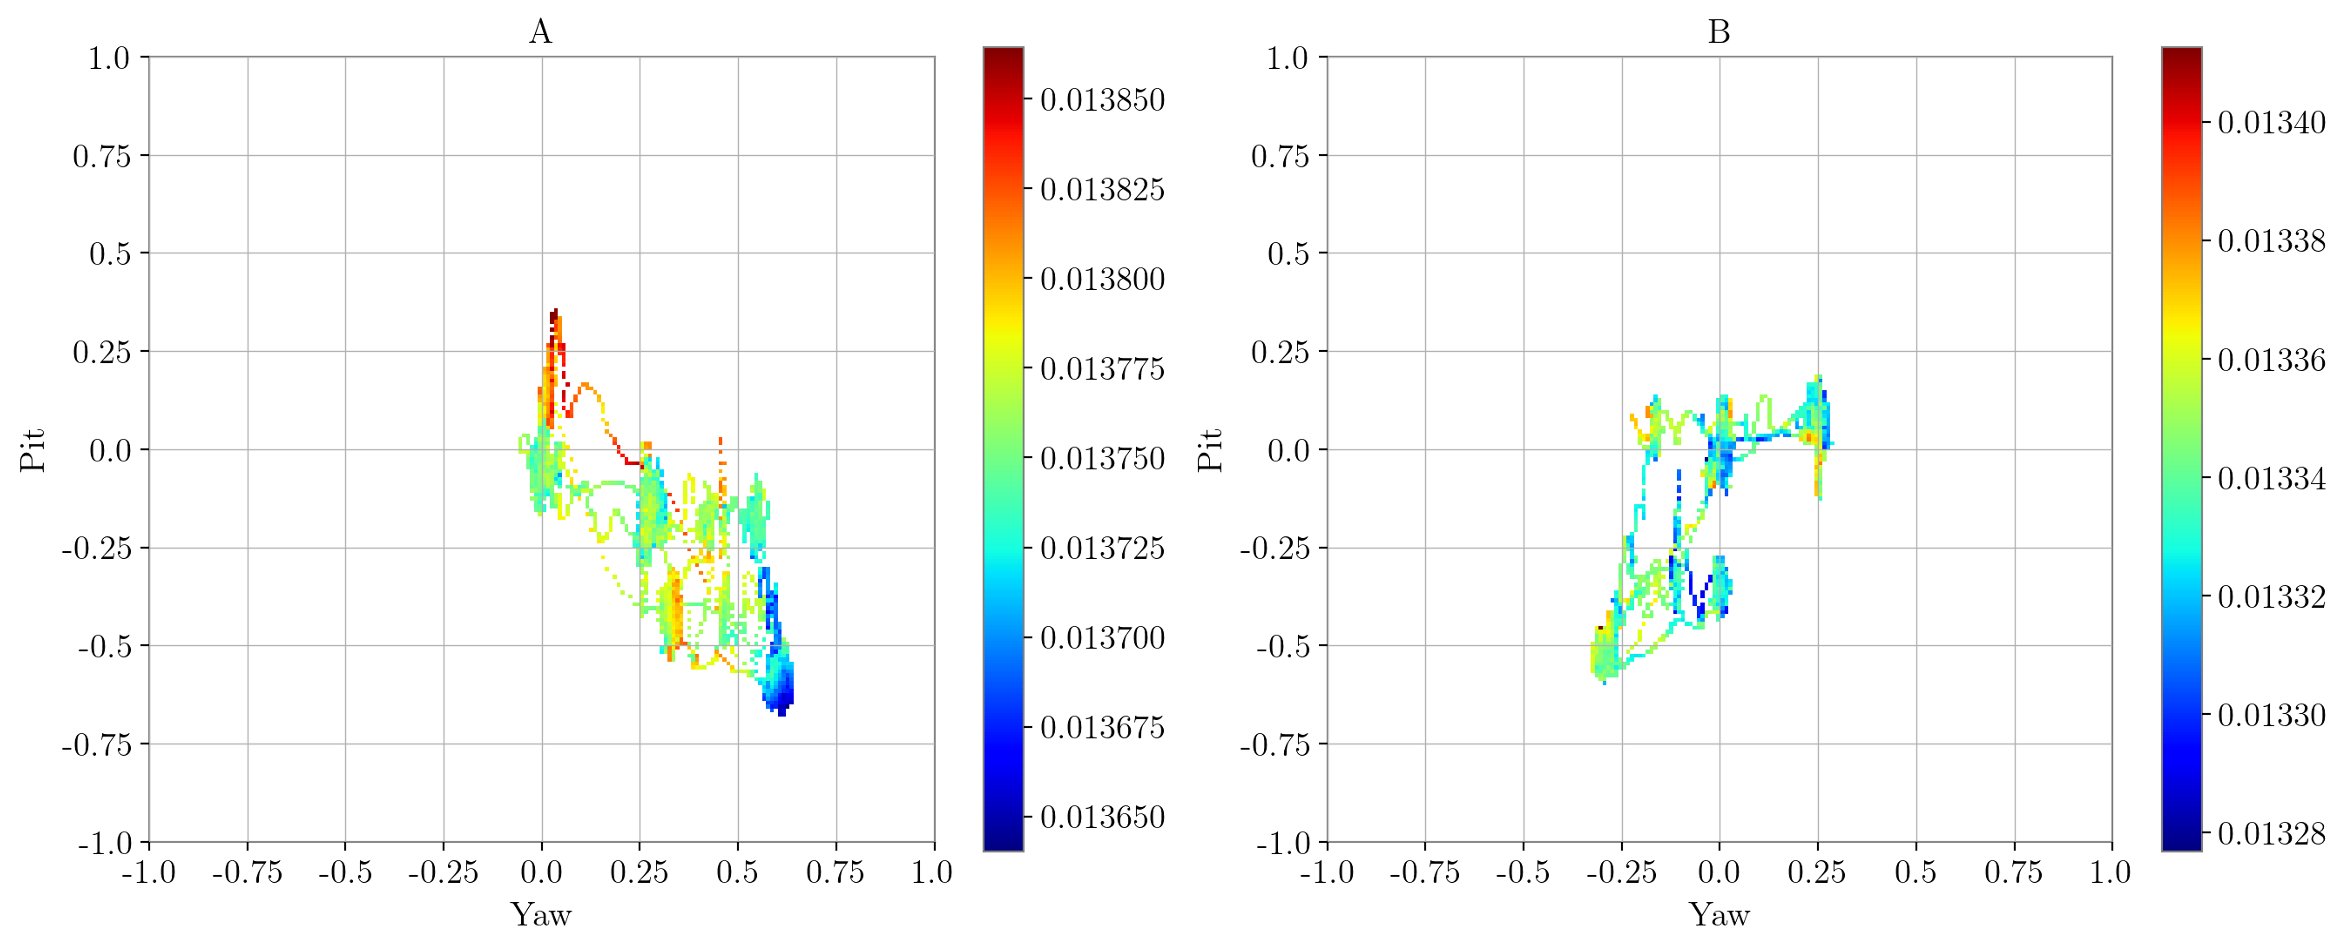
The measurement was done with single-bounce (SB) beam condition, during 2024-03-19, 18:30:00 ~ 19:30:00 (UTC). At first, we tried to center the beam by using SR2, AS_C centering loop and WFS centering. After that, tried to center the beam with using OMC servo with mastergain=0.1. The actual measurement time is in between 19:04:30 ~ 19:22:00 (UTC), and moved OM1 and OM2 manually, to move the beam off from the center (1st figure).
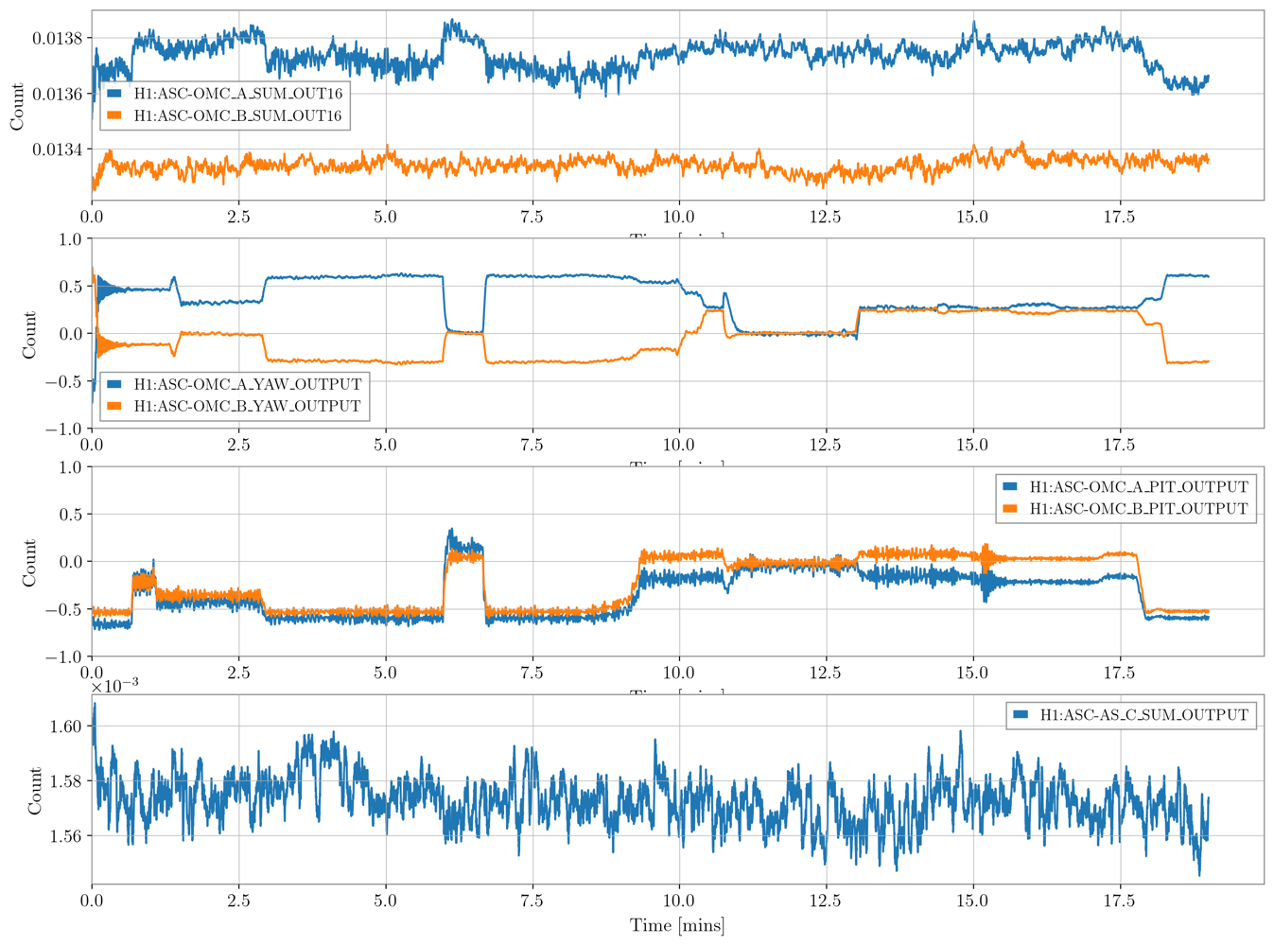
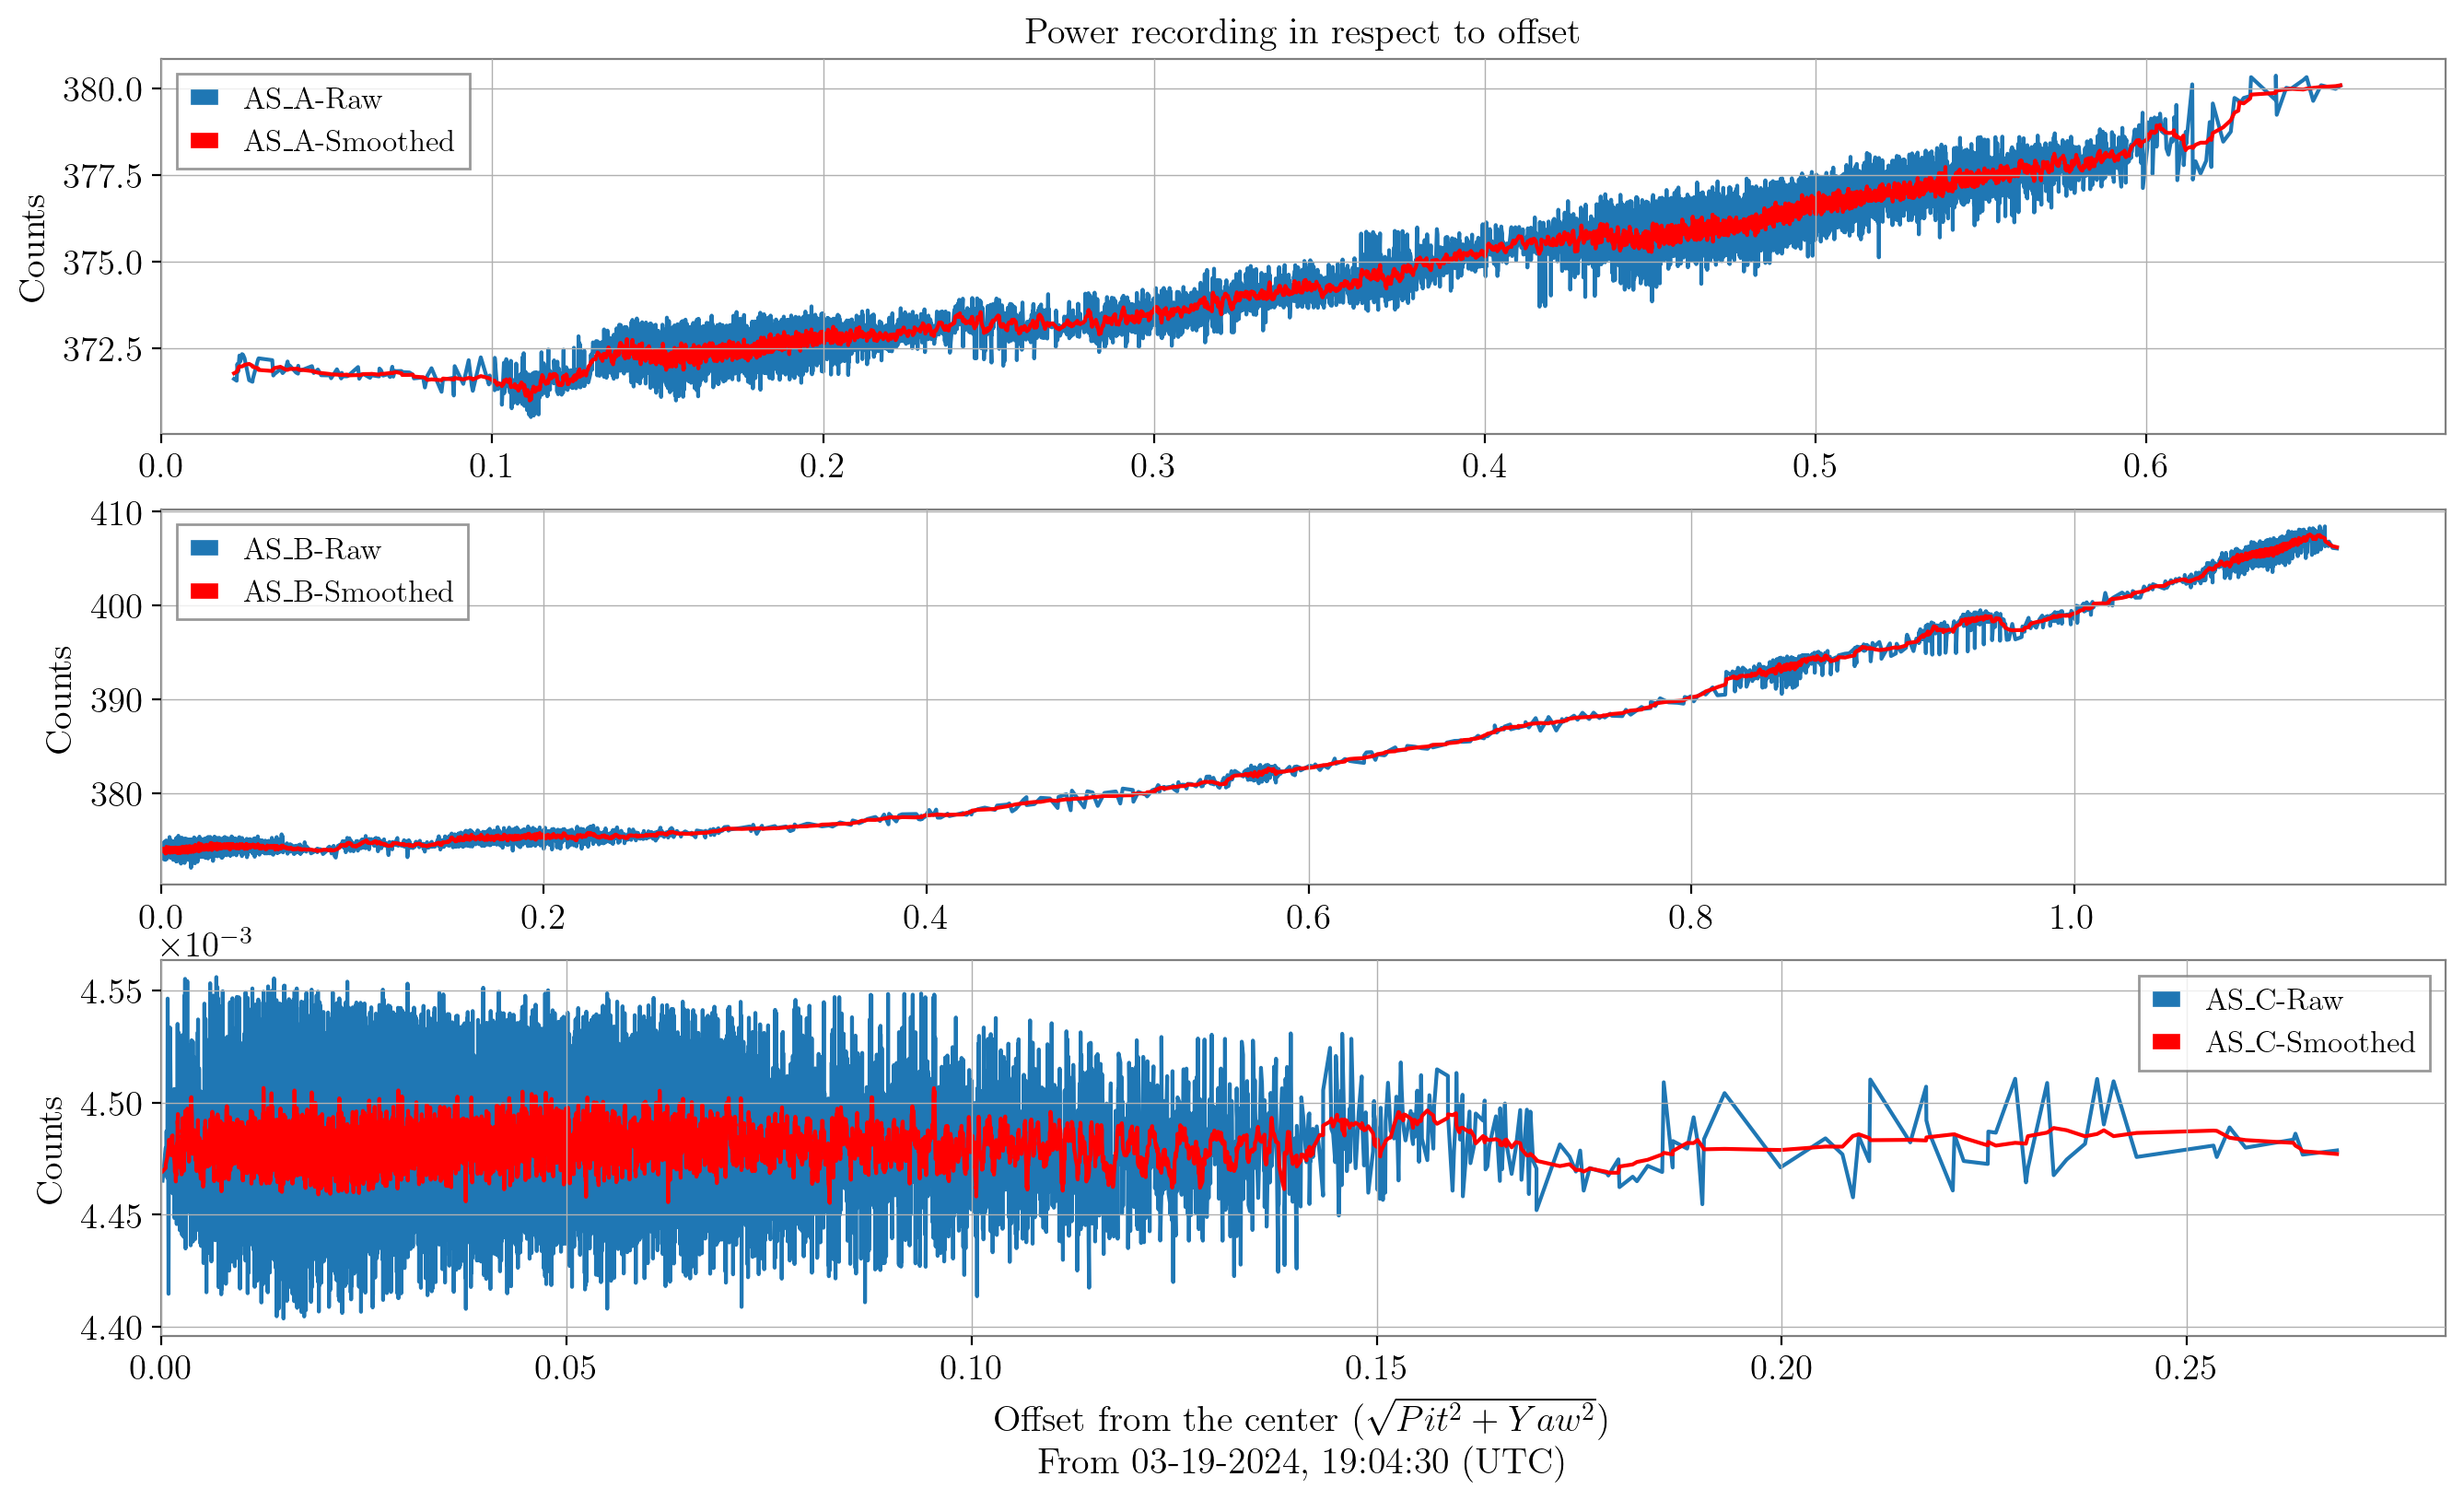
However, by checking on H1:ASC-OMC_A(B)_SUM_OUT16 channels, it didn't show the trend what we were expected. In almost all times, the power output showed consistent trend, and QPD A even showed highest value around the center of QPD (2nd, 3rd figure). Whereas, WFS sensor (AS_A and B) showed the expected increasing trend of power in respect to the offset from the center (4th figure), even though they are using same photo diode model.
From discussion, we suspect two origin for the descrepancy from the expected trend; 1) The center gap of QPD model (InGaAs-Q3000) is different from the cataloue (0.045 mm), 2) Quantum efficiency of QPD is not consistent in near the edge of each quadrant diode.
In conclusion, the quatitative measurement of beam profile of OMC using the center is limited due to the uncertainty of the QPD.
Attached figures are: 1) Visualization of the beam movement and power in each OMC-QPD, 2) Time series data of QPD channels, 3) OMC-QPD SUM_OUTPUT data in respect to the offset from the center, 4) WFS (AS_A and B), and AS_C OUTPUT data in respect to the offset from the center