jeffrey.kissel@LIGO.ORG - posted 12:37, Tuesday 18 June 2024 - last comment - 15:57, Thursday 20 June 2024(78516)
Investigating the High Frequeny Performance of the OMC DCPD Anti-aliasing System
J. Kissel
I'm on a slow-but-steady adventure to characterize the performance of the digital anti-aliasing system for the new 524 kHz ADC readout of the OMC DCPDs photocurrent.
The big picture goal is too look at the 524 kHz data, and make sure that it's filtered enough before down sampling to 65 kHz and then 16 kHz, such that none of "fun and interesting" features that are real DARM signals (or analog or digital artifacts of the ADC) in the 10 - 100 kHz region appear down-converted at low frequency.
As usual, when I *look* at something for the first time, hoping for a simple "yup, works as expected," I instead get 60 new questions.
Executive summary:
While I don't see anything obviously detrimental to the 16 kHz data, I see a confusing, frequency-independent noise floor in the filtered version of the 524 kHz OMC DCPD A channel *only* in NOMINAL LOW NOISE that I can't explain as either ADC noise, spectral leakage, or limits of numerical precision. Apparently, in NOMINAL LOW NOISE, we're not getting nearly as much digital anti-aliasing as designed.
Plots and their Explanation, Exploration, and Conclusions:
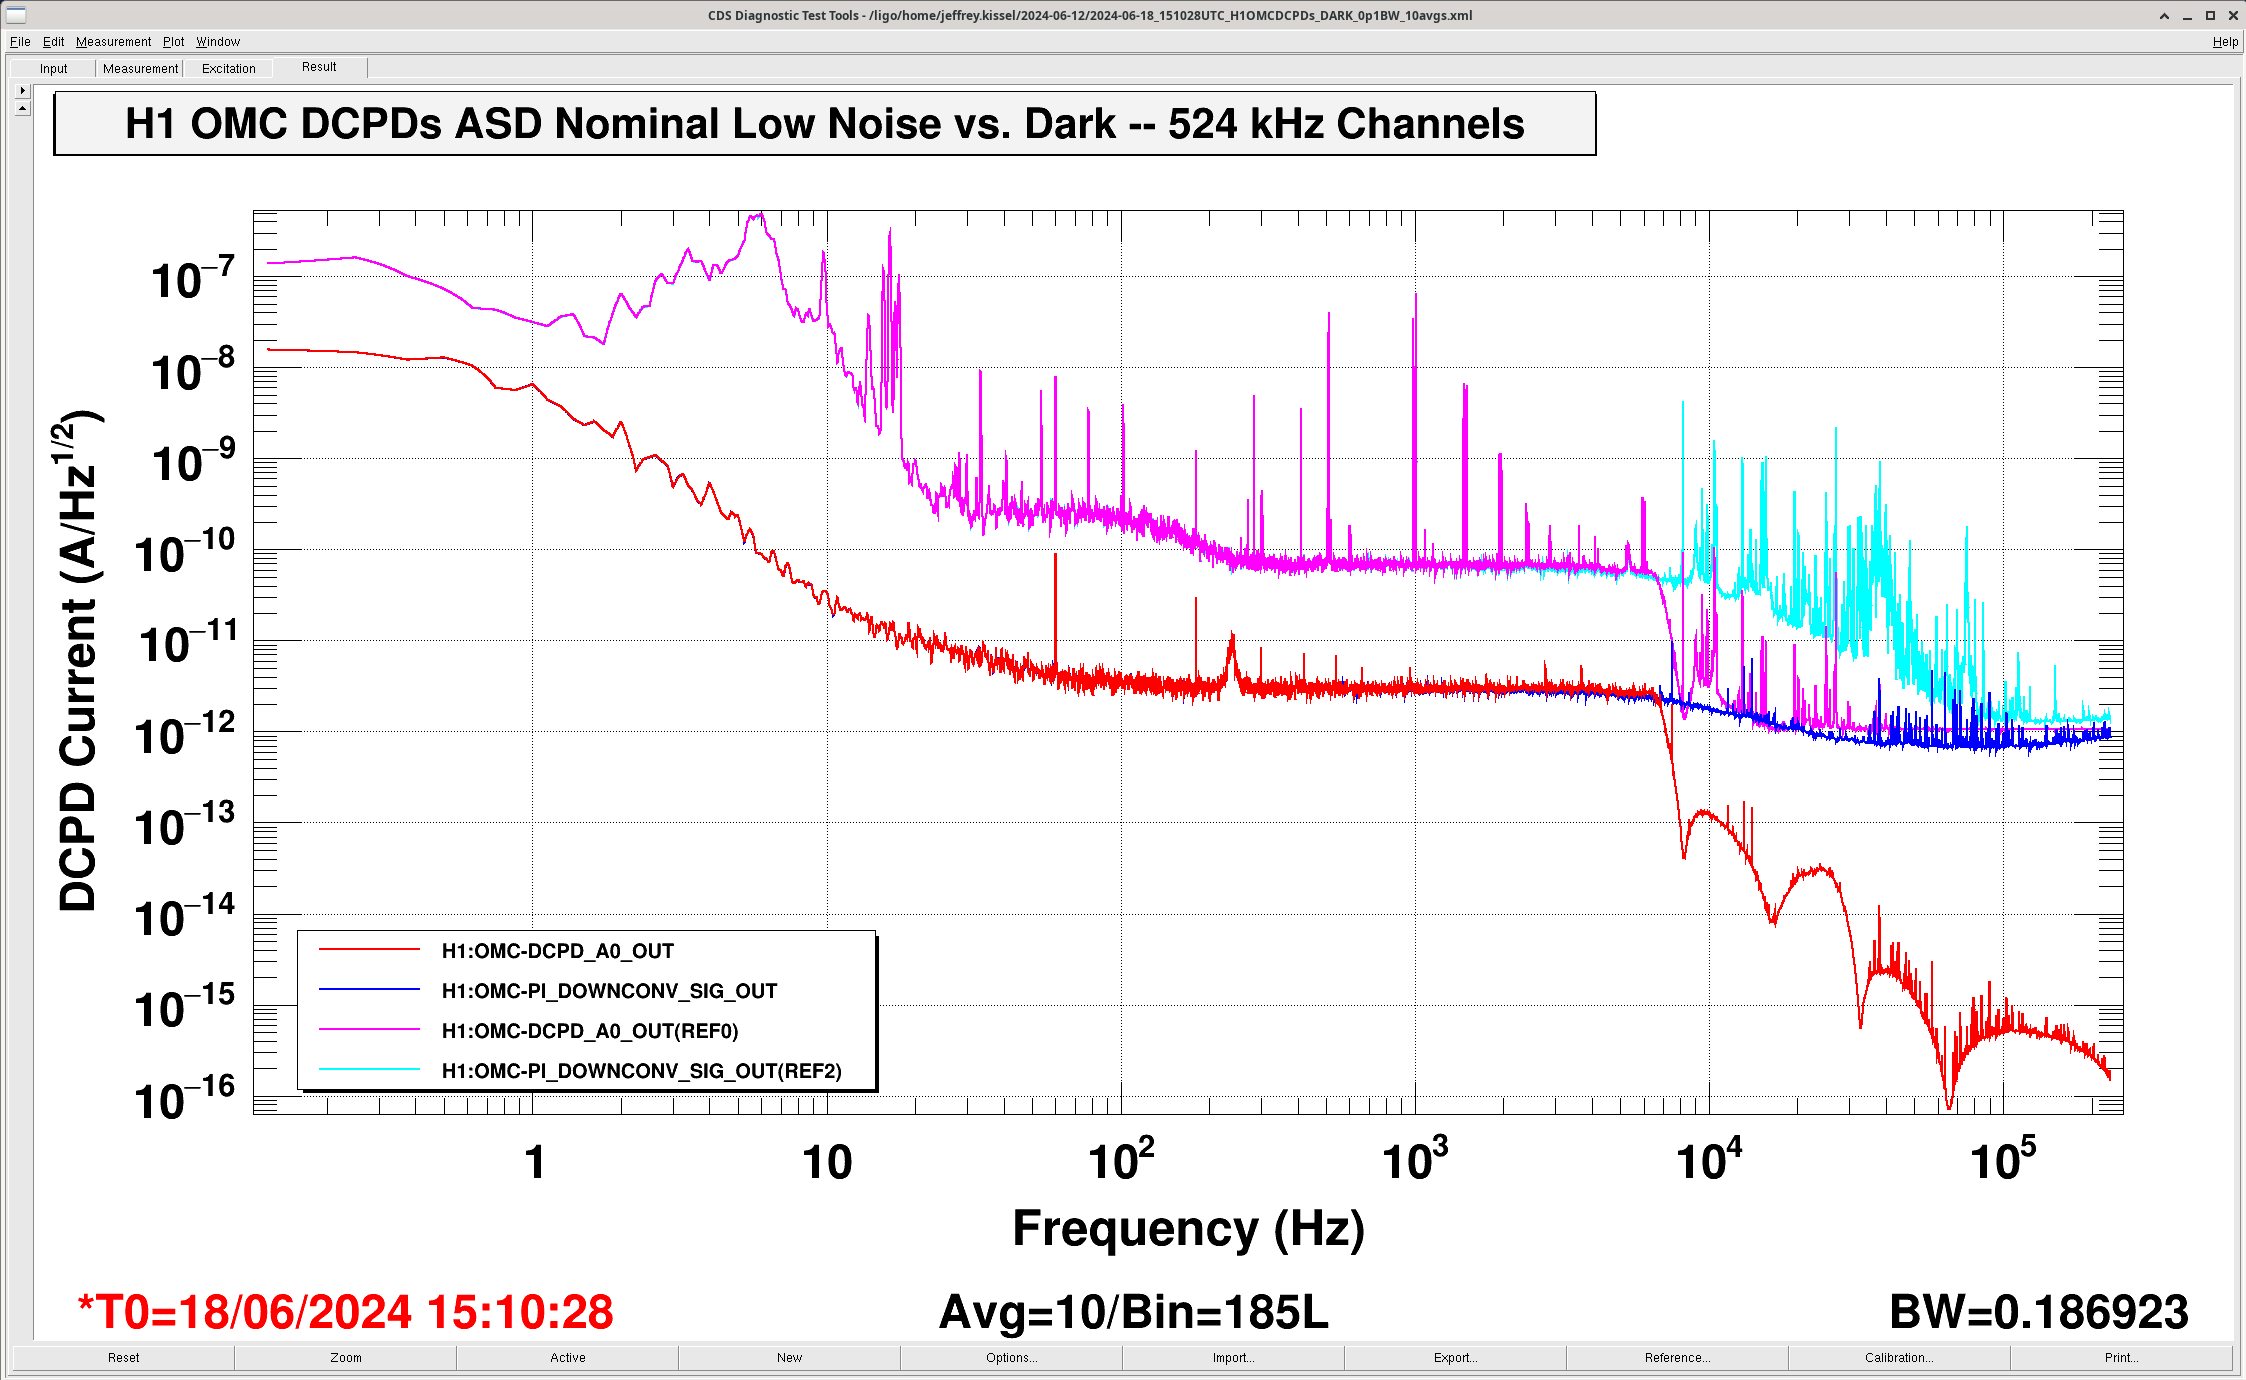
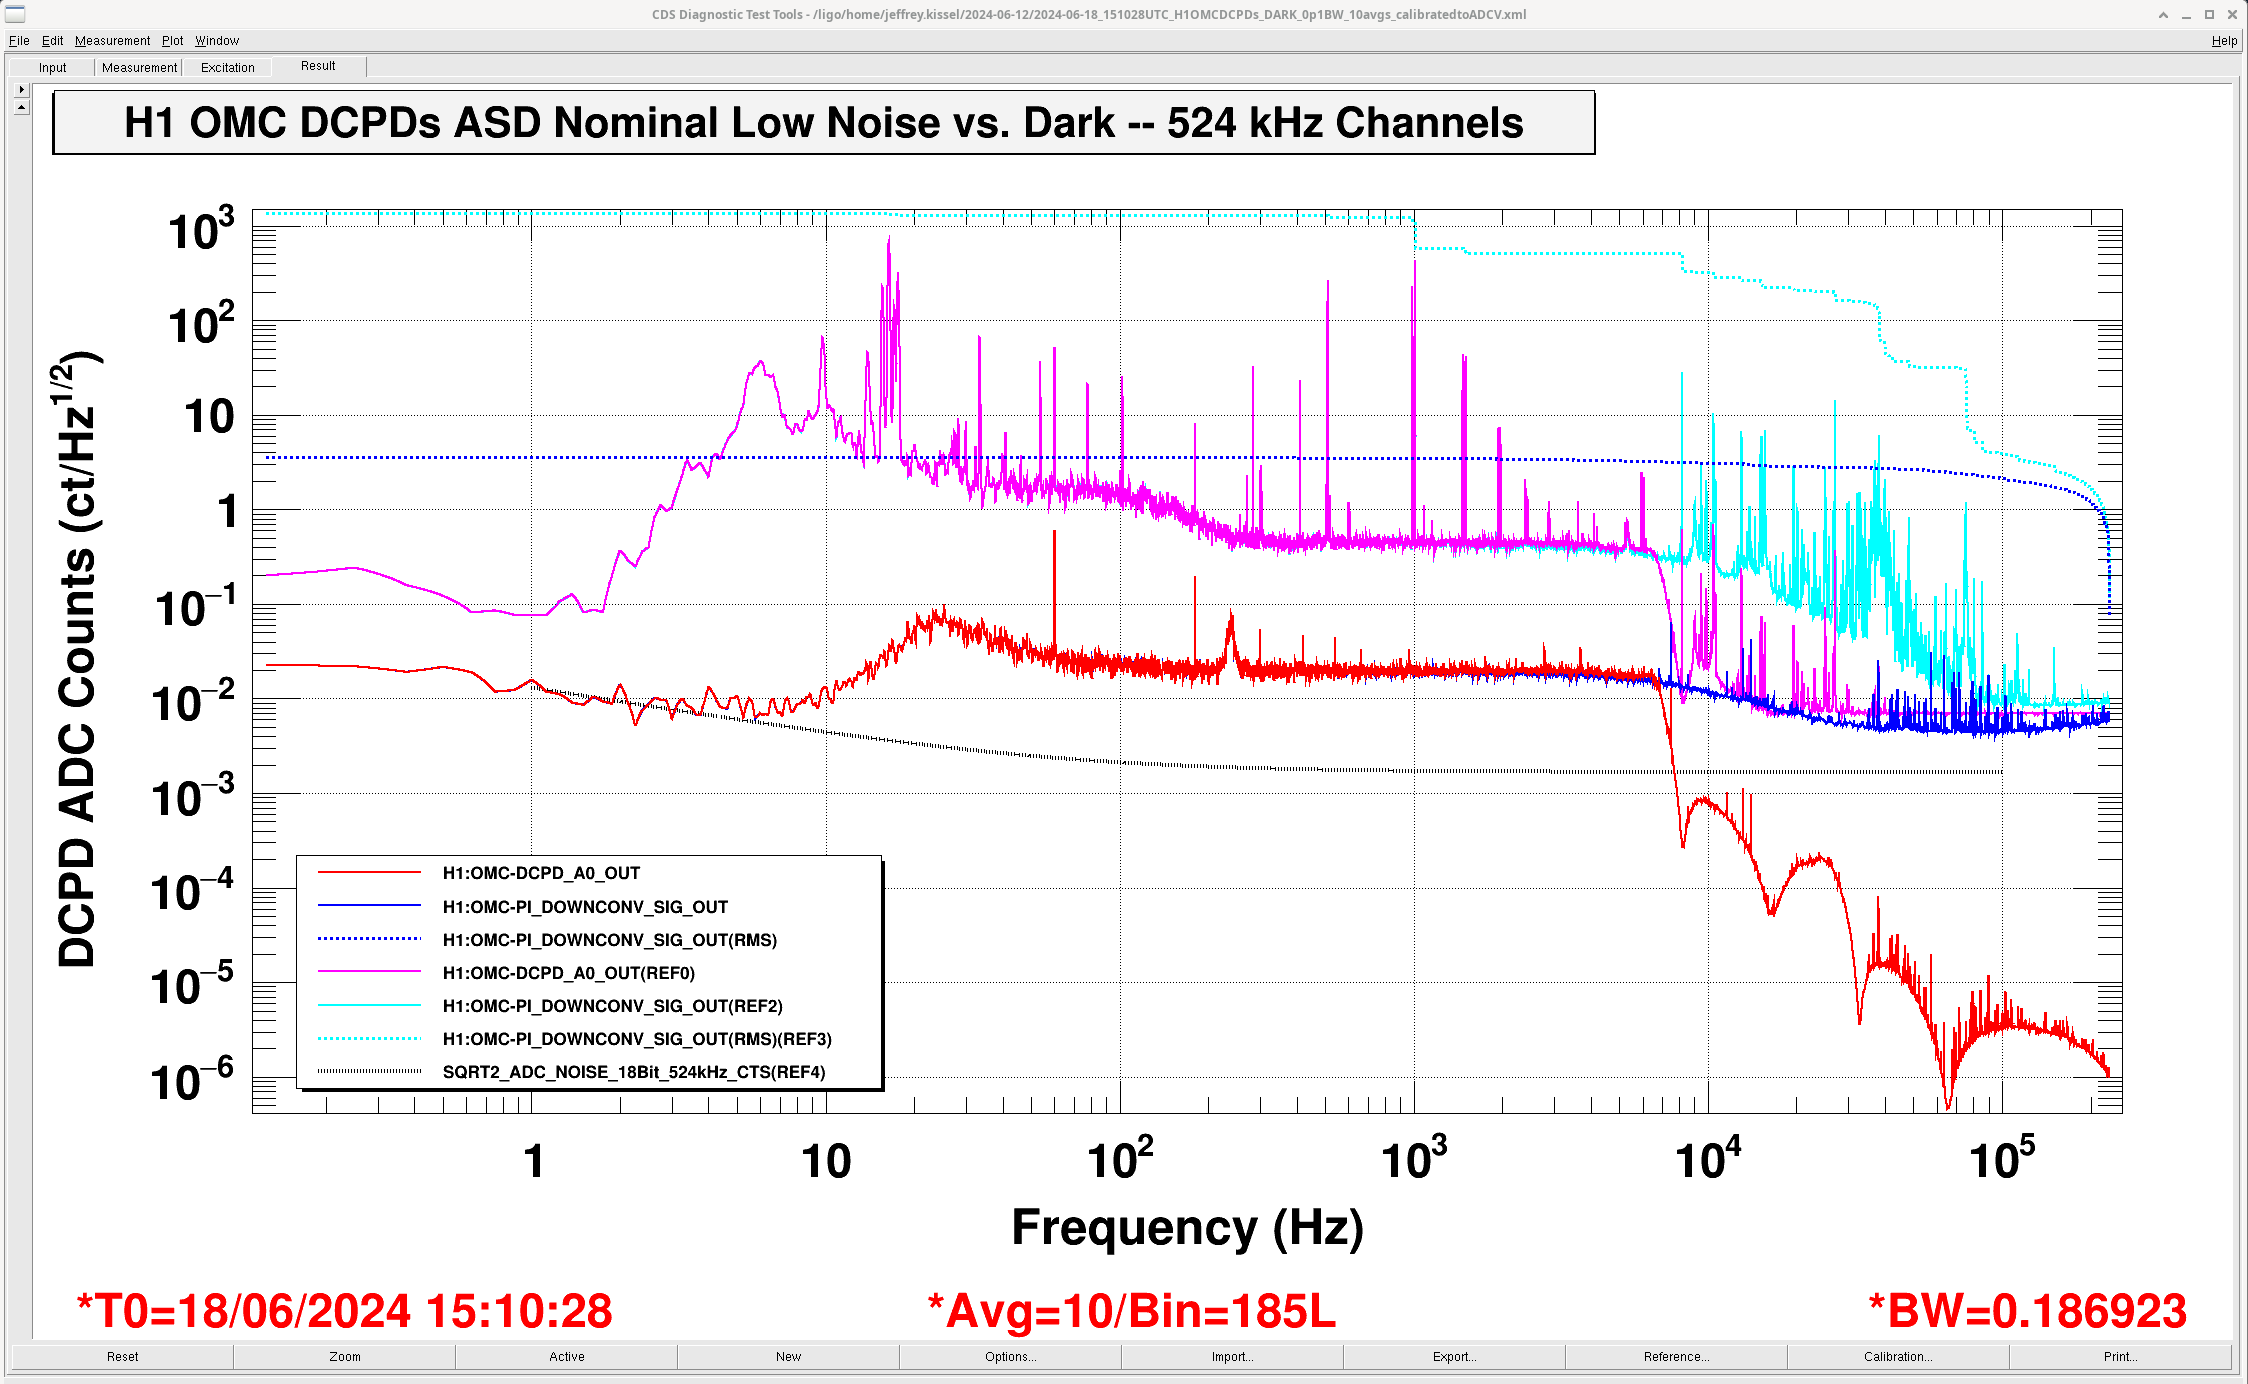
First, I compare the amplitude spectral densities of the two 524 kHz channels available for DCPD A during NOMINAL LOW NOISE vs. when DARK (the IMC OFFLINE), "as the are"
- H1:OMC-DCPD_A0_OUT (calibrated into milliamps [mA] on the DCPDs), # HAS 526-to-65 kHz and 65-to-16 kHz digital AA filters
- H1:OMC-PI_DOWNCONV_SIG_OUT (a copy of the DCPD A channel, also calibrated into [mA]), # DOES NOT HAVE digital AA filters
The first attachment, H1OMCDCPDs_0p1HzBW_10avgs_524kHzSignals_NLN_vs_DARK_AprtHz.png shows this comparison.
These are the *output* of the respective filter banks, so the front-end filter banks already do *most* the work of inverting the frequency response of the TIA and Whitening filters, below 10 kHz.
That front-end calibration also already accounts for the fact that the analog voltage coming into the ADC is copied 4 times and summed, and does the "divide by four" gain of 0.25 to create an average of the voltage copies.
Importantly, the TIA and whitening's analog 11130 & 10170 and 44818.4 Hz poles are *not* inverted, so they remain a part of the frequency response of the readout -- and thus they remain uncompensated for in the plot.
The *only* calibration applied in DTT for these channels is a simple 1e-3 [A/mA].
NOMINAL LOW NOISE, "reference" data for the two channels -- shown in CYAN and MAGENTA -- was taken a last week on 2024-06-12 20:45:46 UTC.
DARK noise, "live" data for the two channels -- shown in RED and BLUE -- was taken this morning, with the IMC offline at 2024-06-18 15:10:28 UTC.
One immediately notices several "interesting" things:
(1) The CYAN, OMC-PI_DOWNCONV_SIG_OUT version of the (4x copy average of the) DCPD A signal -- that doesn't have digital anti-aliasing filters applied -- shows lots of "fun and interesting" features on the DCPDs above 8 kHz in NOMINAL LOW NOISE.
(2) Comparing the CYAN NOMINAL LOW NOISE data with BLUE DARK data, we see that a lot of these "fun and interesting" features in the 8 kHz to 100 kHz region are real features from the detector. My guess is that this is the forest of acoustic modes of optics that appear in the DARM signal.
(3) MAGENTA OMC-DCPD_A0_OUT version shows that most of these features *are* filtered out by 30 kHz by the digital AA filtering, BUT -- they hit some frequency-independent noise floor at "1e-12 [A/rtHz]." This noise floor is obviously *not* a real noise floor on the DARM light coming in on the PDs, nor some sort of current noise, given how feature full the CYAN unfiltered version is. As such I will for the remainder of the aLOG put the quantitative numbers about this noise floor in quotes. What is this noise floor?
(4) Comparing MAGENTA NLN trace and RED DARK trace, we see that when the DCPD is DARK, we see the full expected frequency response of the digital AA filters. Why are the filtered data's DARK and NLN noise floors so different?
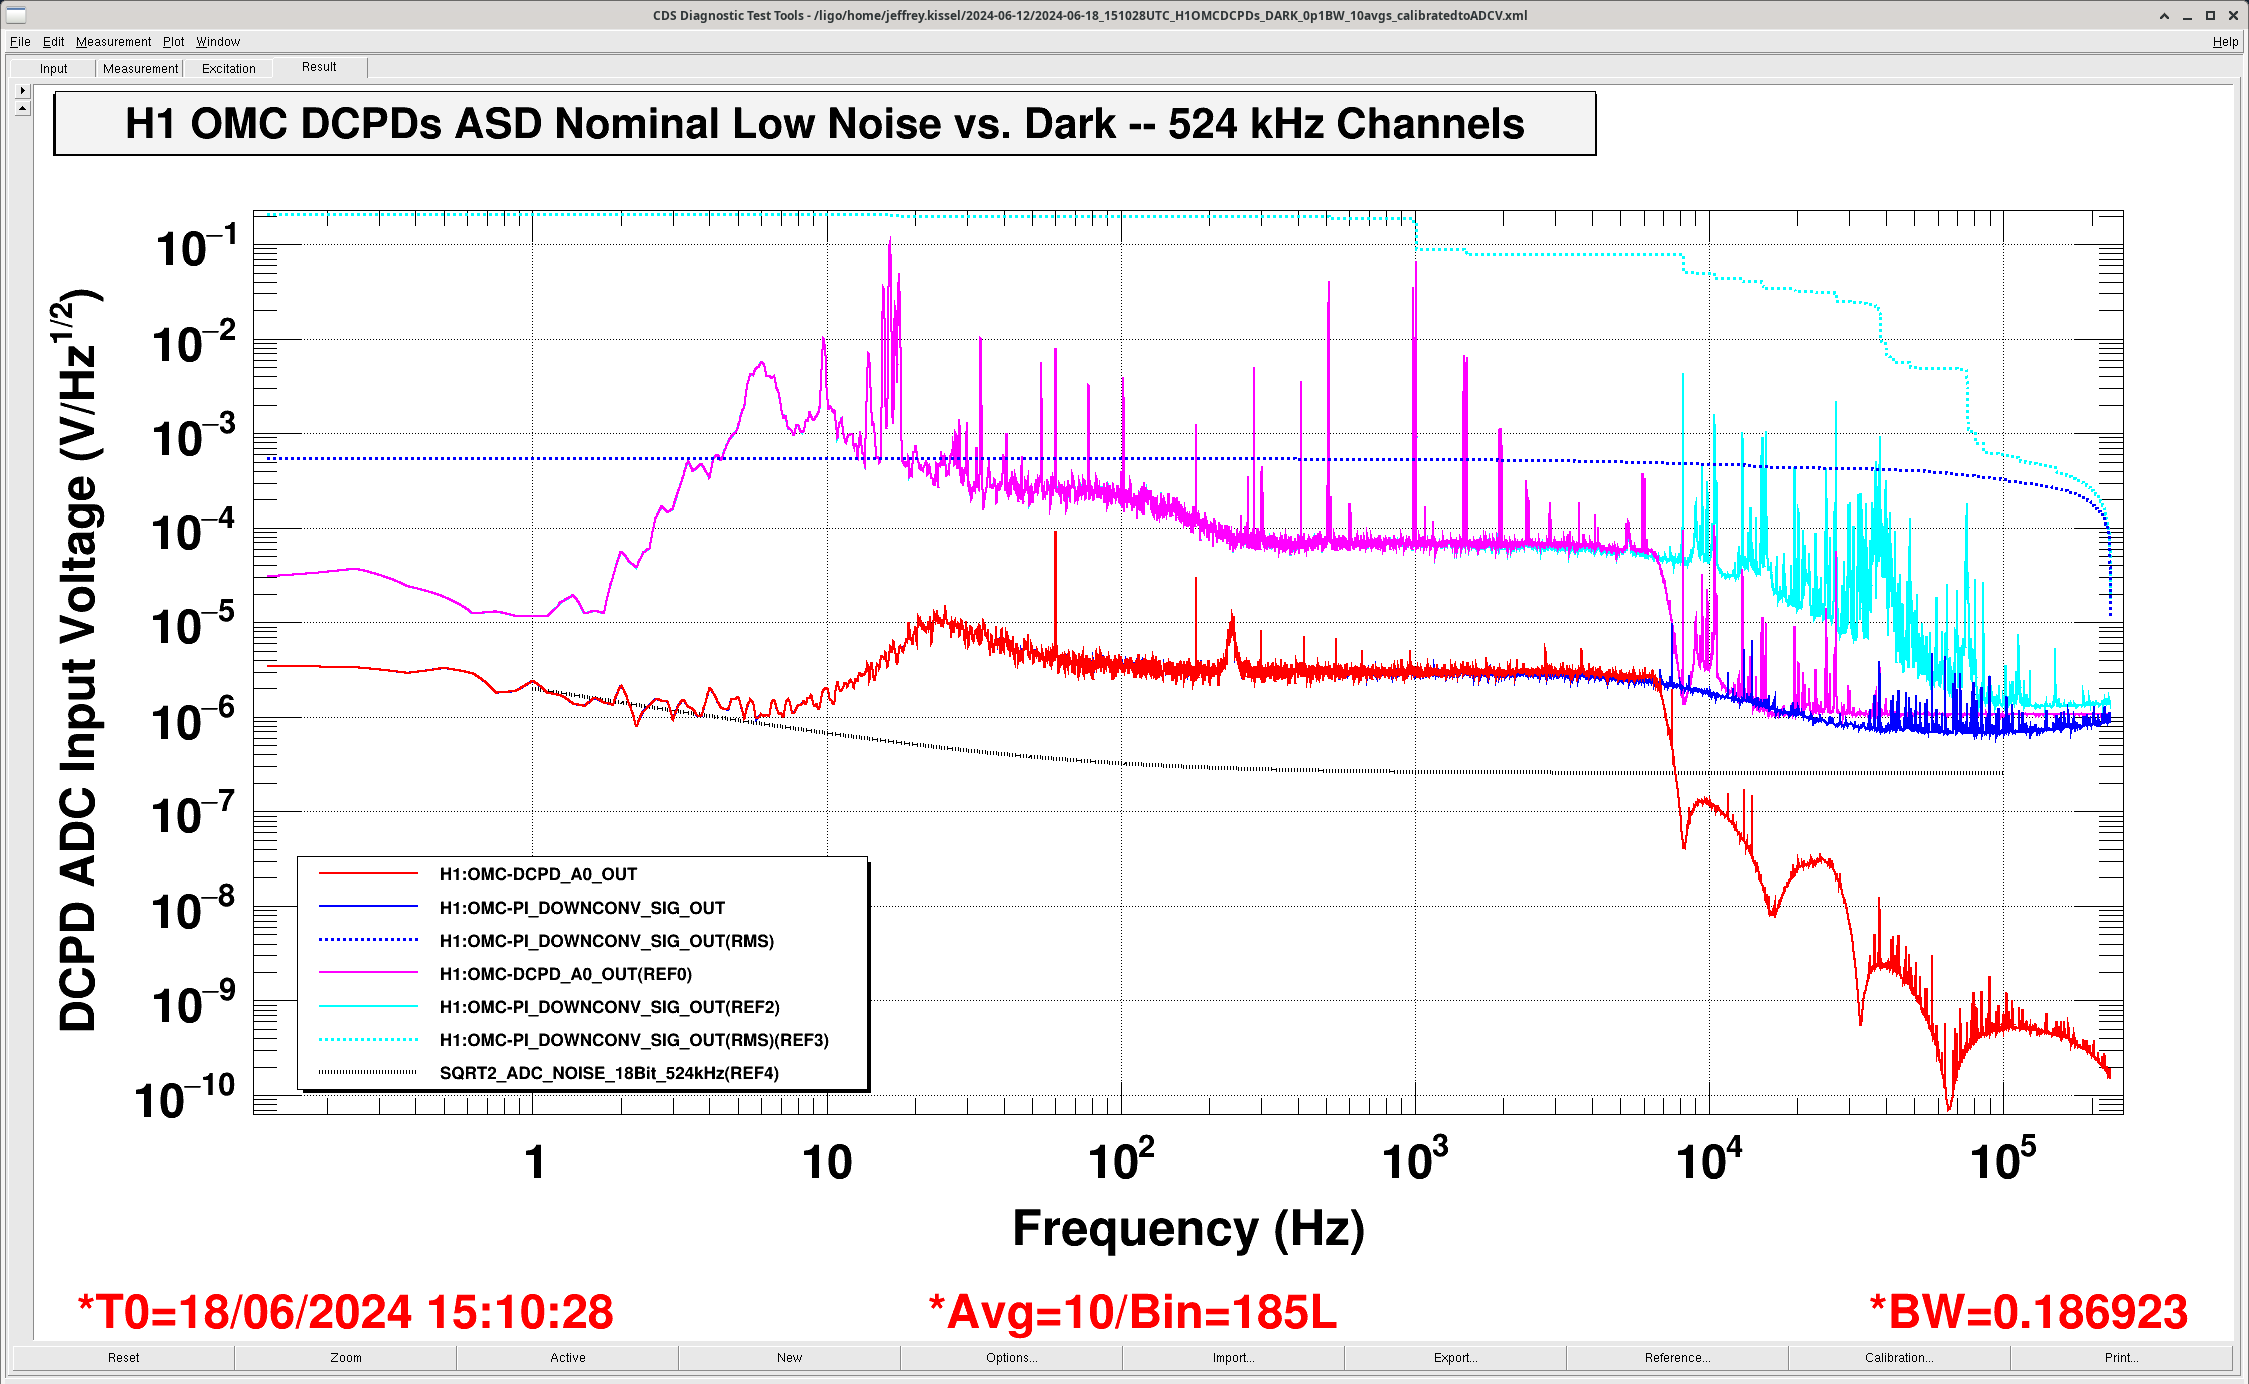
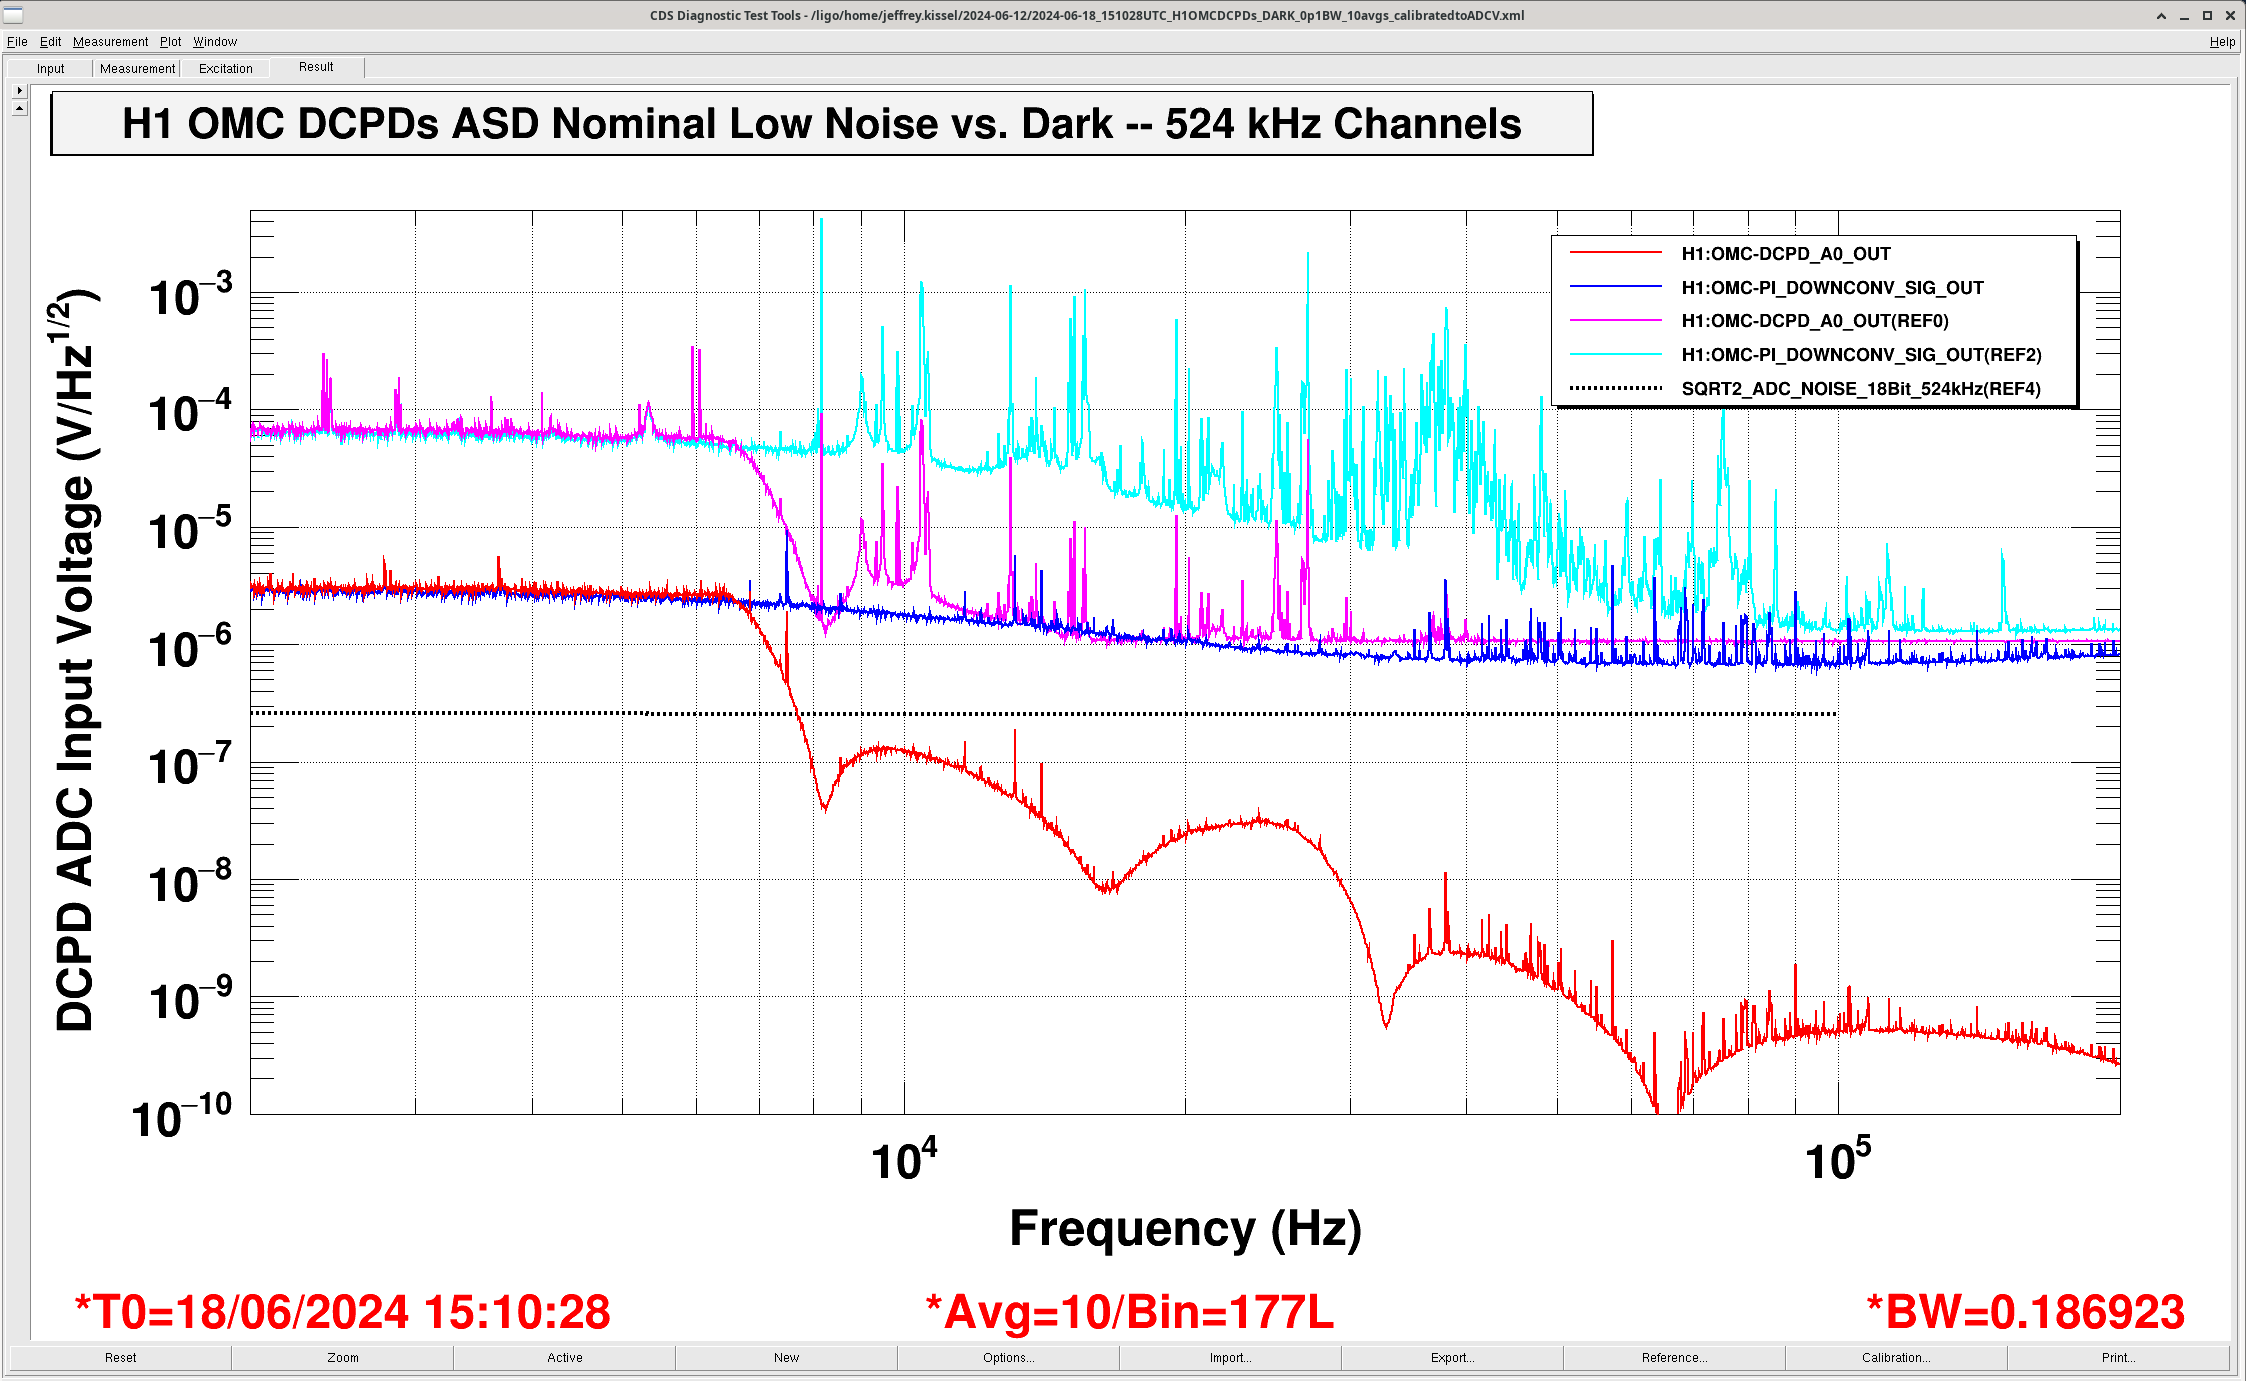
Hoping to understand this noise floor better, I calibrated the traces into different units -- the units of input voltage in to the low-noise, 18 bit, 524 kHz ADC.
The second attachment, H1OMCDCPDs_0p1HzBW_10avgs_524kHzSignals_NLN_vs_DARK_CastAsADCInput_VprtHz.png, shows this different version of the ASD.
To calibrate into ADC input voltage units, I calibrated all the DTT traces by the following calibration (with detailed poles and zeros pulled from the calibration group's DARM loop model parameter file, pydarm_H1.ini from the 20240601T183705Z report):
zpk([2.613;2.195;6.556],[5.766+i*22.222;5.766-i*22.222;32.77;11130;10170],219.65,"n") # The TIA response [V/A], normalized to have a gain of 100e3 [V/A] at 1 kHz
* zpk([0.996556],[9.90213;44818.4],1,"n") # The Whitening Response [V/V]
* gain(0.001) # The inverse of the [mA]
where notably, I continue to exclude the two 11130, 10170 Hz poles and the 44818 Hz pole from the TIA and whitening filter's analog response.
To compare against our model of the noise of the low-noise, 18-bit ADC sampled at 524 kHz (derived from the data in LHO:61913, shown to be comparable in G2201909), I took that model and divided by sqrt(4) = 2.0 to account for the 4 copies of the ADC noise that appear during the digitization of the 4 copies of the analog voltage.
I also show the RMS voltage (color coded to match the corresponding ASD) in case that's important for discussions of noise floors.
This exposes more interesting things, and rules out one thing that this 1e-12 [A/rtHz] noise floor might be -- it's *not* the ADC noise floor.
(5) Both version of the DARK noise traces, BLUE and RED show that the data agree with the noise model below 5 Hz, which gives me confidence that the scale of the model is correct across all frequencies.
(6) The MAGENTA trace shows that, when recast into ADC input voltage, the filtered nominal low noise data's "1e-12 [A/rtHz]" noise floor is "1e-6 [V/rtHz]," which is a factor of ~4 above modeled ADC noise floor.
(7) The BLUE trace shows the dark noise -- without the digital anti-aliasing filters -- is *also* above the ADC noise, is frequency-dependent, and *below* the MAGENTA filtered NOMINAL LOW NOISE data in the 20 to 200 kHz region.
(5), (6), and (7) all give me confidence that this frequency independent noise is *not* ADC noise
(8) The ADC input voltage
(a) during NOMINAL LOW NOISE data spans 5 orders of magnitude (0.2 [V_RMS] total in the CYAN NLN unfiltered trace, w.r.t. this 1e-6 [V/rtHz] high frequency noise floor in the filtered MAGENTA trace), and
(b) the DARK data spans 6 orders of magnitude (5.4e-4 [V_RMS] of the BLUE unfiltered trace, w.r.t the 1e-10 [V/rtHz] at the lowest 65 kHz notch in the RED trace). But BOTH are still above the dynamic range of where floating point precision would be causing problems -- dynamic range of 8 orders of magnitude. So, I don't think it's a numerical precision issue, unless I'm misunderstanding how that works.
(9) Also, given that the NOMINAL LOW NOISE data spans less orders of magnitude that the DARK noise data, and yet the filtered RED data does *not* show any such frequency-independent noise floor, I also don't think it's an issue what window I've chosen on the ASDs (it's the default Hanning window, for the record).
Just to add another view in further different units, to explore (8) a little better, I attach a third version of the plot, but cast into the 18 bit ADC's counts.
This is the third attachment, H1OMCDCPDs_0p1HzBW_10avgs_524kHzSignals_NLN_vs_DARK_CastAsADCInput_ctprtHz.png.
The further calibration is a simple multiplication of the ADC Input Voltage by a further 2^18/40 [ct/V].
(The inverse of this ADC voltage calibration has already been done in the "raw" channels in [mA], and the factor of 4 for the number of copies being summed has already been accounted, so I *can* treat these channels like a single ADC channel).
(10) Not much more interesting here, the MAGENTA trace showing "1e-12 [A/rtHz]" or "1e-6 [V/rtHz]" high frequency noise floor of the filtered NOMINAL LOW NOISE data, now in ADC counts, lands at an uninteresting "7e-3 [ct/rtHz]", compared to an RMS of ~1000 [ct_RMS]. So, it's not like we're bottoming out on ADC counts or ADC precision.
I'd really like to understand this noise, since it's present during NOMINAL LOW NOISE, and it's indicating that there's some flaw in our digital anti aliasing.
Images attached to this report
Comments related to this report
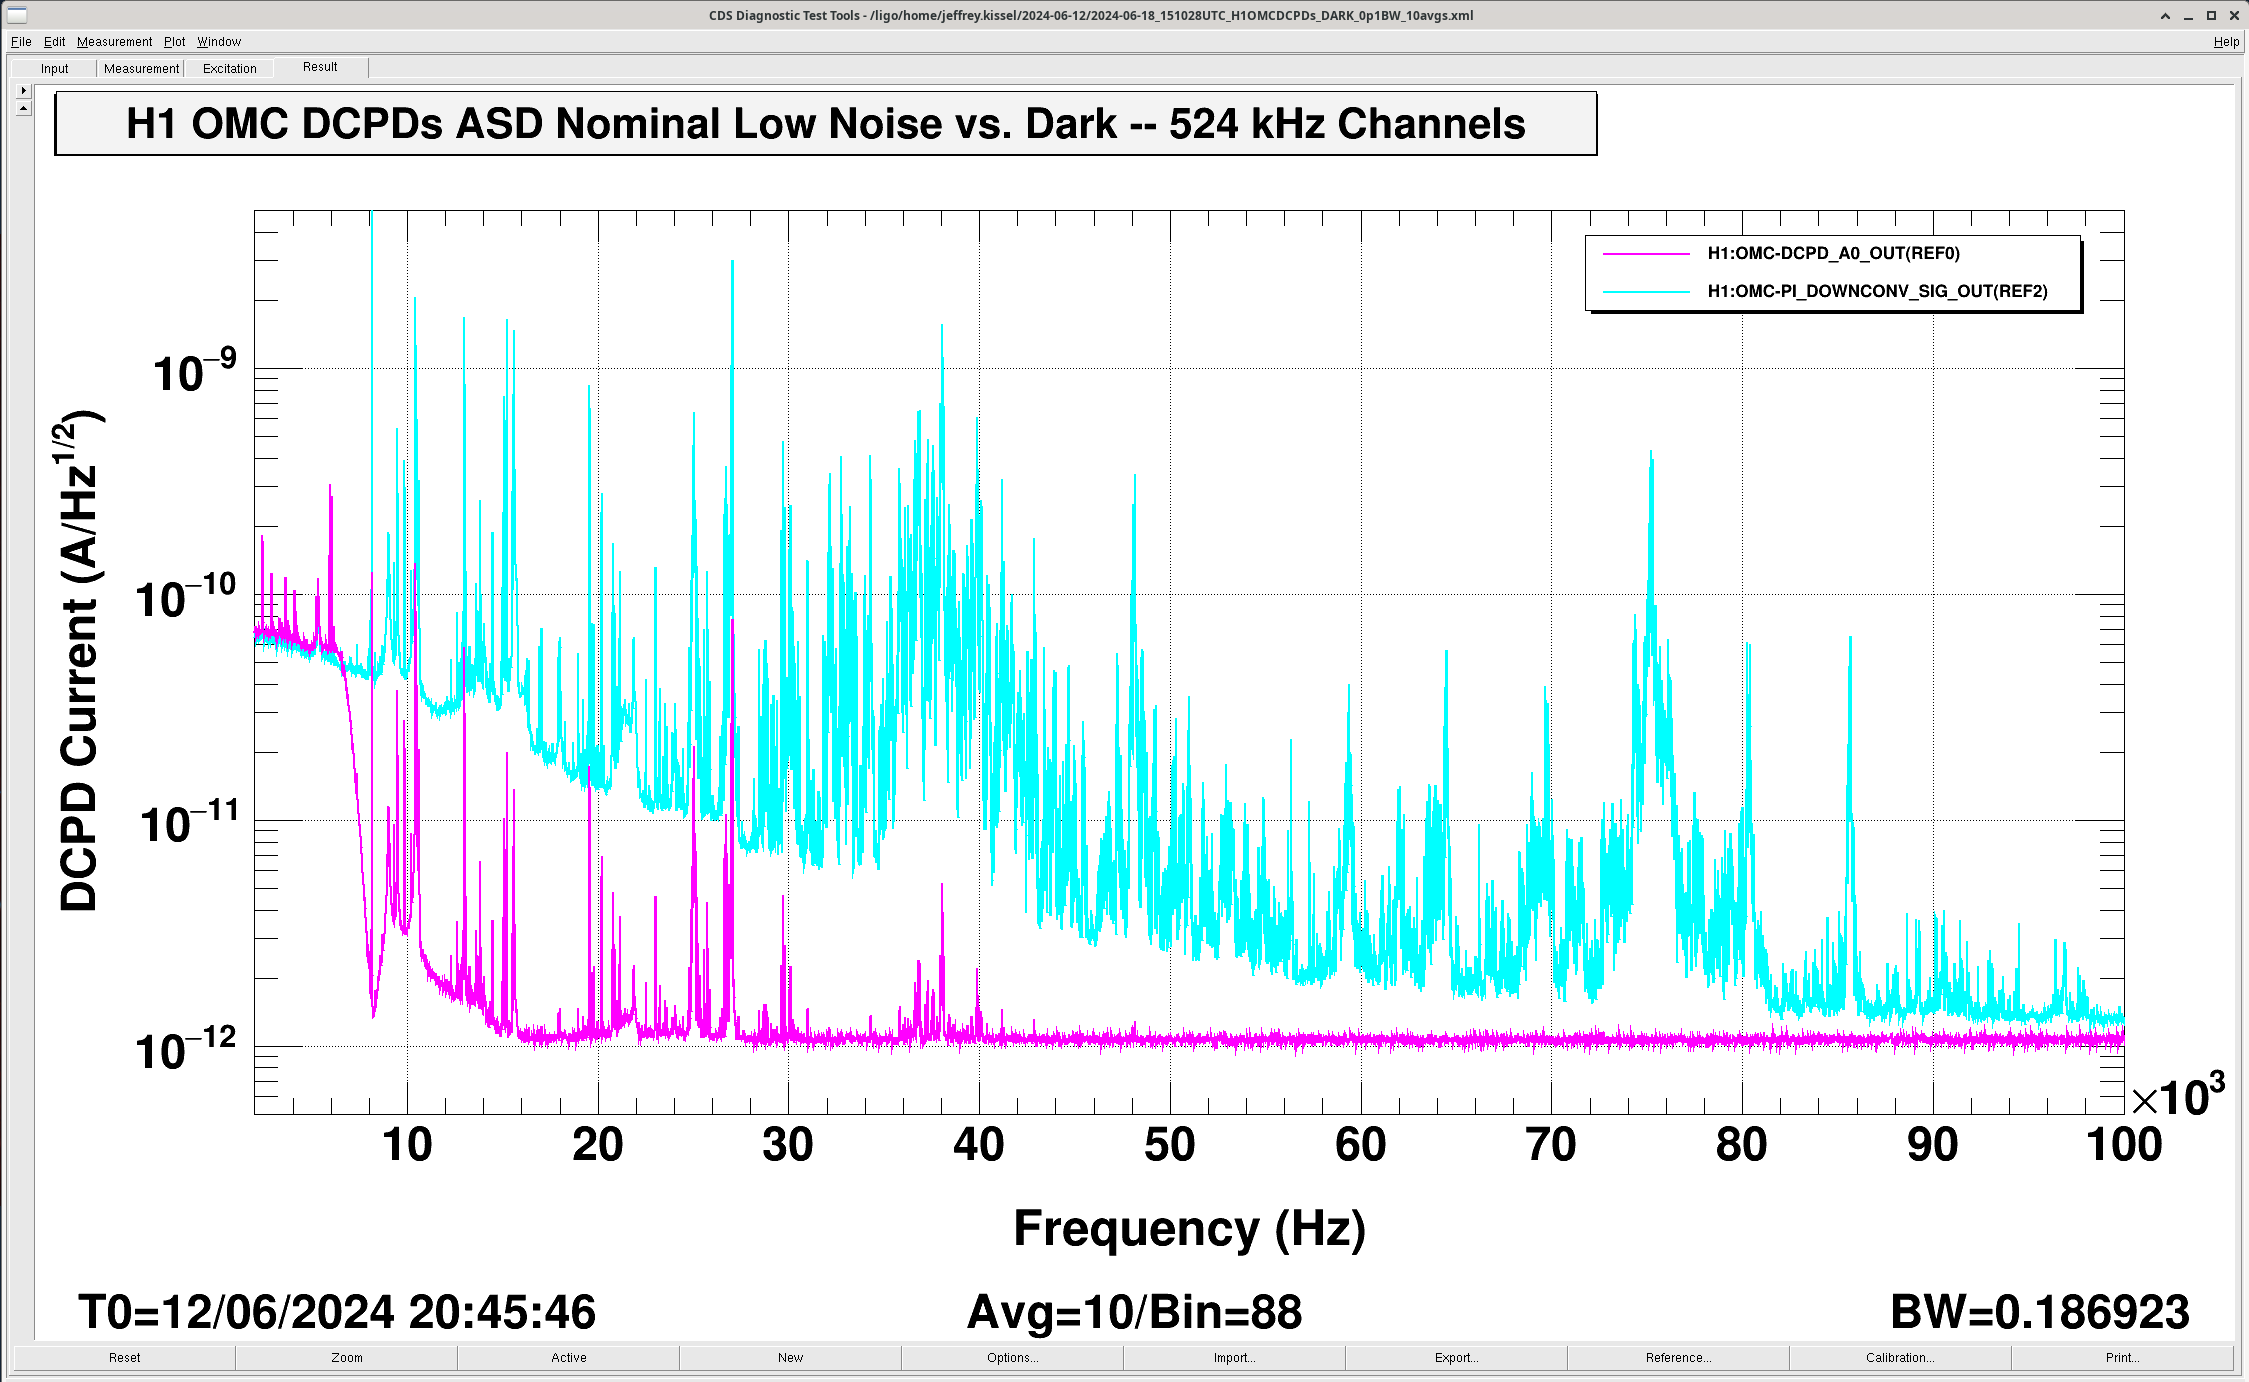
In case folks are interested, I attach a few zooms of the > 10 kHz region.

The first two attachments are in "raw" DCPD current units [A/rtHz], and the third attachment is in ADC input voltage units [V/rtHz] so one can compare against the ADC noise floor model.
Images attached to this comment

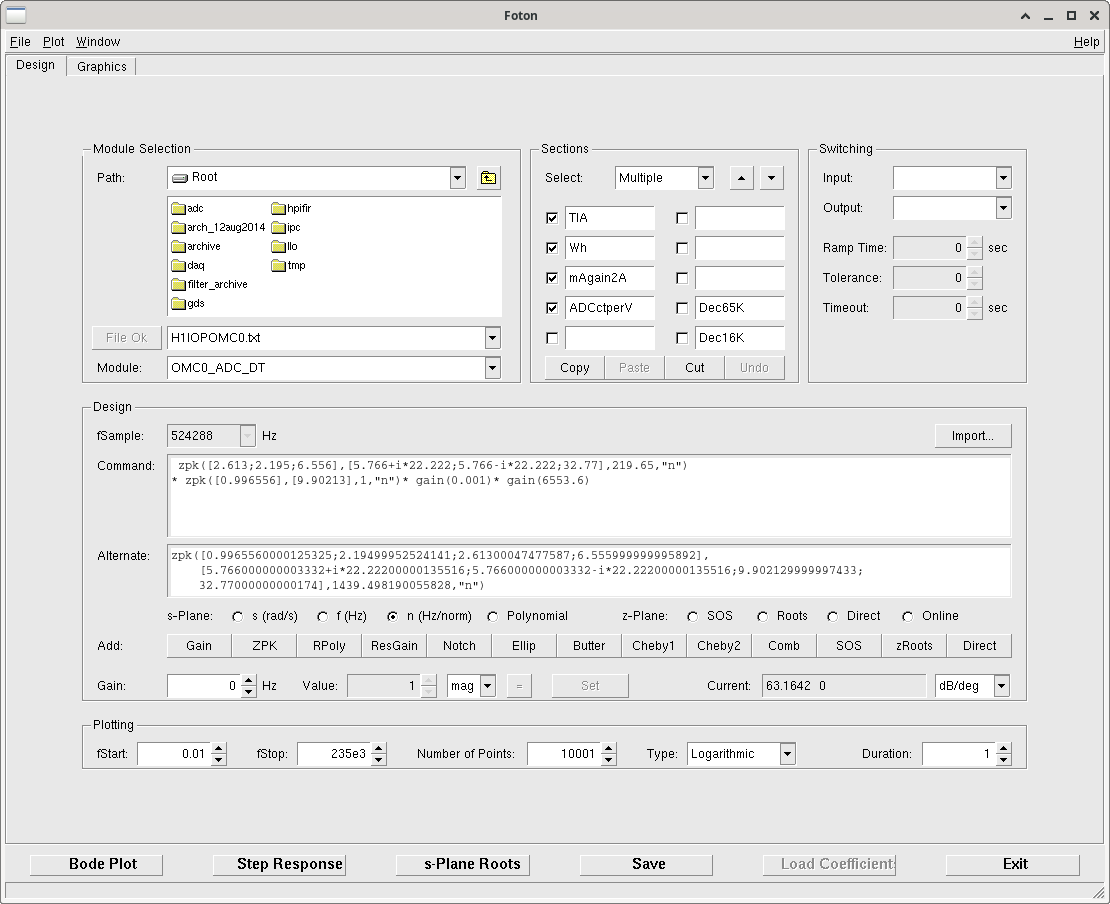
The calibration in DTT was not so easy.

For the DCPD channels, I ended up creating the appropriate calibration filter in foton, then exporting the trace to text file, then by-hand copying-and-pasting that text file's results into the funtional table in "Trans. Func." tab. I used this method and foton because I can
   - have separate filters for each TIA, Whitening, mA to A, ADC gain, components
   - bode plot the answer so I can sanity check the frequency response, and confirm the overall scale factors is correct (in particular, that the TIA had magnitude of 100e3 [V/A] at 100 kHz)
rather than the DTT "Pole/Zero" tab, where
   - the calibration filter is all in one long collection of poles and zeros,
   - I have no idea how the poles and zeros are normalized, and
   - I can't visually check the filter response and magnitude.

I attach a screenshot of the foton design that shows all the filters needed above,
   - the TIA
   - the Whitening
   - the mA per A gain
   - the ADC ct per V gain
and the "Command" field shows all of these filters' details multiplied together (separated by the asterisk).

I used the filter file
    /opt/rtcds/lho/h1/chans/
        H1IOPOMC0.txt
from the h1iopomc0 front-end model because it's a 524 kHz filter file, allowing me to add frequency response features above the traditional 8 kHz Nyquist frequency of a 16 kHz model (even though I didn't end up adding any of those features, I had thought for a while that I would have, given that the TIA and Whitening have the above mentioned ~11, 10, and 44 kHz poles. But, as discussed above, I don't need them.)
Note, I didn't save this filter or load it into the front-end or anything, I just used the filter bank as a sandbox to create the calibration filters.

For the ADC noise, I took the noise model from the svn directory for the OMC whitening design update,
     /ligo/svncommon/CalSVN/aligocalibration/trunk/Common/Documents/G2201909/
         BHD_PreampOnlyAndAdcNoise_10mA_6dBSqueeze_512kHzSample_adc.txt
which is already in ADC input voltage [V/rtHz] units, then imported it into matlab, divided by 2 and re-exported for the average-of-four-channels ADC noise curve in the main aLOG's second attachment.
Then, I multiplied this average-of-four-channels noise estimate by the 2^18/40 [ct/V] and re-exported for the ADC noise curve in the main aLOGG's third attachment.

The DTT templates for this work live in
    /ligo/home/jeffrey.kissel/2024-06-12/
        2024-06-18_151028UTC_H1OMCDCPDs_DARK_0p1BW_10avgs.xml                      # calibrated into raw DCPD current in [A/rtHz]
        2024-06-18_151028UTC_H1OMCDCPDs_DARK_0p1BW_10avgs_calibratedtoADCV.xml     # calibrated into ADC input voltage in [V/rtHz]
        2024-06-18_151028UTC_H1OMCDCPDs_DARK_0p1BW_10avgs_calibratedtoADCct.xml    # calibrated into ADC counts in [ct/rtHz]


I attach the calibration files and ADC noise curves produced for this aLOG as well (which are also in that 2024-06-12 directory in my home folder).
Images attached to this comment
Non-image files attached to this comment

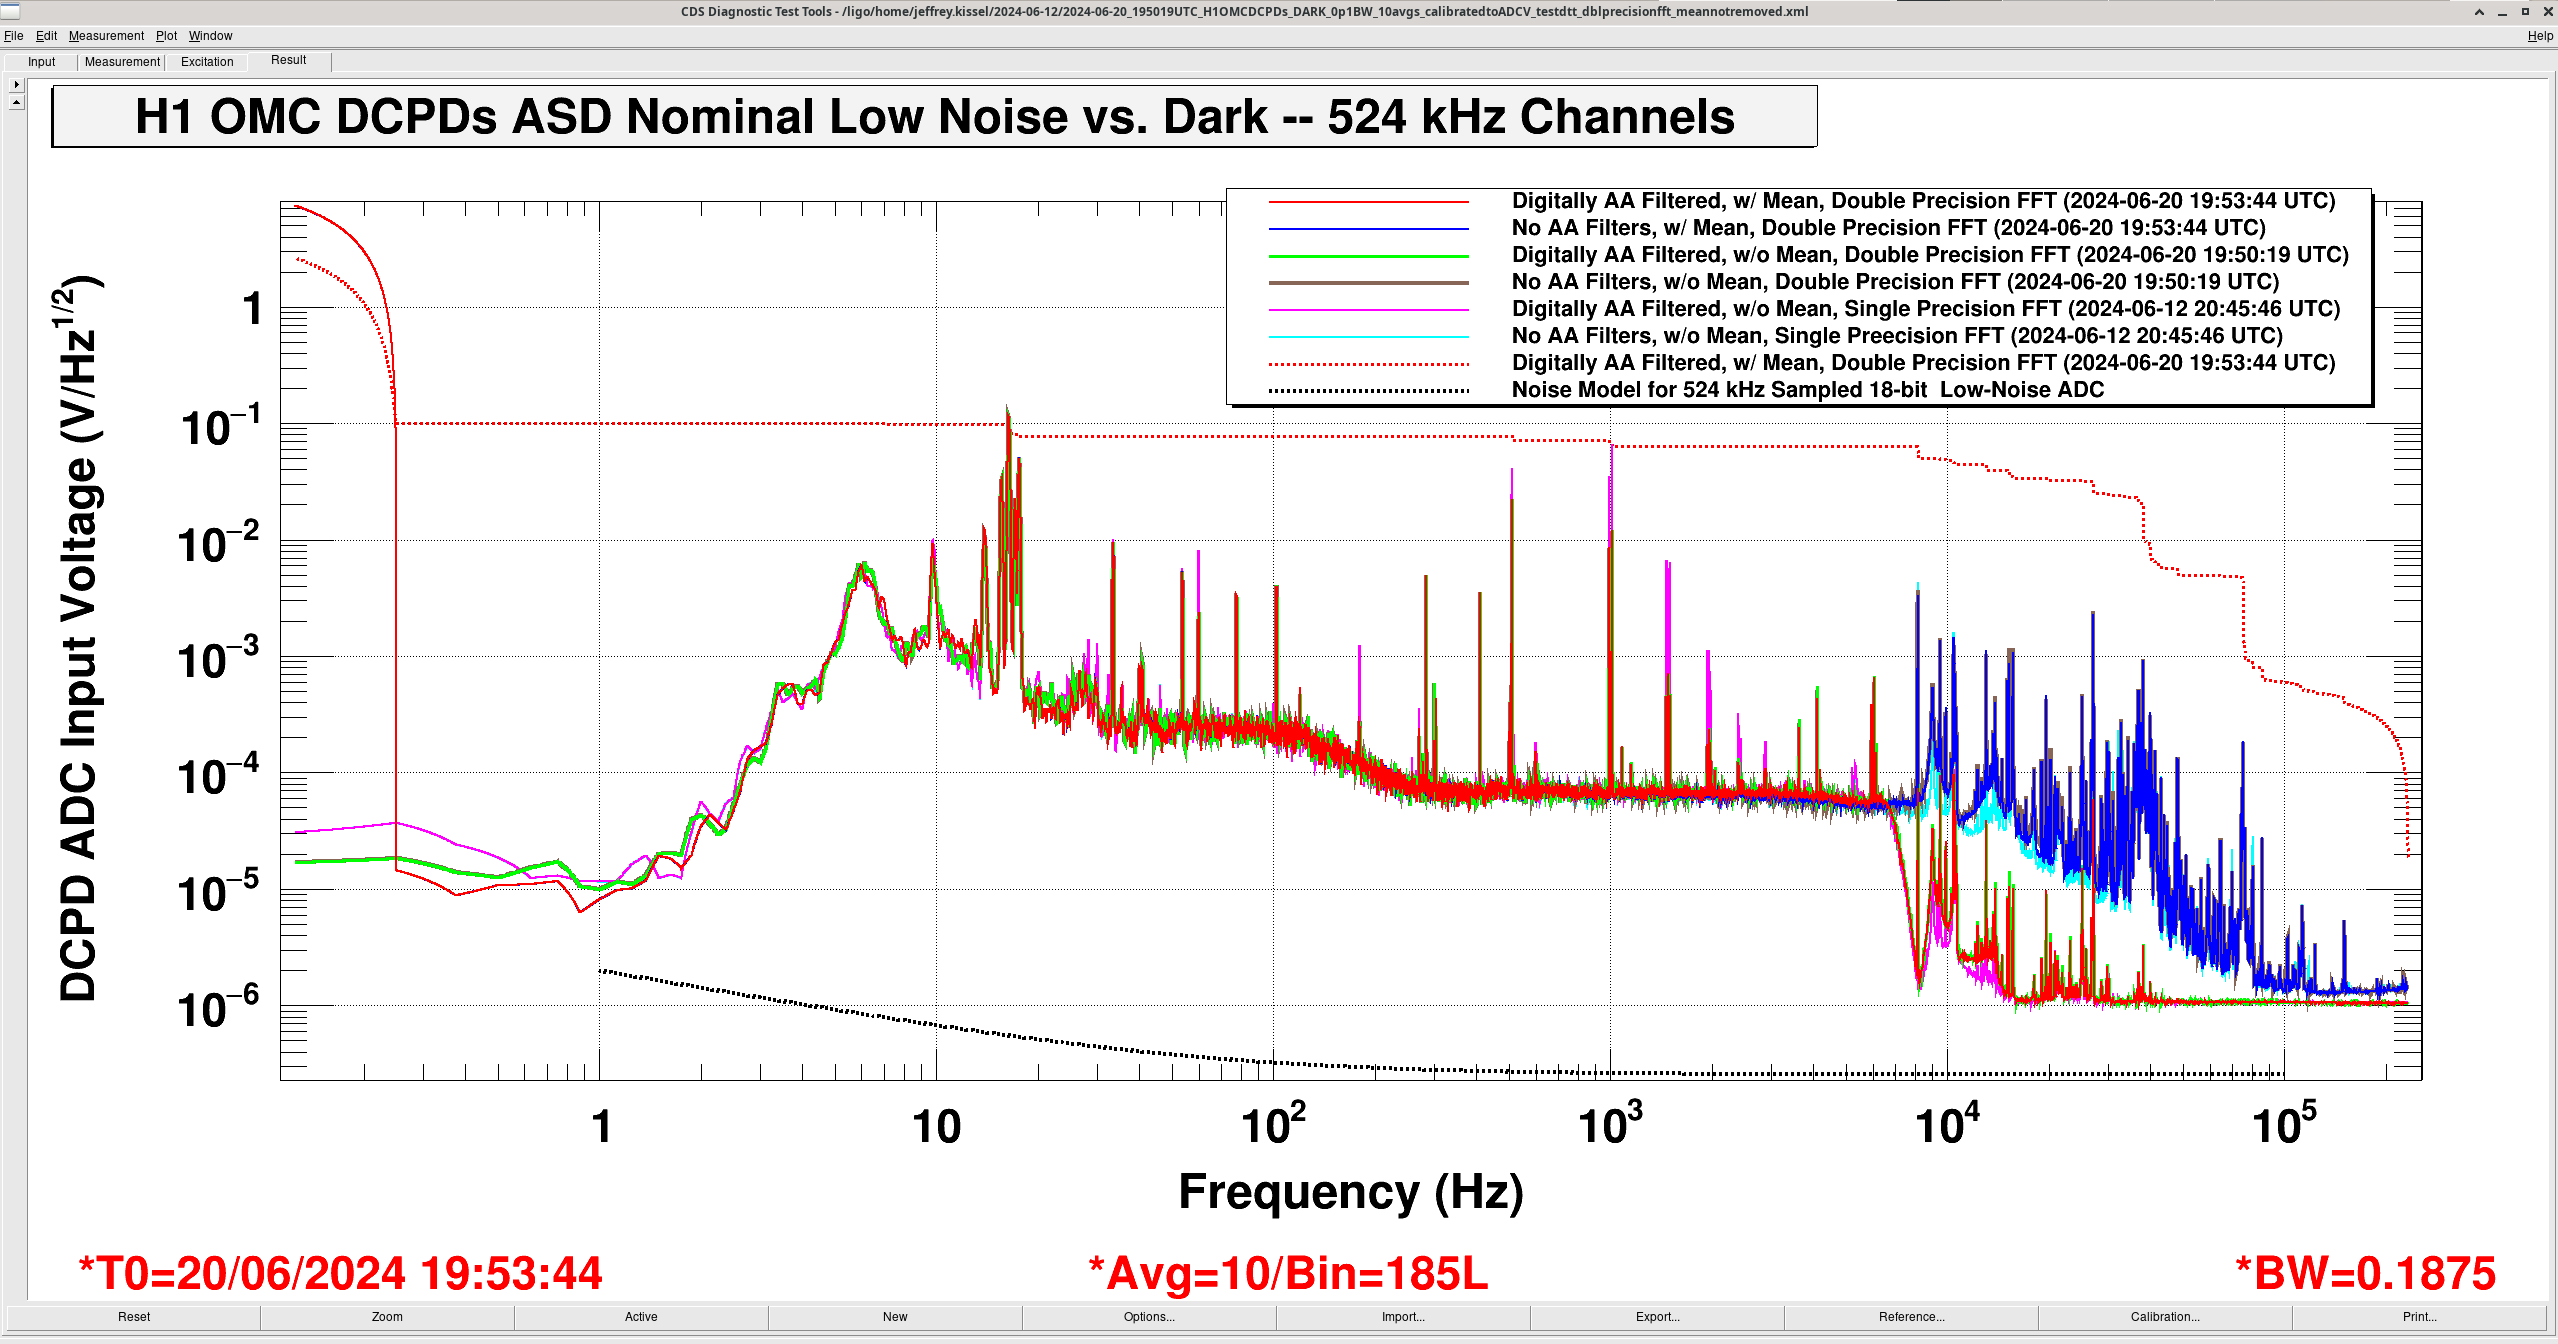
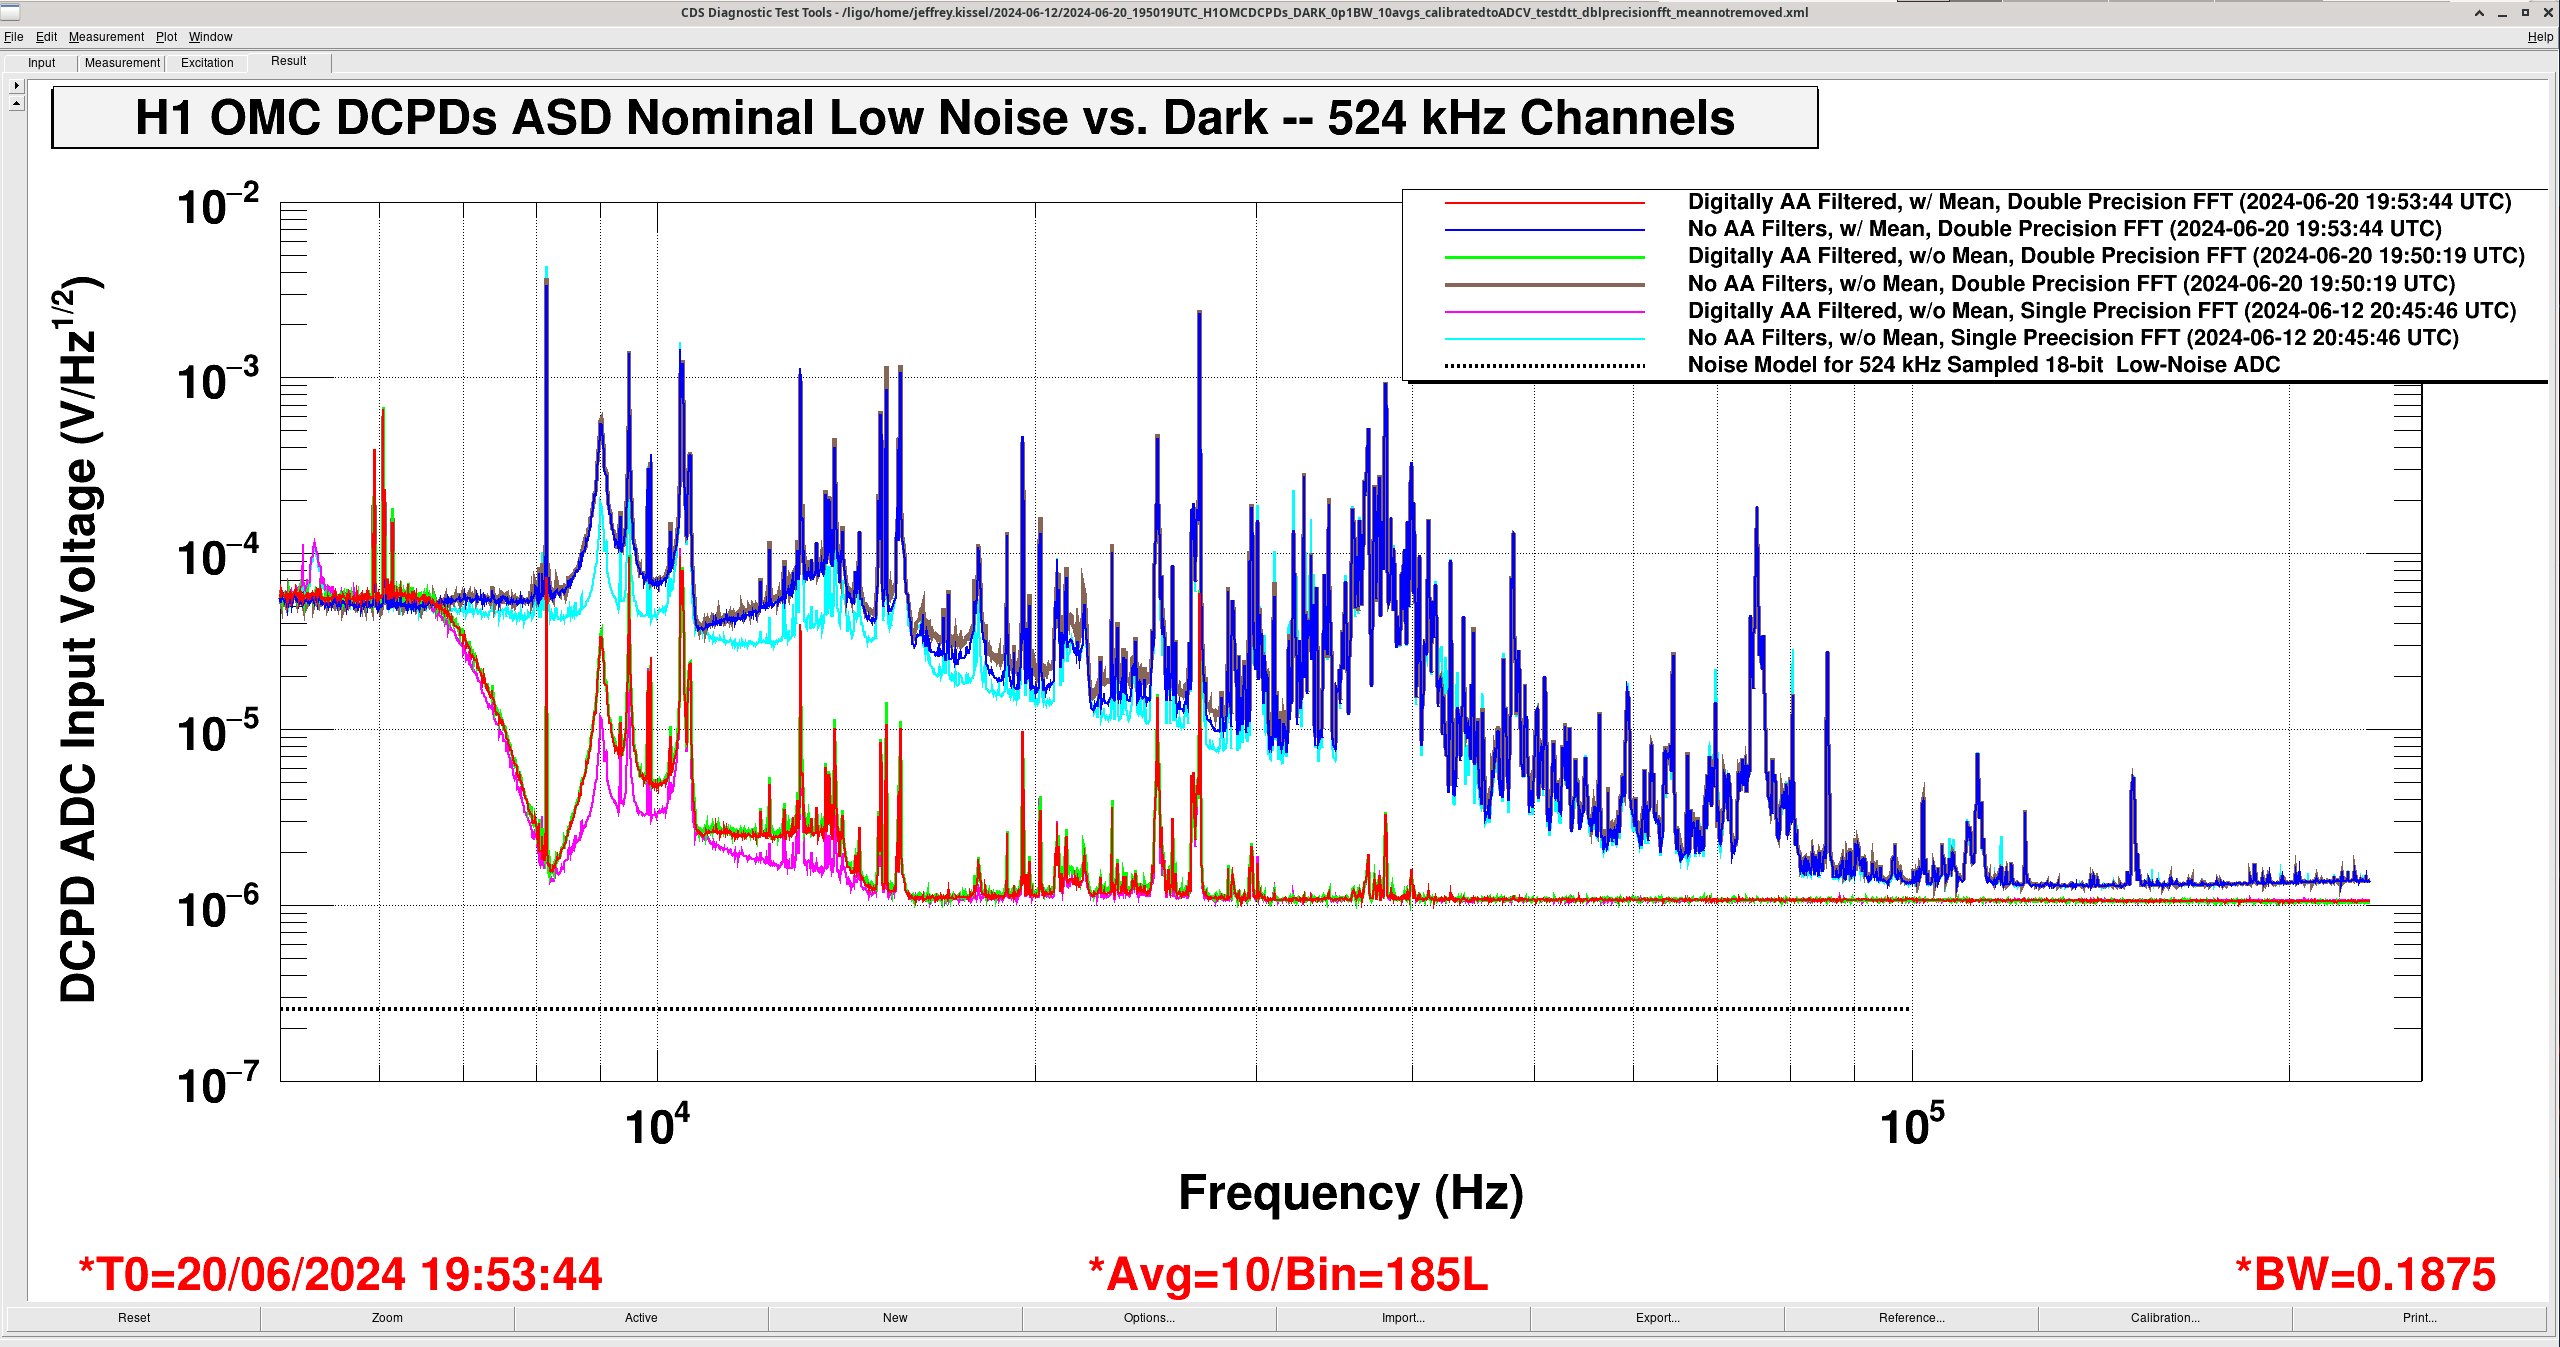
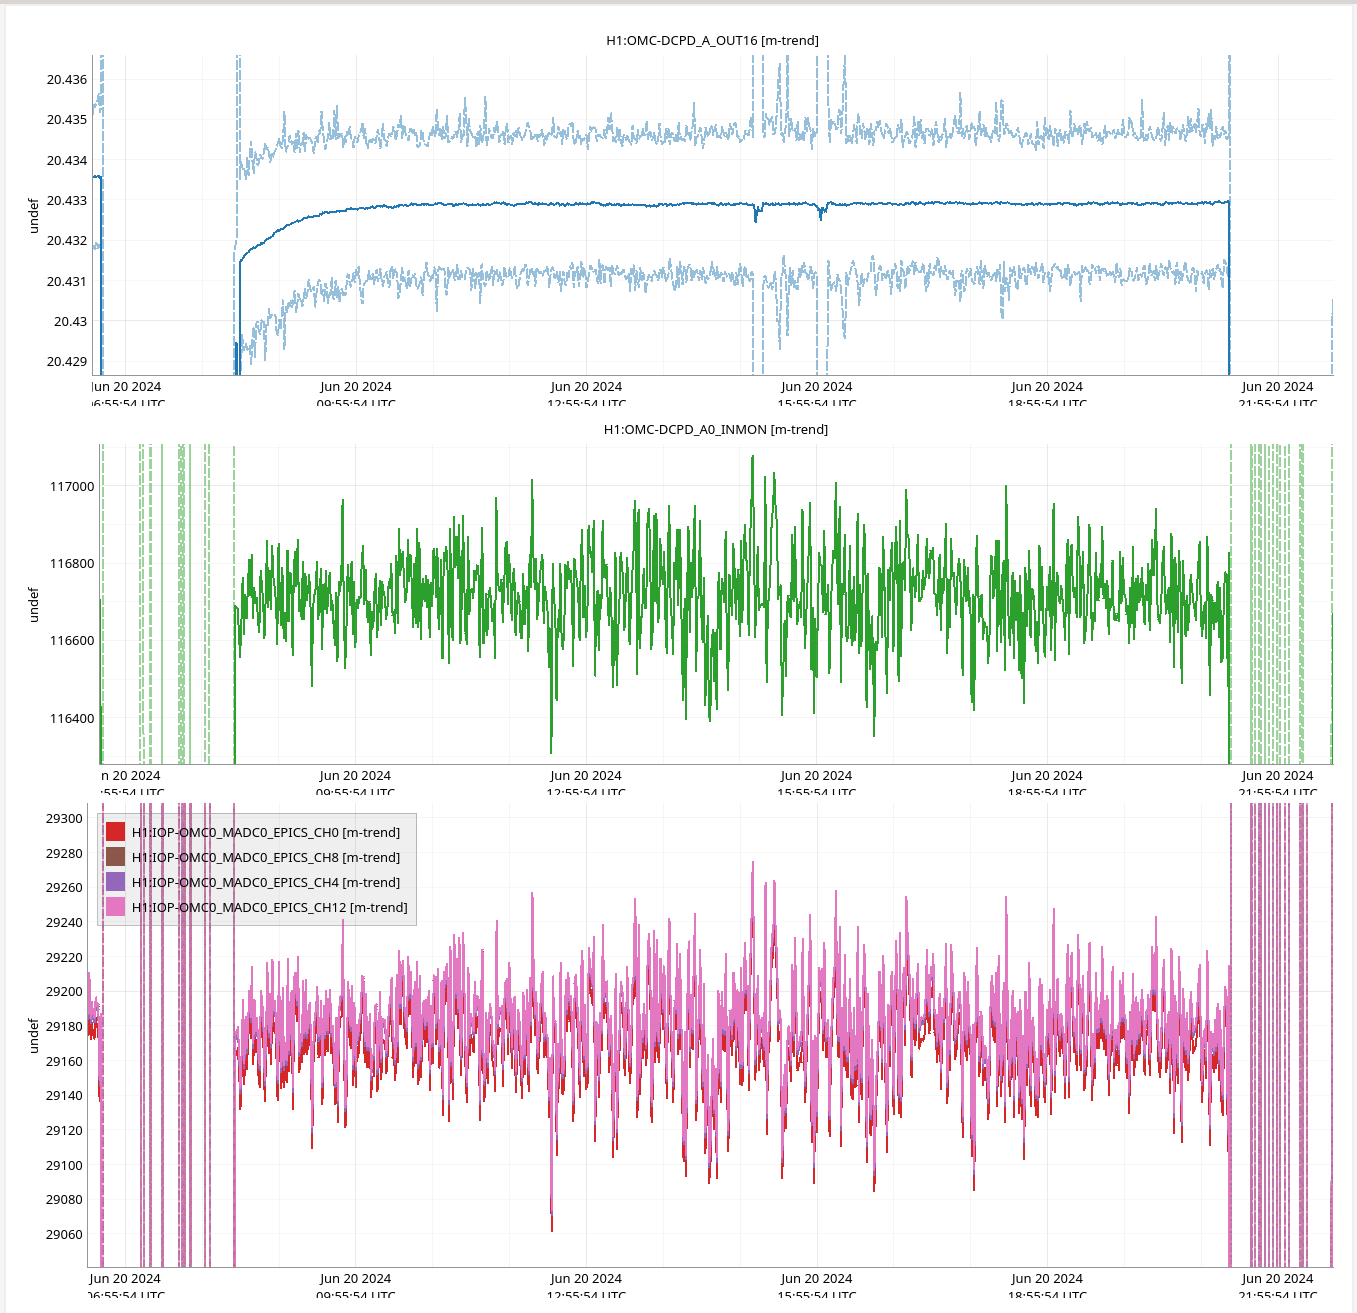
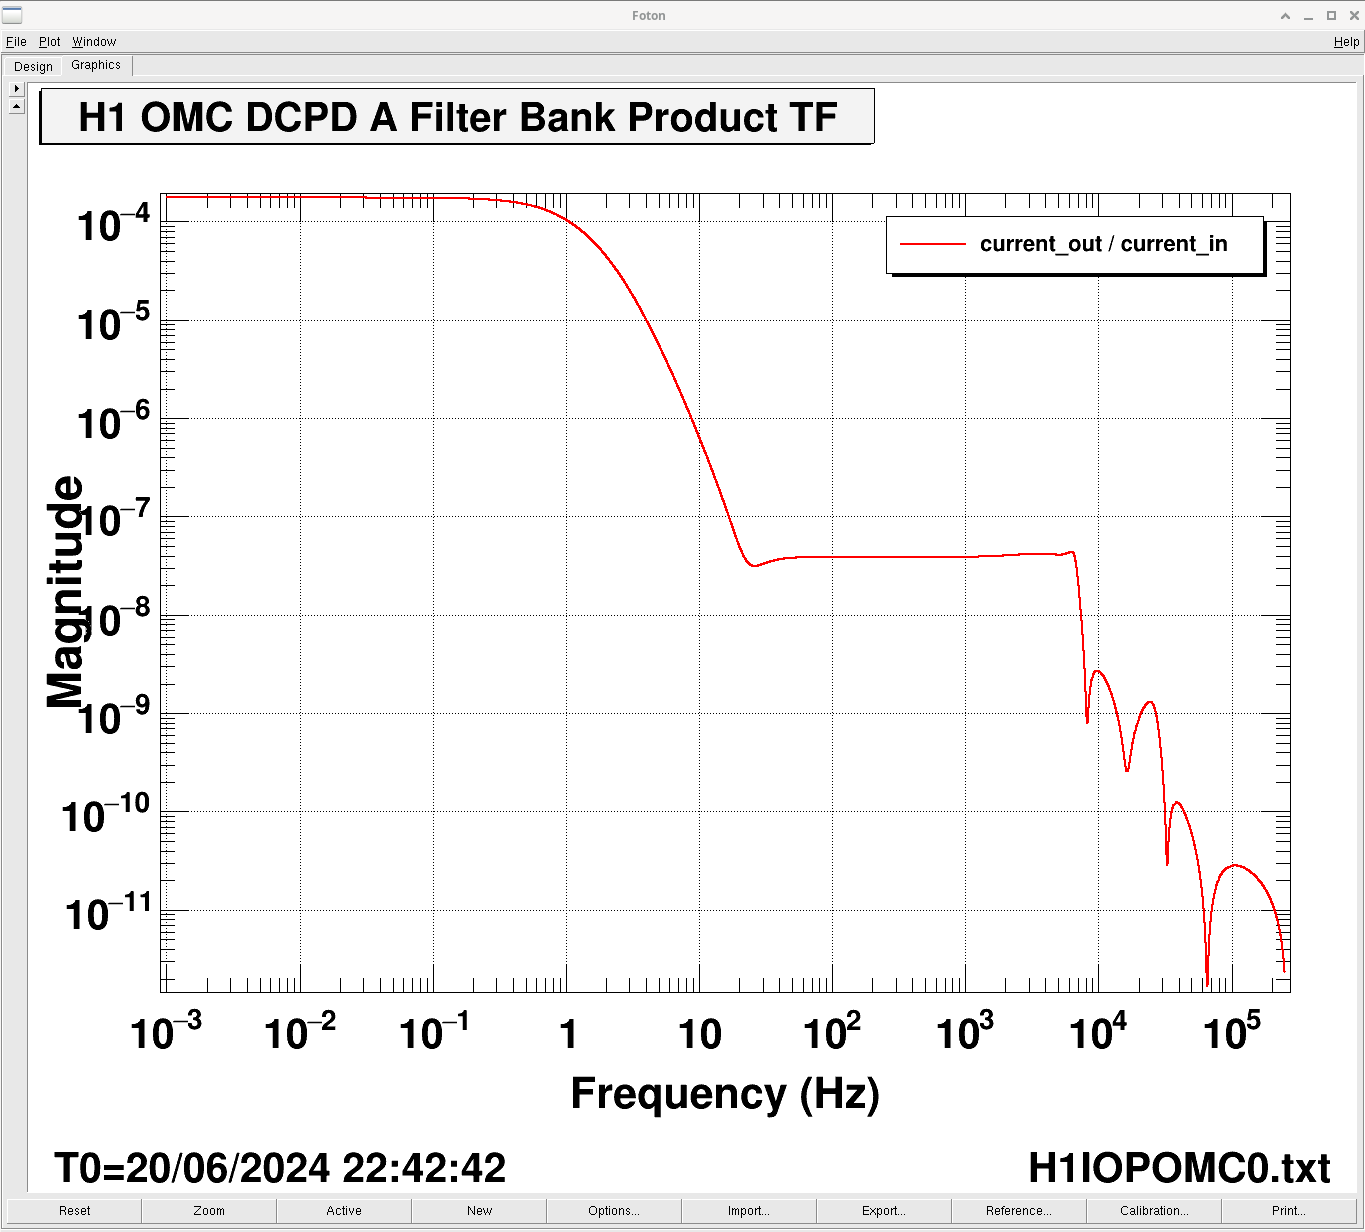
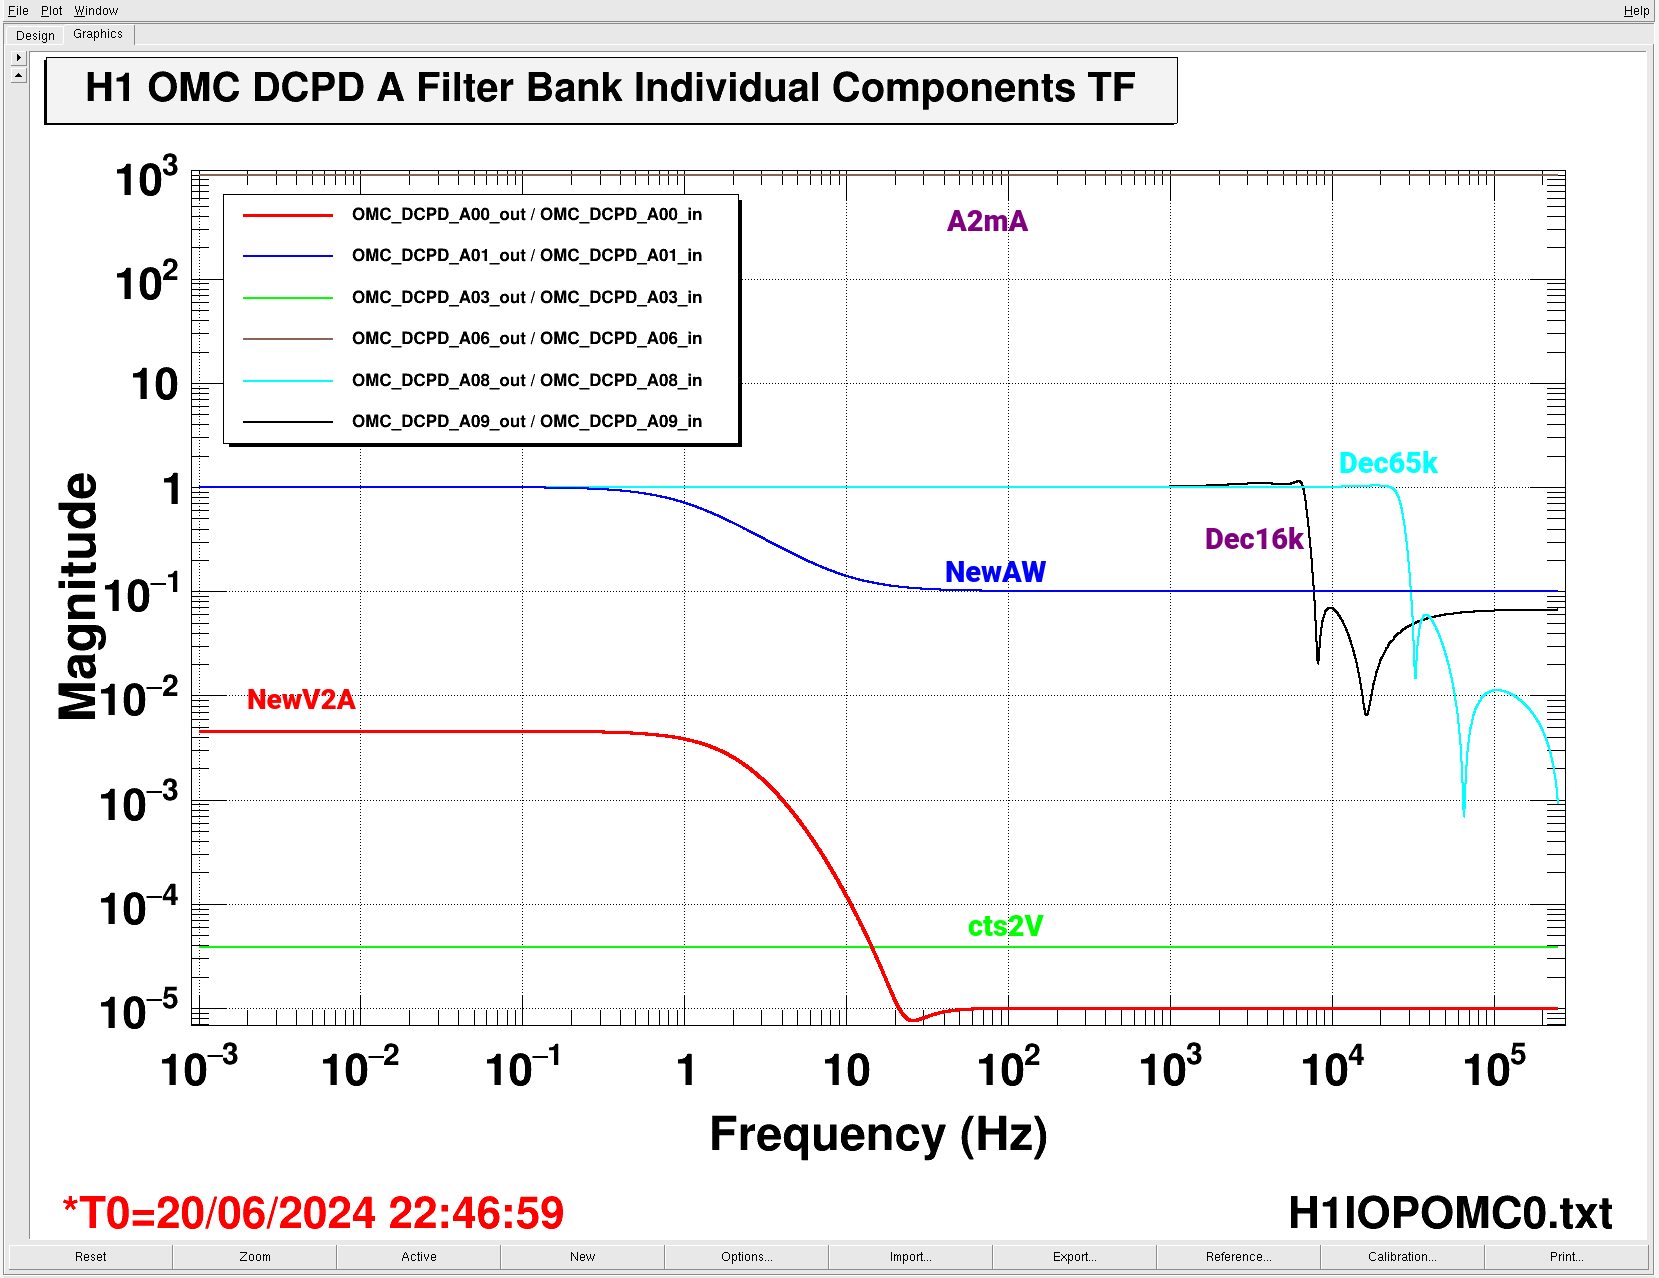
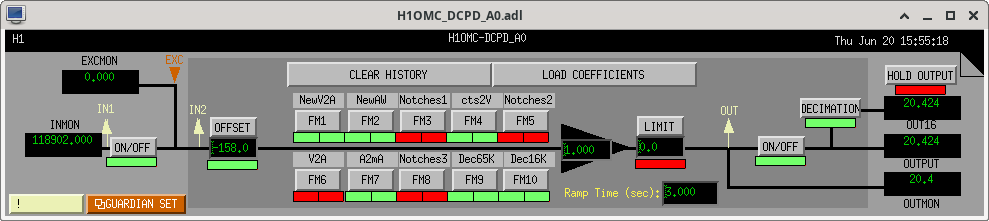
J. Betzwieser, E. von Reis, J. Kissel
T990013 DTT Manual, Section 3.1.4

It *is* a numerical precision issue -- I *didn't* understand understand "how it worked" er, what I was missing.

Long story short --- the above DTT ASDs have the "Remove Mean" option checked as ON.
The data actually contains a comparatively *huge* DC component -- the well known 20-ish [mA_peak] of light that comes in from the DARM offset.
The front end data is spit out to test points at single precision.
Compared with the ~1e-12 [A_rms/rtHz] or less signal I'm trying to explore, that *is* a huge dynamic range that does push the numerical limits of the single-precision test point data.

Here, I attach the same ASD comparison between the "raw" 524 kHz ADC channel (the OMC-PI_DOWNCONV channel) and the output of the OMC-DCPD_A0 bank after the digital down sampling filters.
First attachment is the full frequency vector, and the second attachment is the high-frequency portion.
For all traces, the detector is in NOMINAL LOW NOISE, and for this purpose I found it more natural to use the signals calibrated into ADC input voltage units. However, in the attached, I now compare the two channels under three different configurations of the DTT analysis software:
    (1) The same CYAN and MAGENTA, nominal low noise data as in the main entry taken on 2024-06-12. This still has the "Remove Mean" option checked, *and* is using the control room's default diaggui software suite, which computed the pwelch algorithm using single-precision.
    (2) I took new data today 2024-06-20, also in nominal low noise, but this GREEN and BROWN data set is using Erik's more feature-full developmental
        /usr/bin/diaggui_test
       which computes the pwelch algorithm using double precision, and
    (3) One more data set, taken shortly after (2), in BLUERED, which uses the double-precision calculation, but I've *unchecked* the "Remove Mean" option, and thus exposed the DC component of the signal.

Trending a typical NLN segment, the first "officially named" available channel in the digital chain of the DCPD readout is the sum of the 4 copies of the analog voltage.
That's H1:OMC-DCPD_A0_IN1 (or the 16 Hz readback version H1:OMC-DCPD_A0_INMON), and that reads
    116700 [ct] * (40/2^18 [V/ct]) = 17.8 [V_DC] * (1 / 4 [copies]) = 4.45 [V_DC].
The unofficial generic CDS channels for each ADC channel are also available (H1:IOP-OMC_MADC0_EPICS_CH[0,4,8,12]), that these signals, before the sum, also corroborate 4.5 [V_DC],
    29200 [ct] * (40/2^18 [V/ct]) = 4.45 [V_DC]
So that's the upper end of the dynamic range of the signal we're dealing with, in ADC input voltage units.

Here's what we see in the attachments:
    (i) When we uncheck the "Remove Mean" box, the secrets are revealed -- the lowest frequency data point reports ~4 [V_DC]
    (ii) -- and echo of (b), given the dynamic range of this signal, computing pwelch algoirthm in single precision or double precision results in the same noise floor of "1e-6 [V/rtHz]" above ~10 kHz where the real noise is small.

But -- it isn't 8 orders of magnitude smaller... so I also wonder if we hit this noise because of the order in which we compute the filters within the A0 bank. For the purposes of discussion, I attach
    - the total transfer function of the A0 bank, H1OMCDCPD_A0_FilterBank_TF.png
    - each of the filters in the bank, in order, H1OMCDCPD_A0_FilterBank_Component_TF.png
    - the MEDM screen, for ease of interpretation H1OMCDCPD_A0_FilterBank_MEDM.png

The front-end computes everything in double precision, right?
Images attached to this comment