thomas.shaffer@LIGO.ORG - posted 11:23, Monday 24 June 2024 (78624)
New DARM BLRMS ndscope FOM
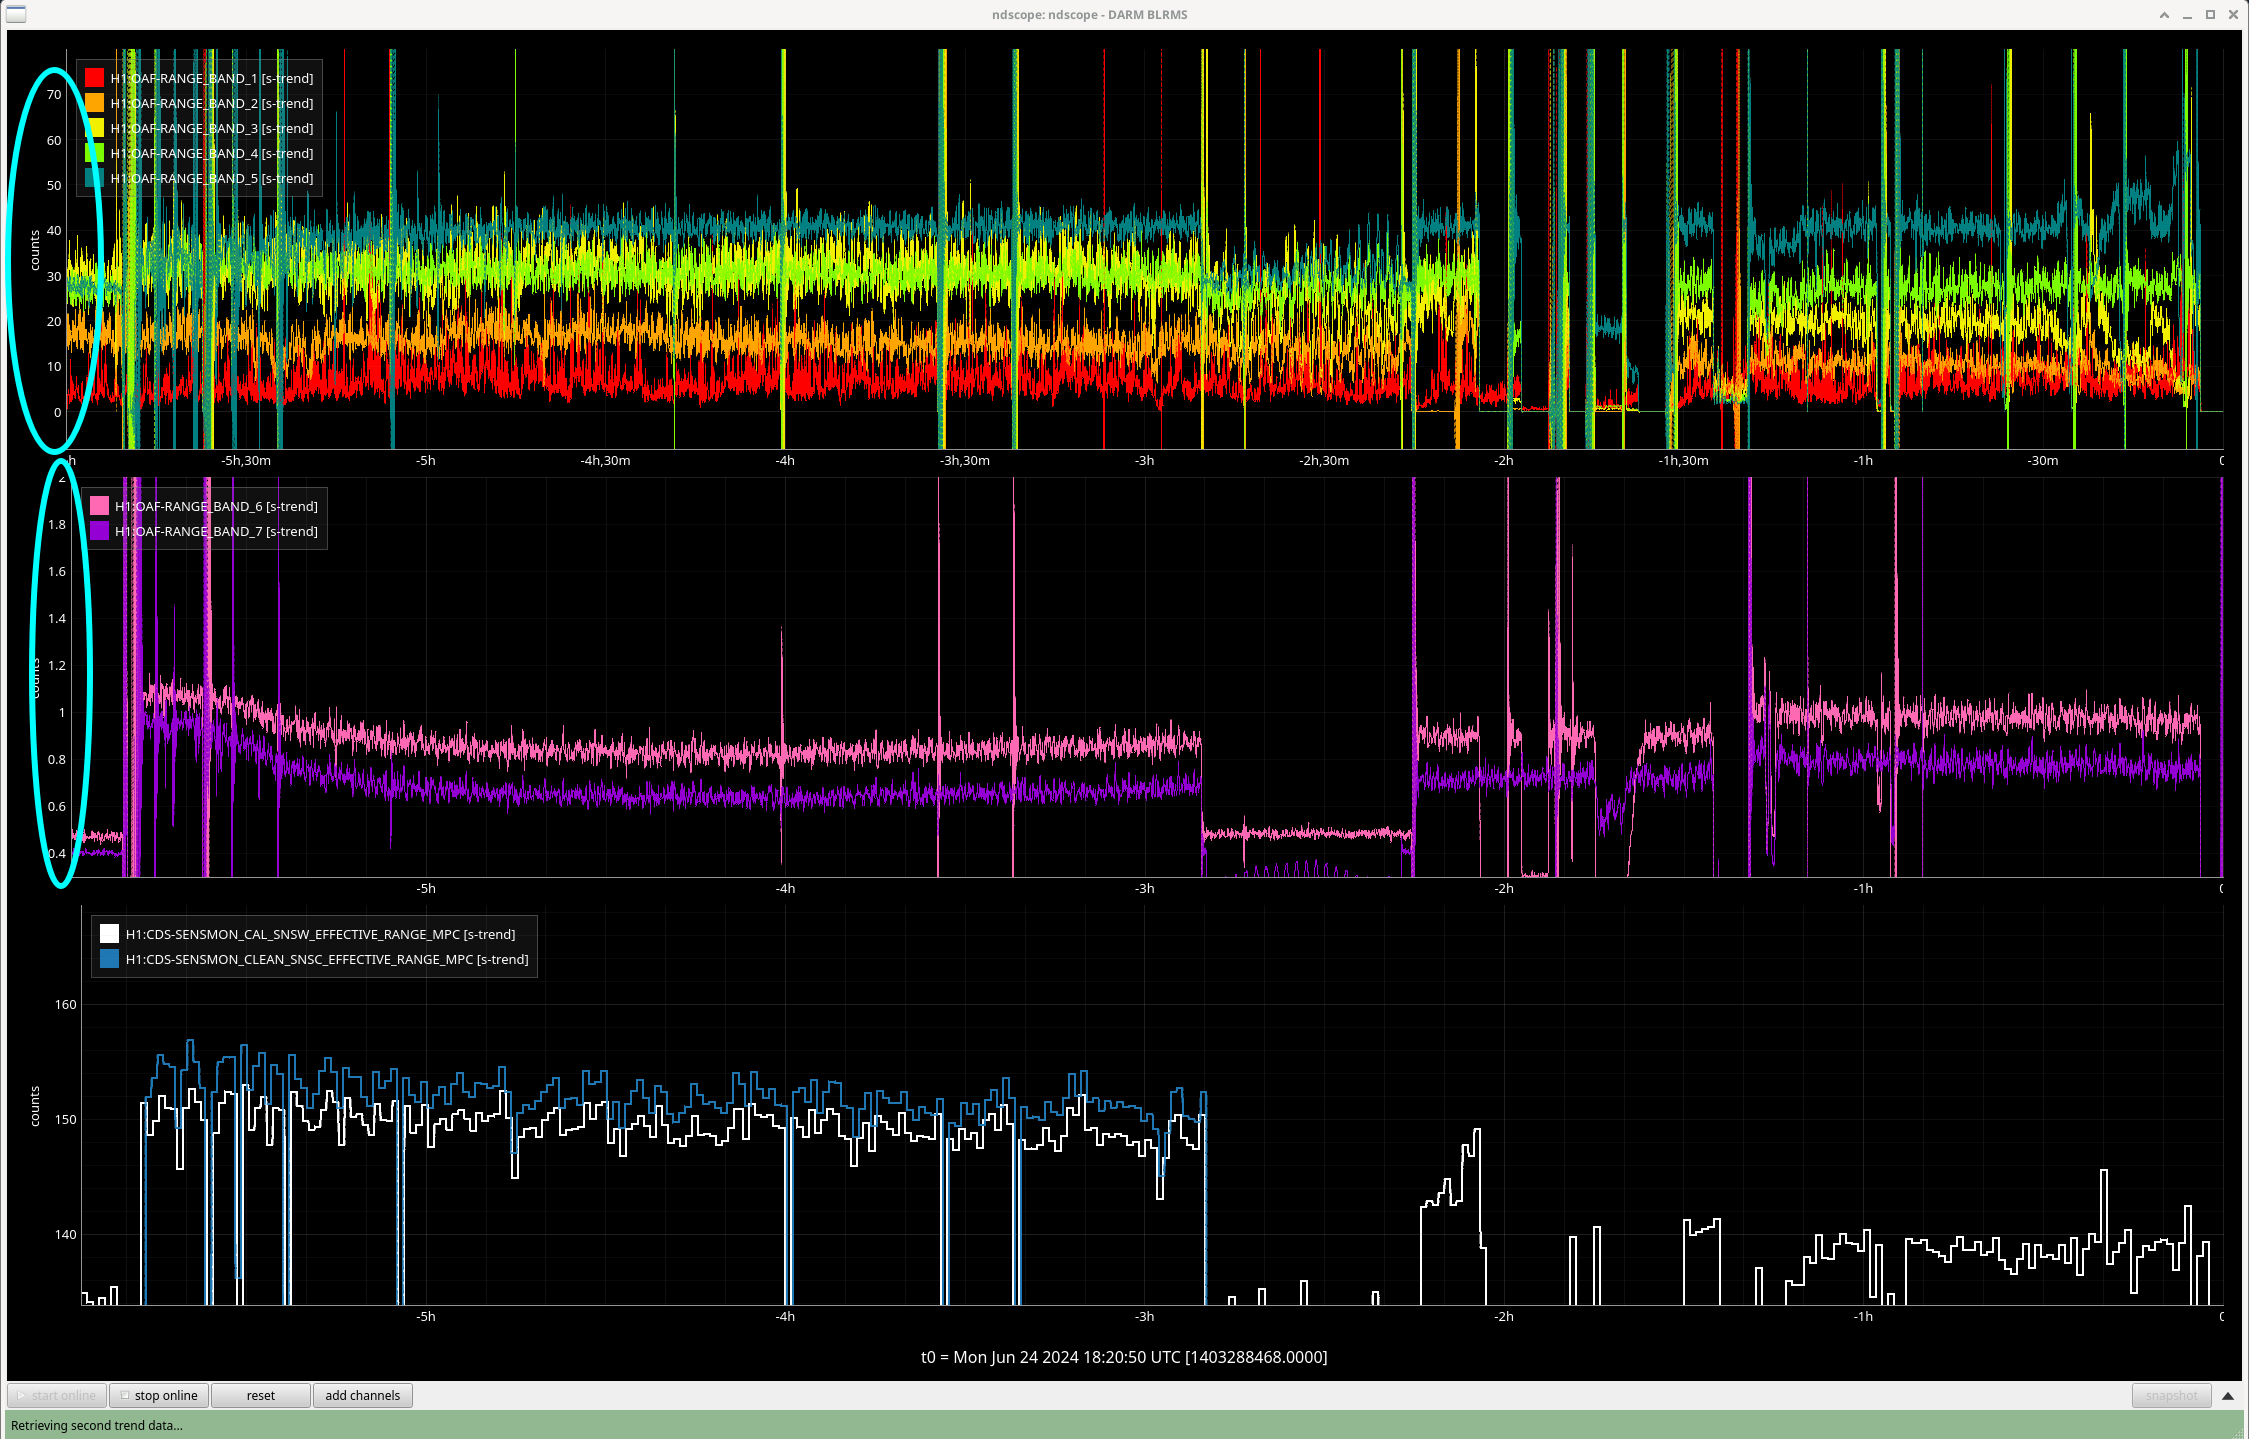
I added a new version of the DARM BLRMS FOM based off of Minyo's template (alog77815). The top two plots are the inverted BLRMS, so positive changes seen on these should correlate to positive changes in the range. The units of the top plots should be close to Mpcs, so it is important to look for changes in the top plot since the scale is so much larger.
Using this in conjunction with the low range checks should help us diagnose what is changing our range around lately.
Images attached to this report