louis.dartez@LIGO.ORG - posted 12:36, Wednesday 03 July 2024 (78840)
GDS FIR filter residuals differences between L1 and H1.
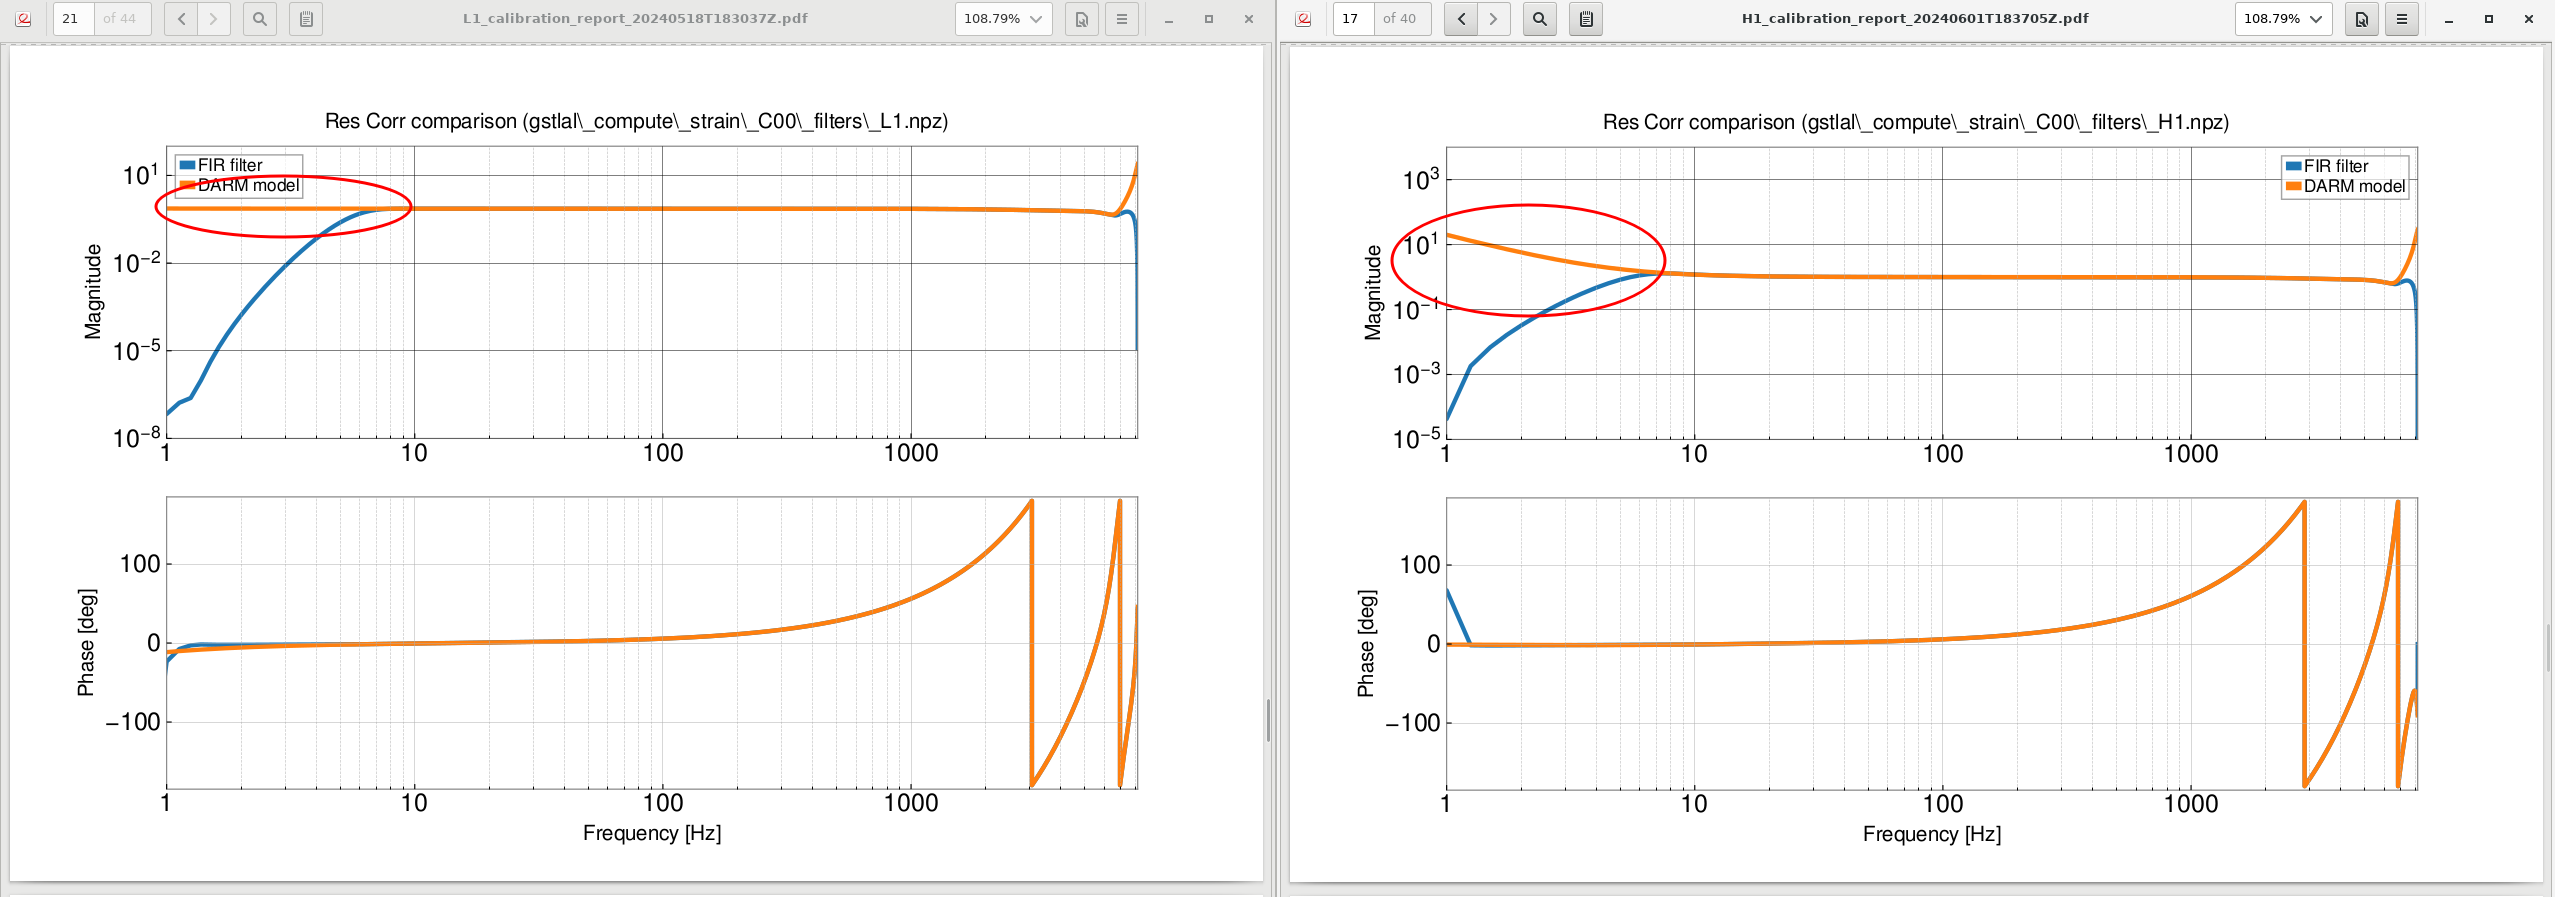
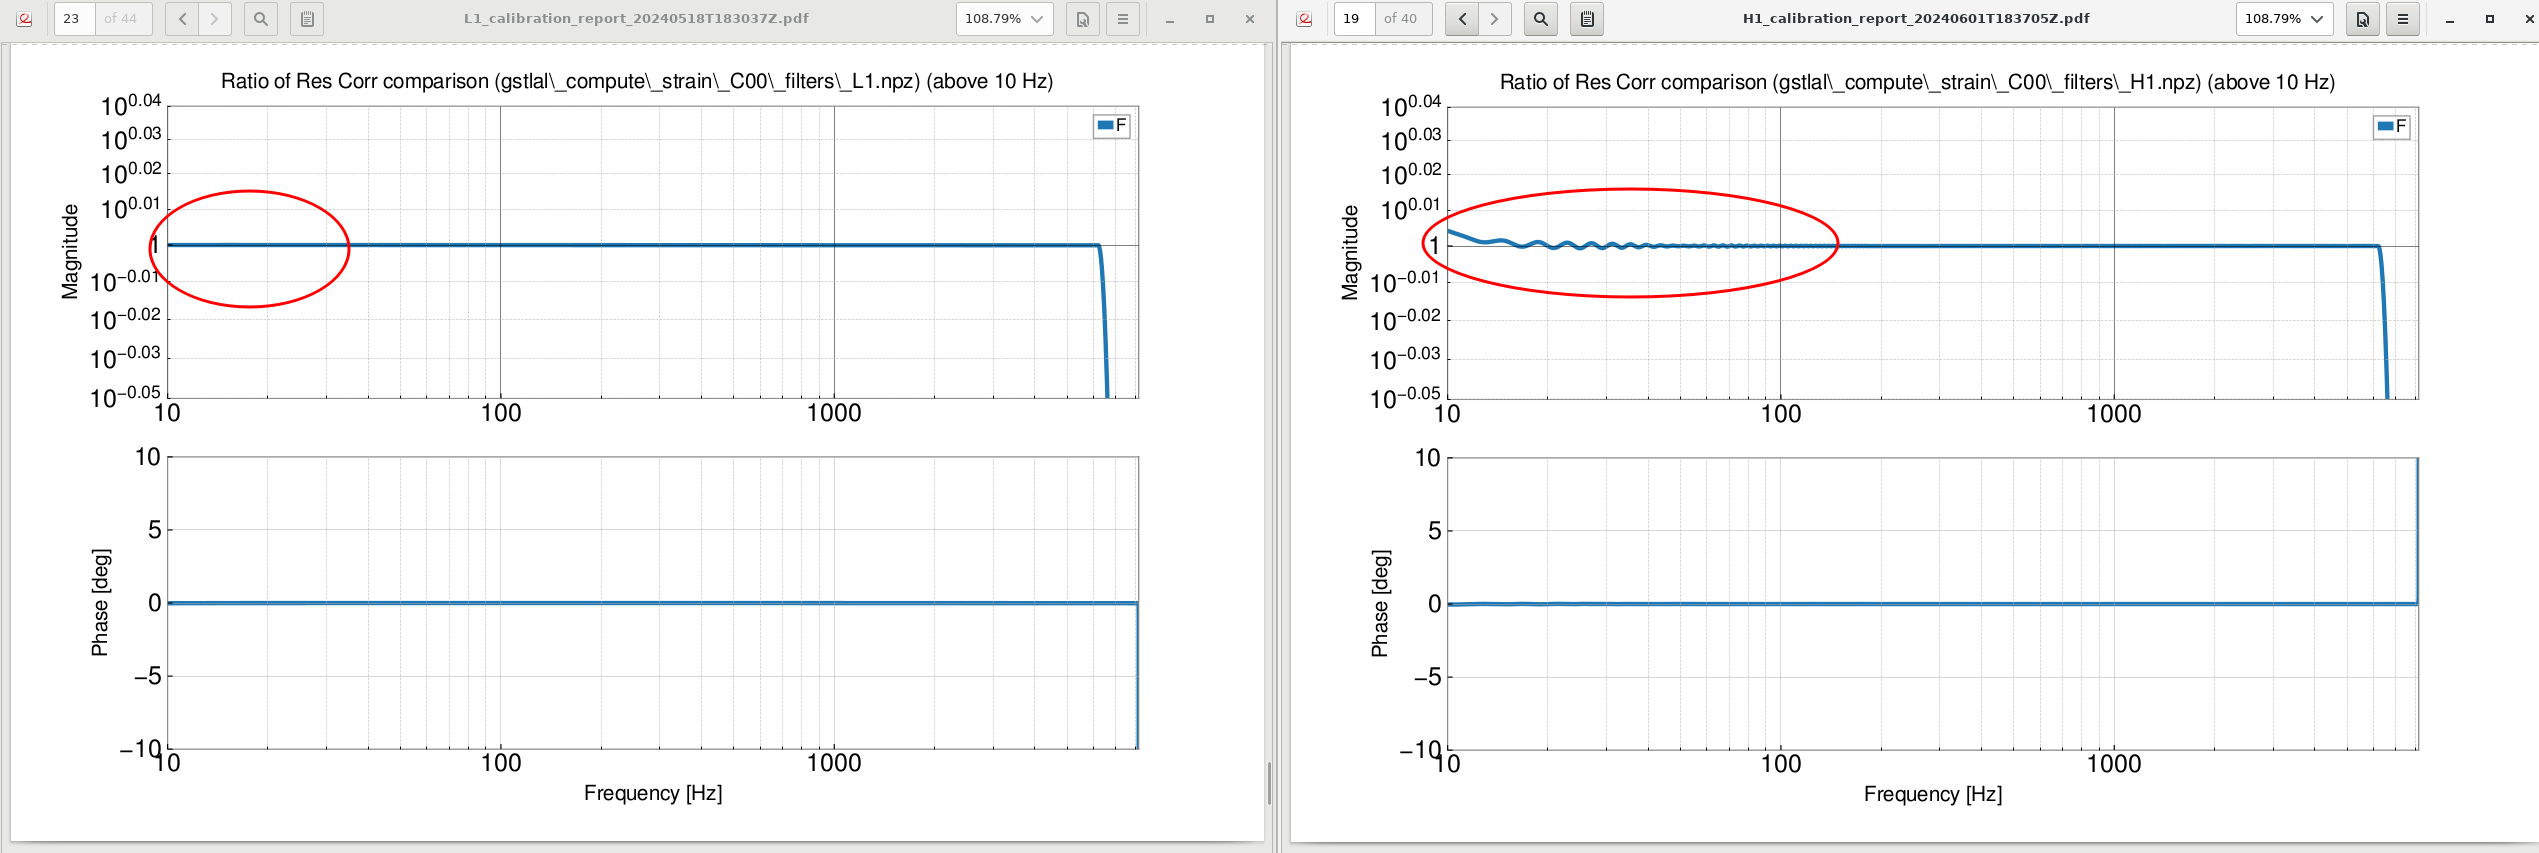
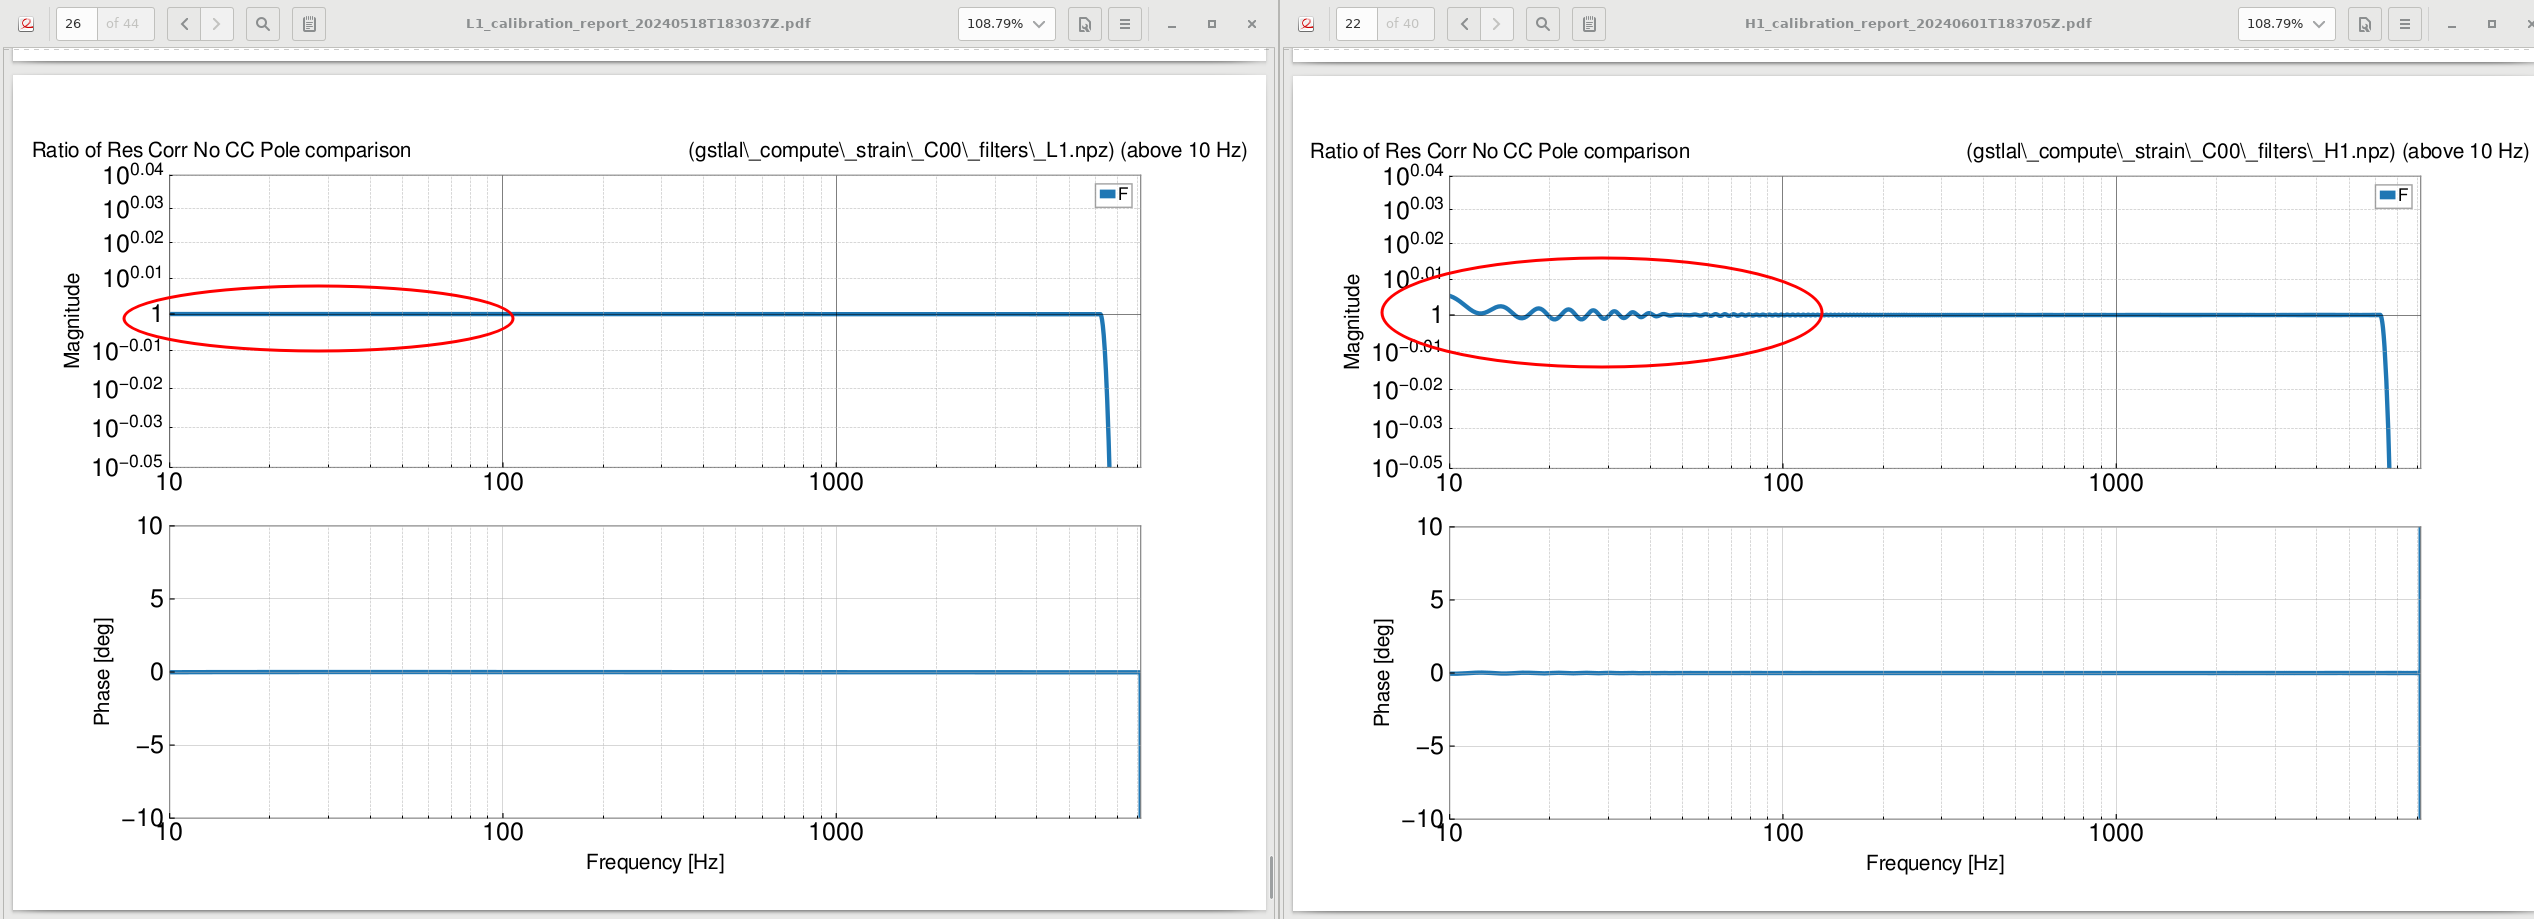
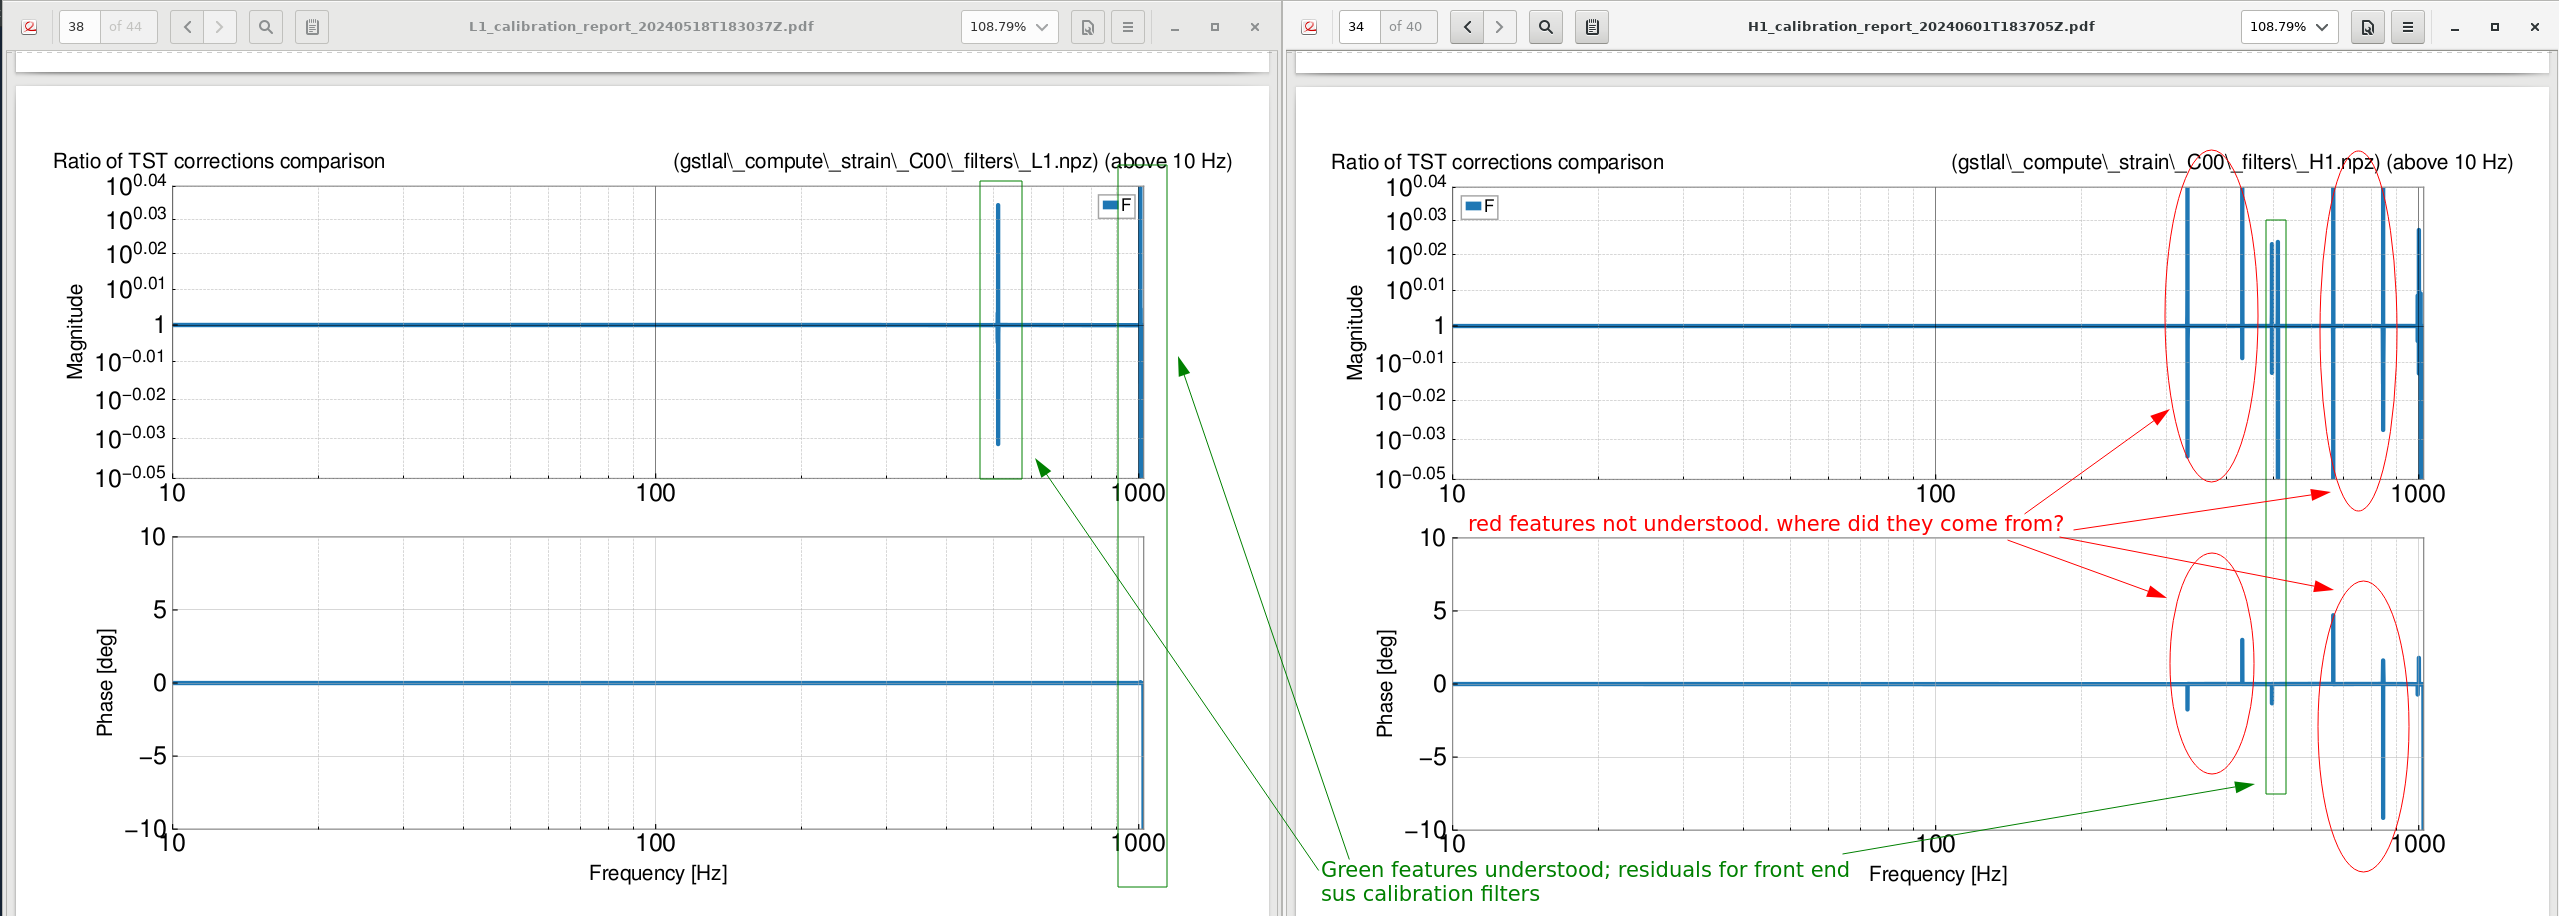
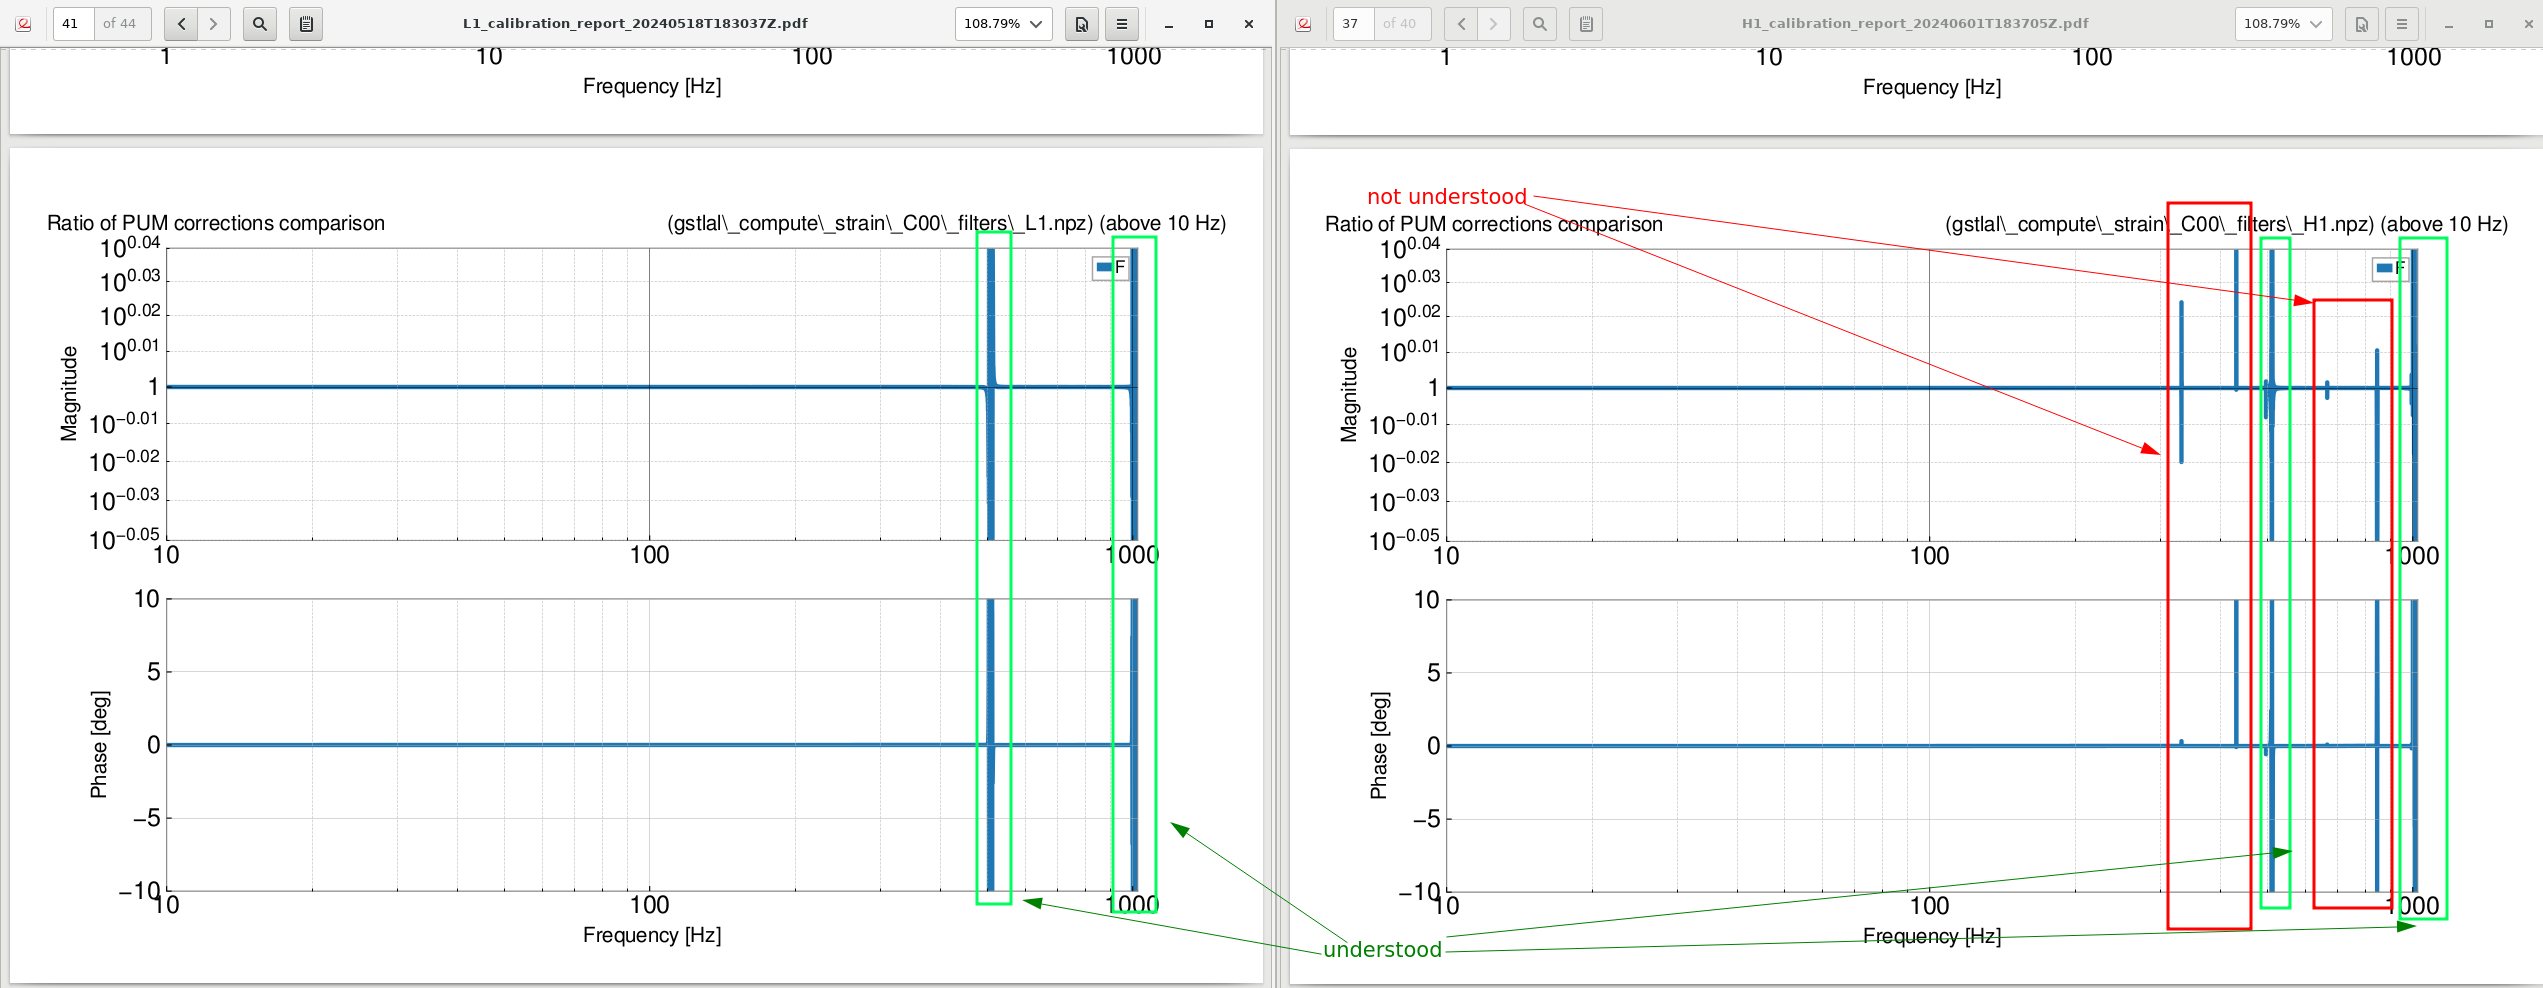
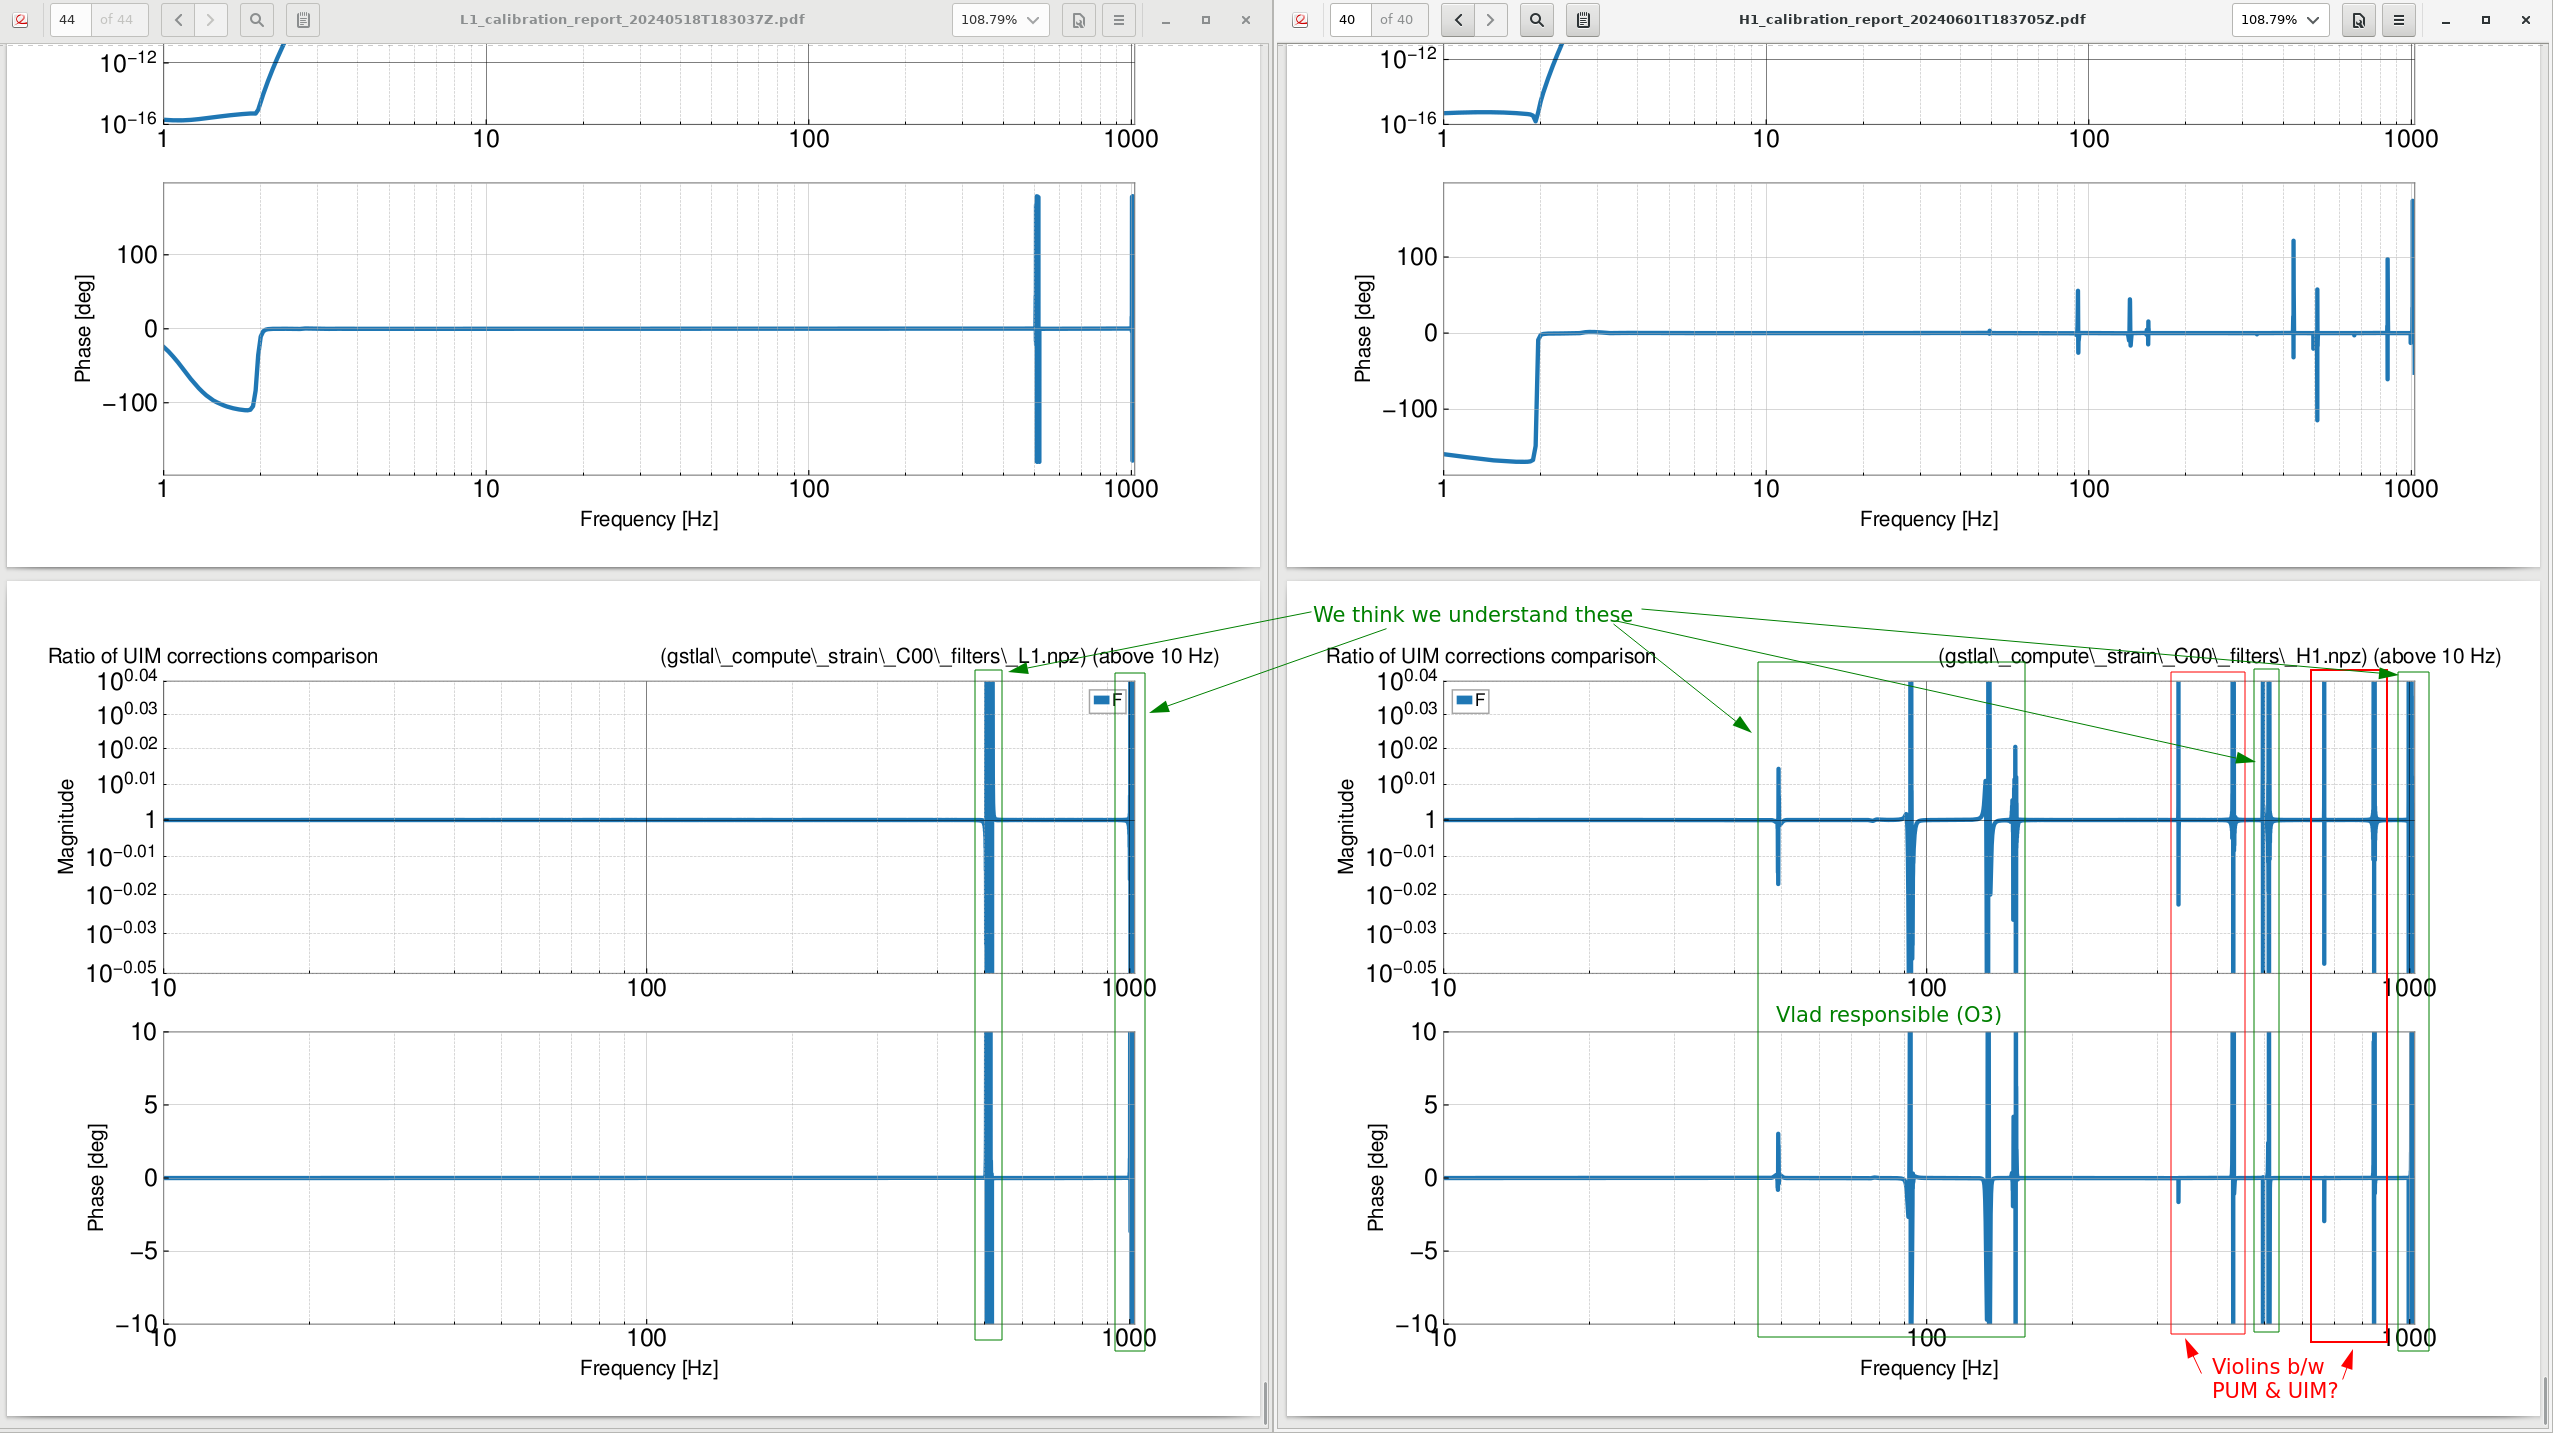
[Vlad, Louis]


We were taking a look at the GDS FIR Filter plots (pg. 21+) in the calibration reports at LHO (H1_calibration_report_20240601T183705Z.pdf) and LLO (L1_calibration_report_20240518T183037Z.pdf) side by side.

We noticed several features in the GDS FIR filter comparison plots that we don't understand.

1. res_corr_comparison.png: the LHO res corr comparison (I think this stands for "residual correction comparison") starts to run away at low frequencies (<8 Hz), while it's flat at LLO.
2. ratio_res_corr_comparison.png: LHO's "Ratio of Res Corr comparison" plot has a low frequency ripple that is not present in LLO's reports.
3. ratio_res_corr_no_cc_pole_comparison.png: same as above for the "Ratio of Res Corr No CC Pole Comparison" plots
4. ratio_tst_corrections_comparison.png: There are resonances present in LHO's "Ratio of TST corrections comparison" plots that 1.) don't appear in LLO's reports and 2.) don't match up with the violin modes at 500 Hz and 1kHz. The same is true for the PUM (ratio_pum_corrections_comparison.png) and UIM (ratio_uim_corrections_comparison.png) stages.

The biggest concern is whether these discrepancies are outside of nominal for the GDS FIR pipeline, which would mean that we are introducing additional errors in the GDS pipeline. Could it be an issue in our model of DARM somewhere along the way? Or a mismatch between CAL-CS and the model?
Images attached to this report
Non-image files attached to this report
