FranciscoL
After one week of having the inner beam centered on the Rx sensor (LHO:78810), on July 09, we moved the beam from center to the right.
This movement was done to double check the changes seen after our move on May 14 (LHO:77840). LHO_XY_Comparison_dataVmodel_1399180506-1404571480.pdf shows the full cycle and nominal results of our series of pcal beam movements, which ended on 24-07-09 @ 08:00 PT. The plot legend shows the value given by the weighted mean of each week using the mean value of each observing stretch for the distribution. The *raw* data for each observing stretch is plotted in gray but, for scaling purposes, some of that data is outside the range of the plot. The black line is what we expected the X/Y comparison to yield from the beam movements that we made. EDITORS NOTE: The vertical axis on the plot is in HOPs (Hundreth of a percent). Although some changes are unexpected, these are not concerning or significant changes that will affect LHO calibration. It is also an ongonig investigation, we are learning as we go.
The movement done in May 14 is seen on the first step of the plot, a week after having both beams centered, where the weighted mean yields a value of 0.99747 – a change of -25 HOPs from the previous week. However, as seen in the model, we expected the line to change by +19.2 HOPs. The rest of the movements *agree* with our model. Further analysis and diagnostics are pending but the main takeaway is that the data does not match the model for this one move, which motivates repeating the measurement.
During this procedure, we used keithley DVM (KVM) 1424277 instead of the FLUKE handheld DVM.
EndStationLog.pdf lists the voltage values after each significant step of procedure T2400163. The steps represent writing down a voltage value after a particular change to the beam position. Some highlights from the recorded values.
- (Both beams) We gained a digit by using the KVM but it fluctuates by ±0.0002V.
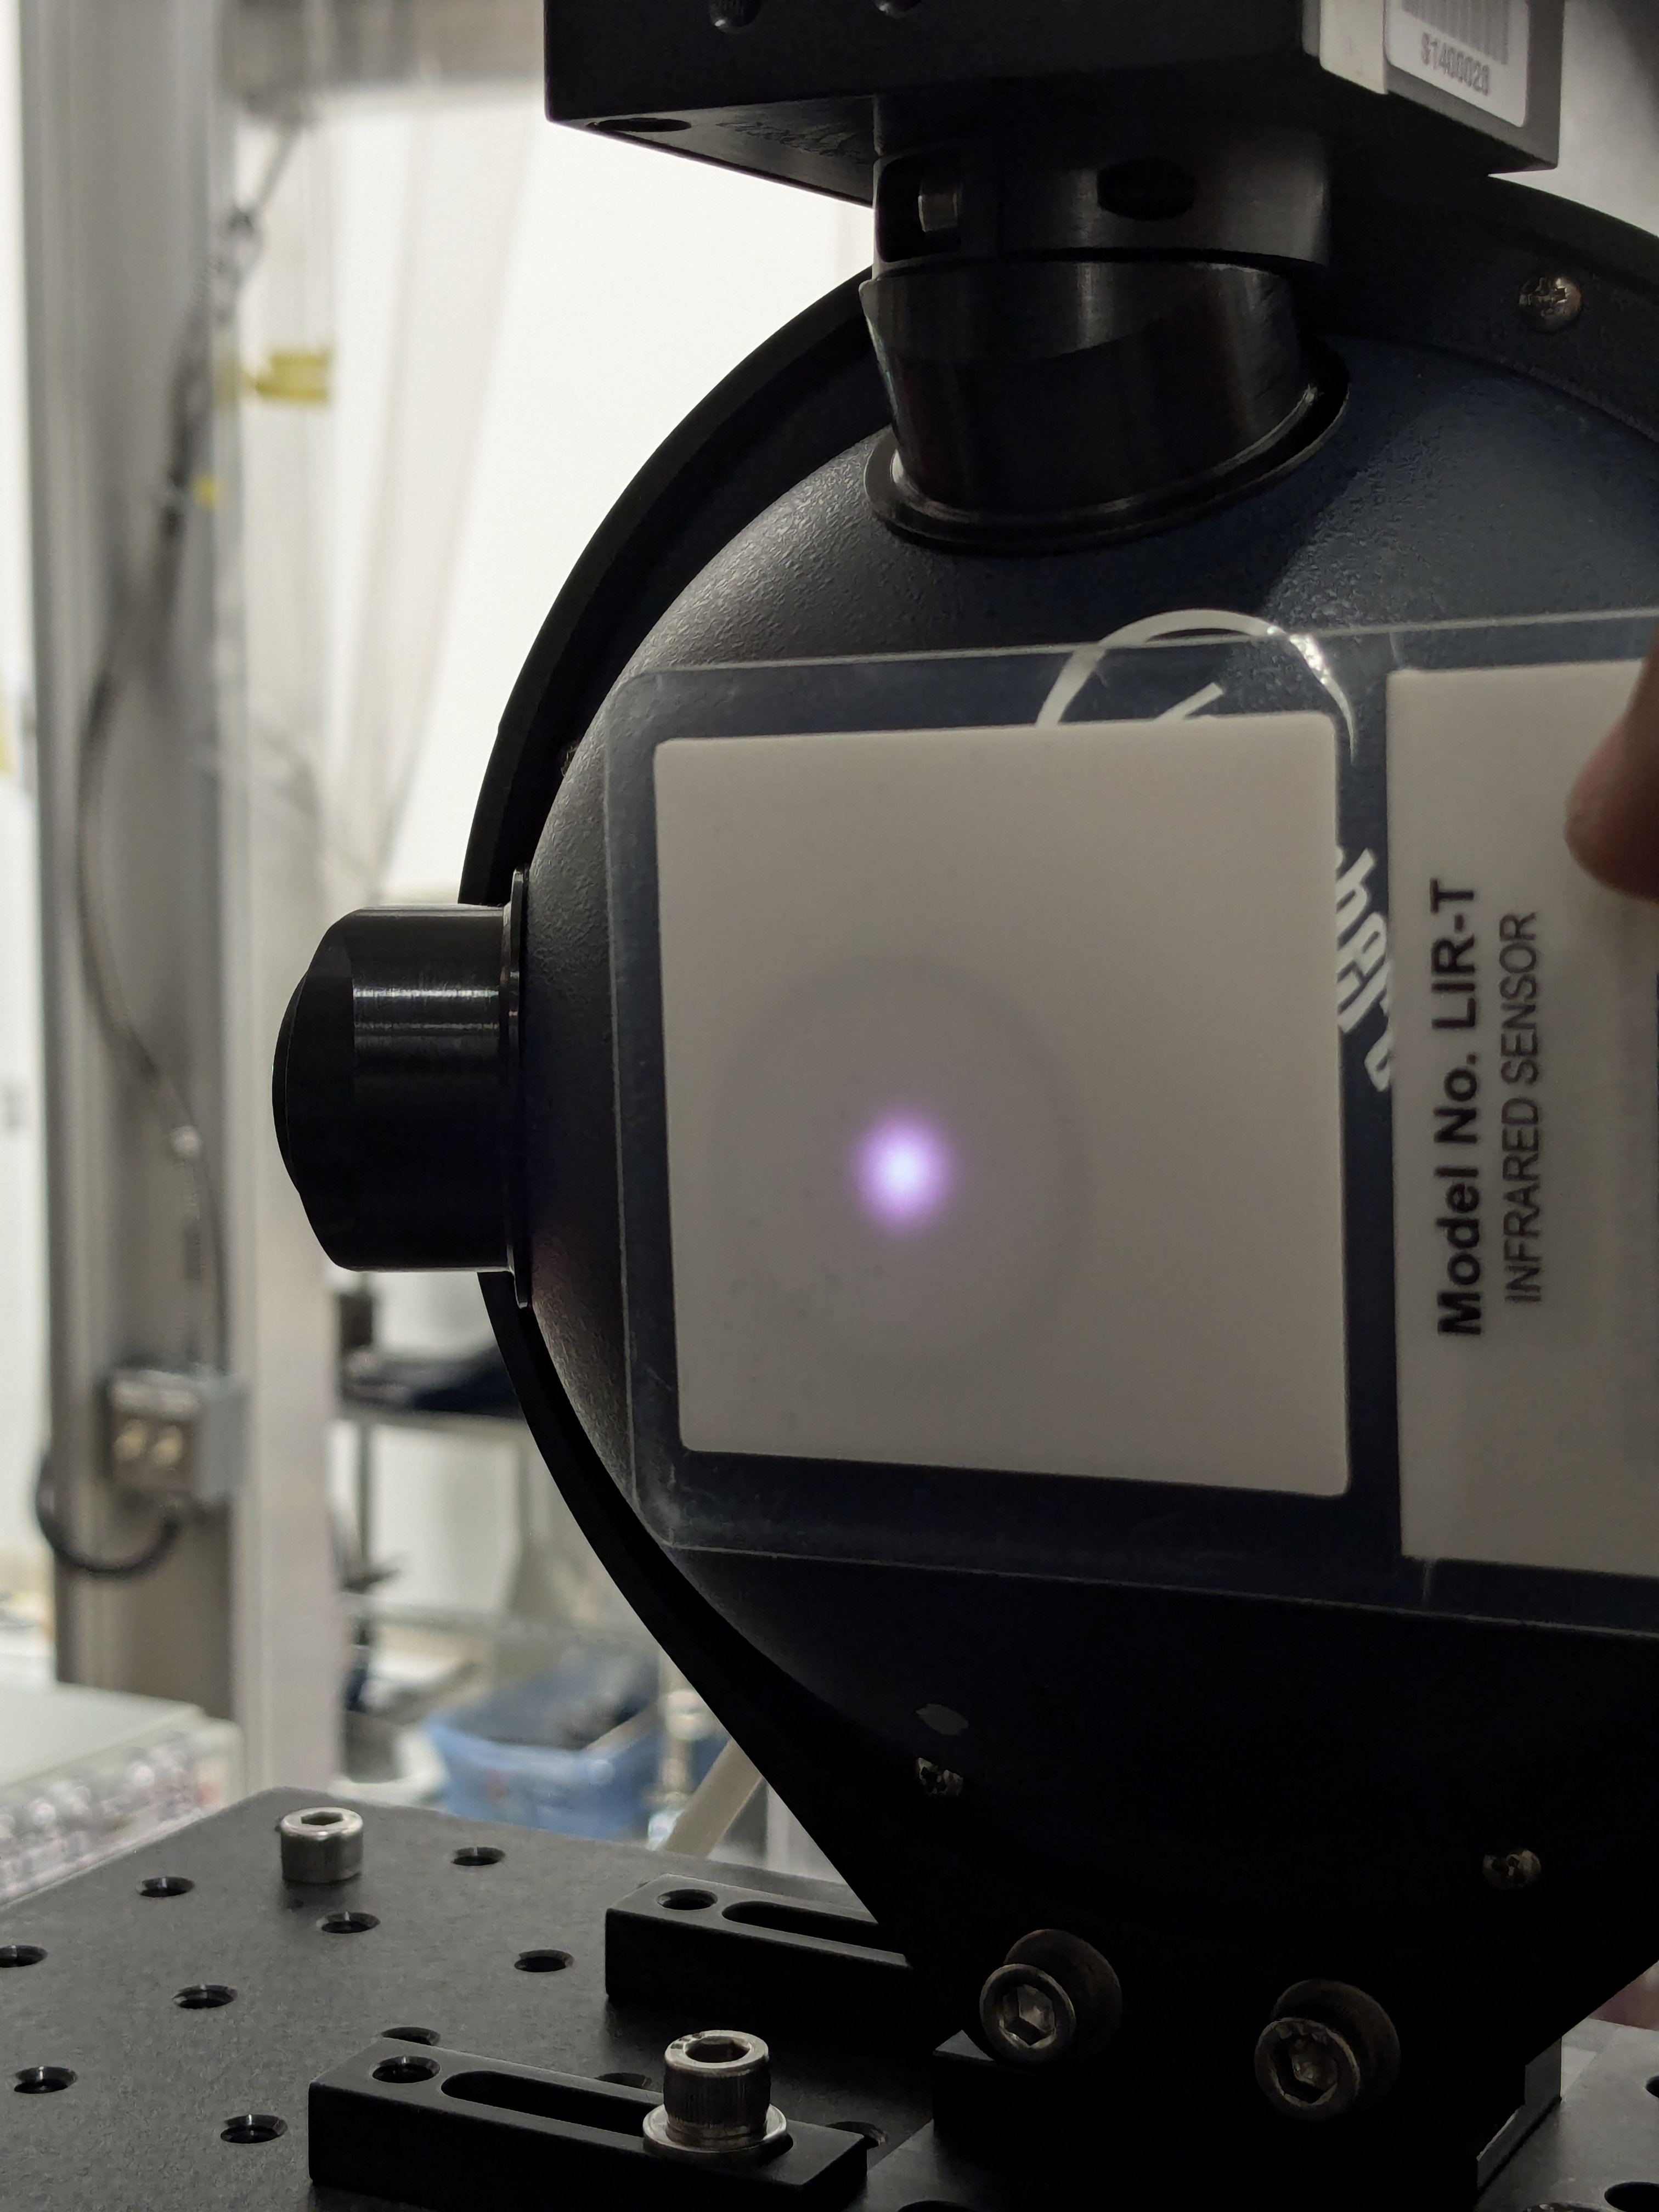
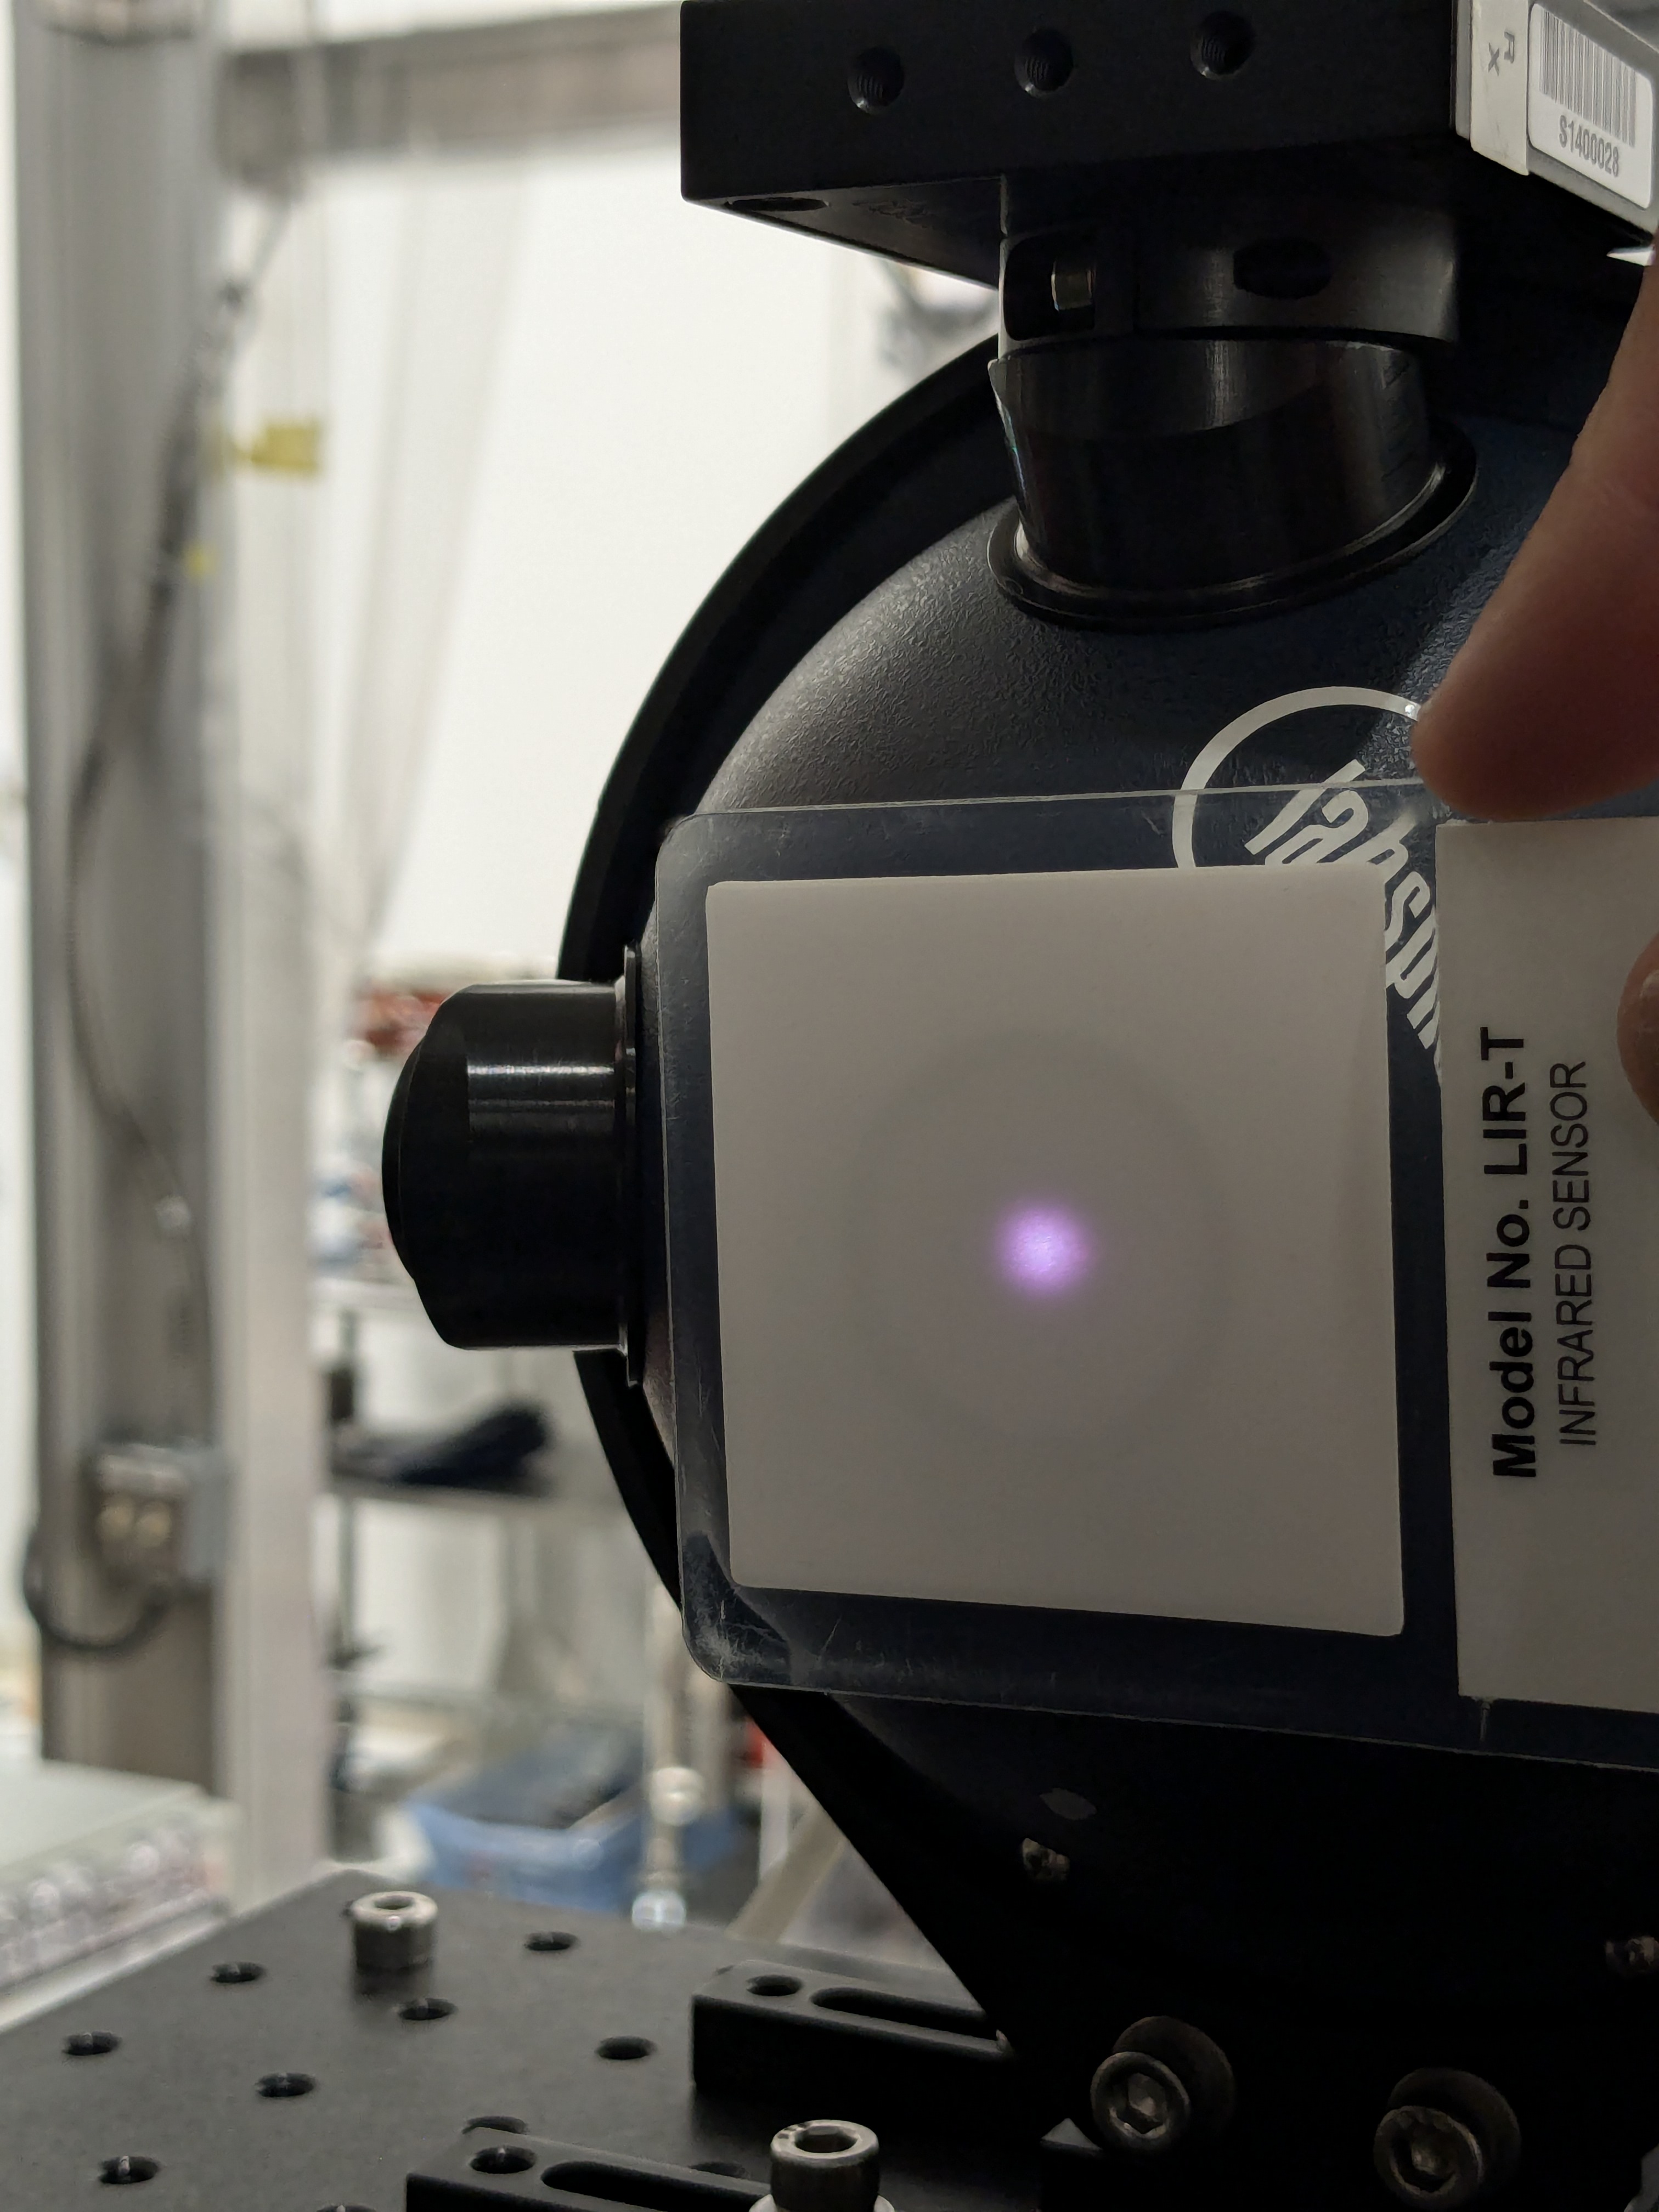
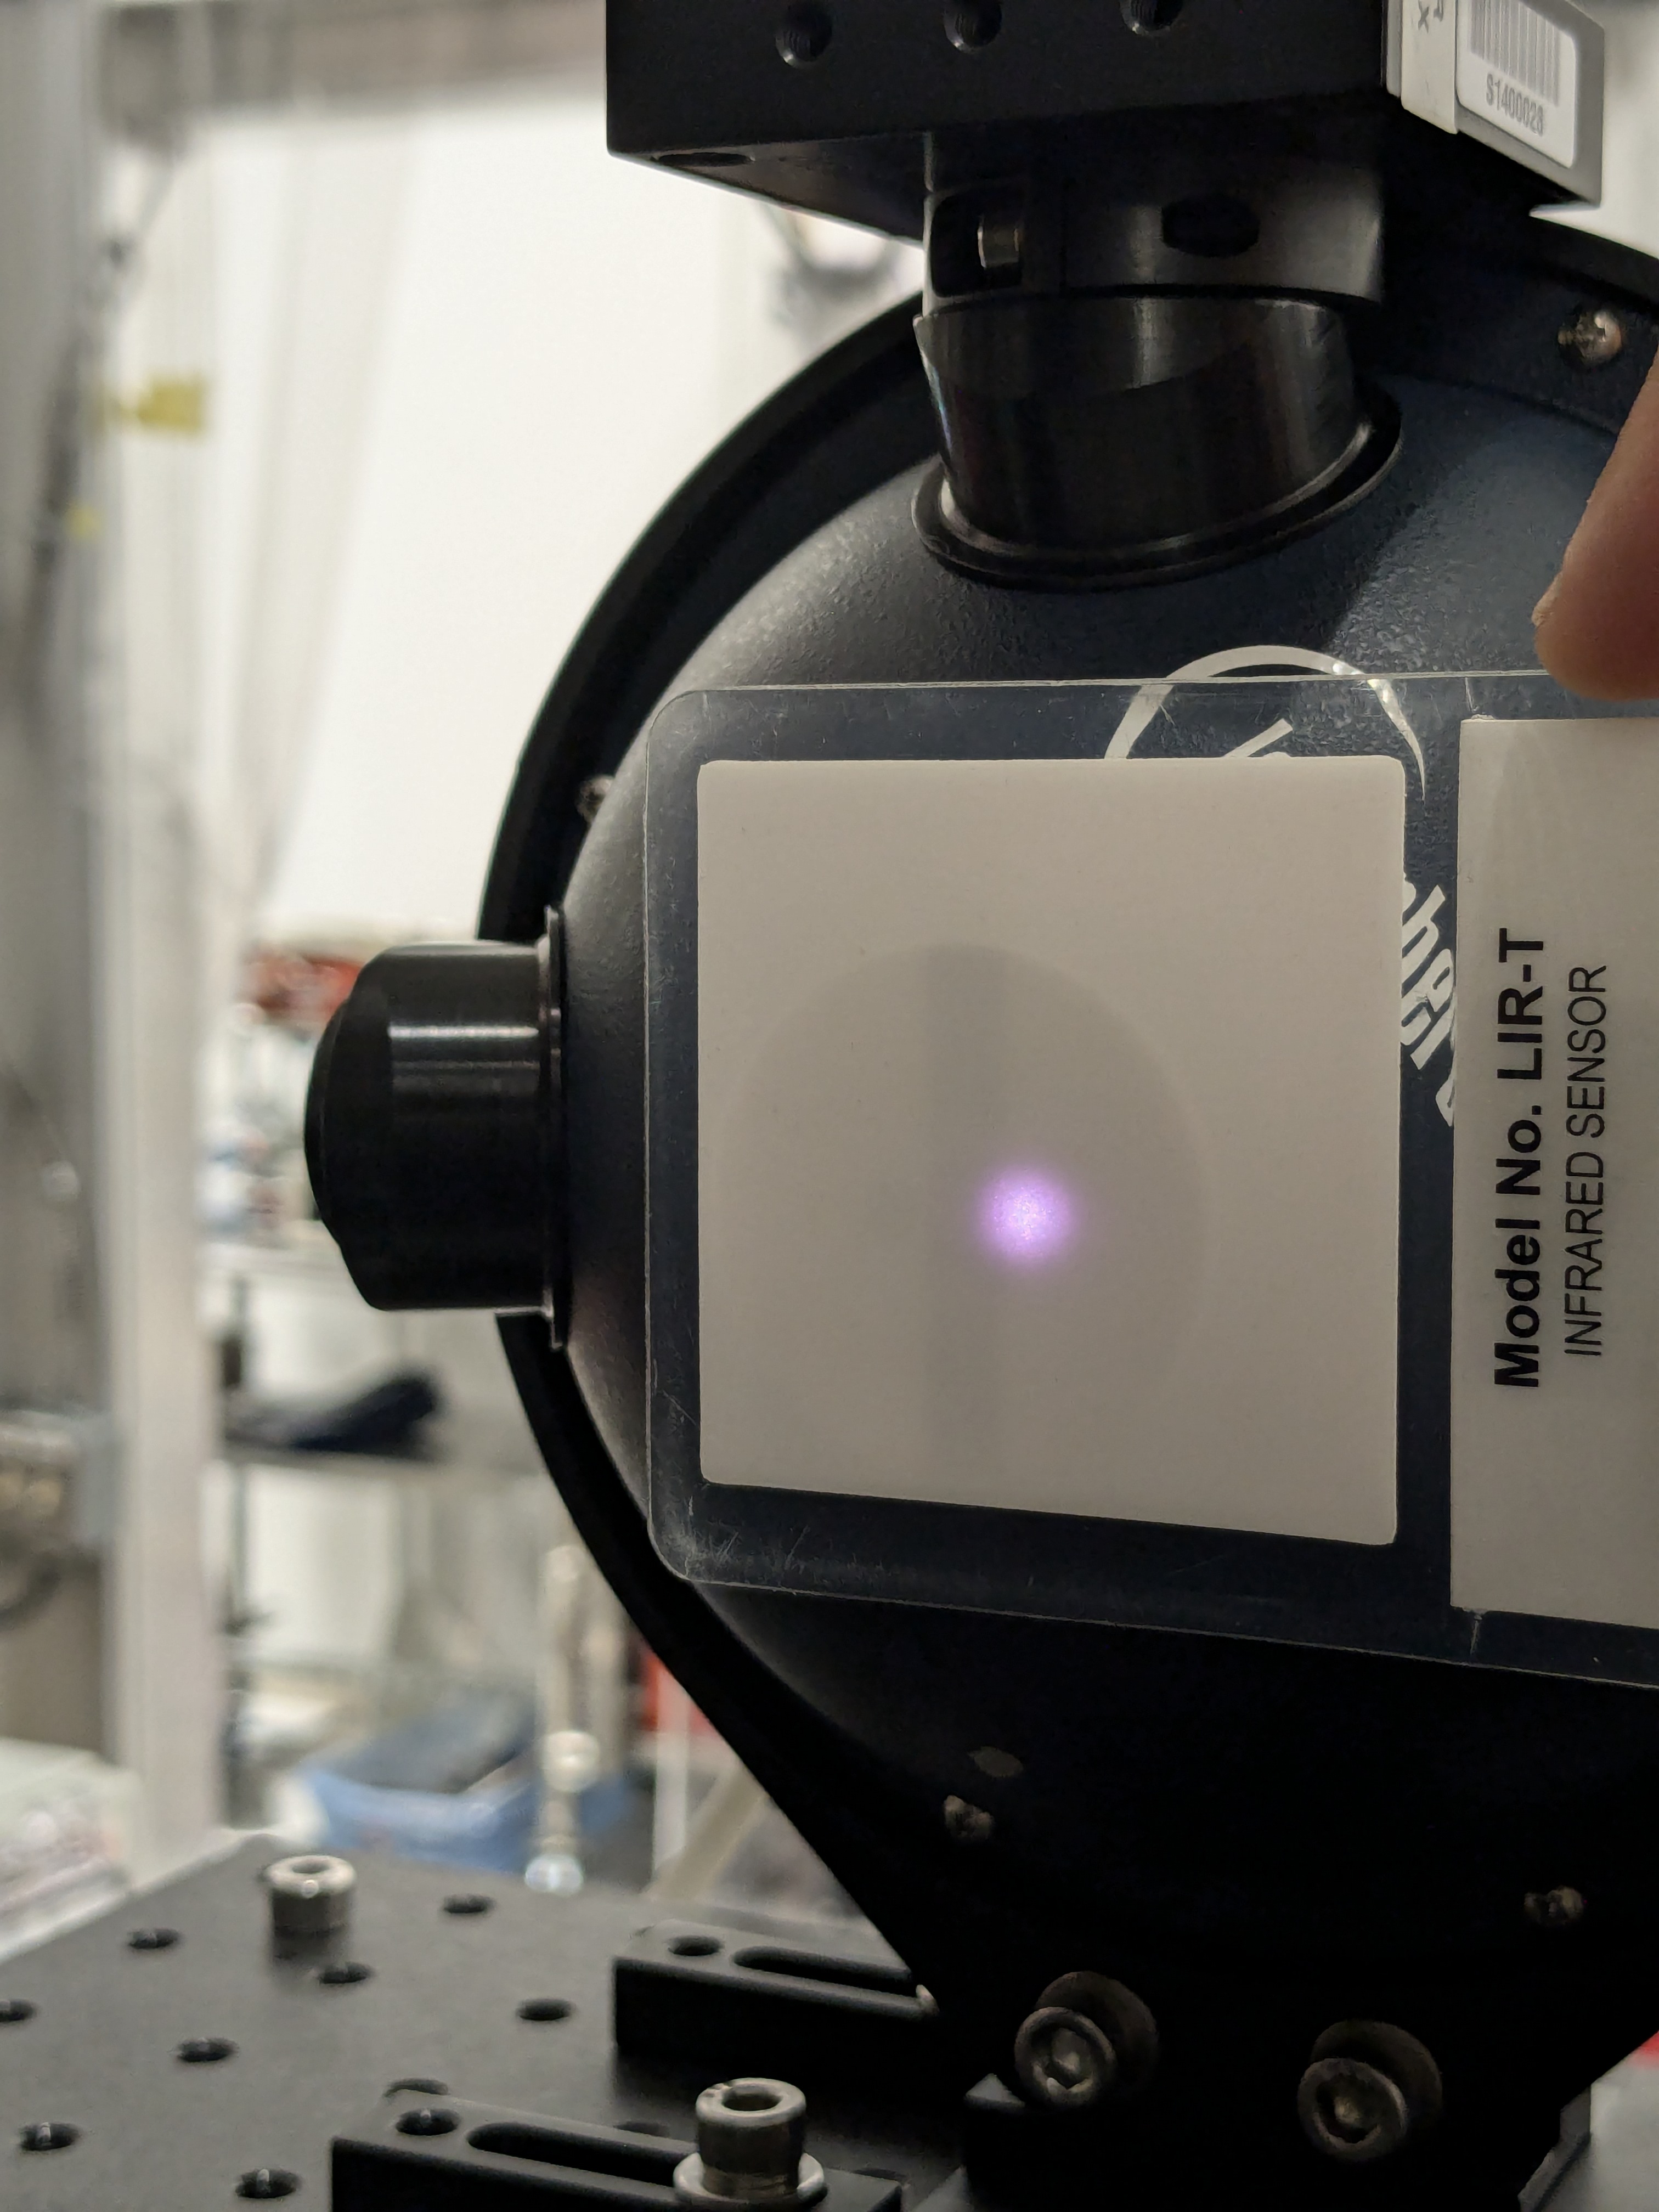
- (Target off) Finalized beam movement and recorded the voltage from the Rx sensor with the inner beam only. See InnerBeamAfter.jpg for visual proof of the movement. Voltage of 1.6820V is 10 HOPs lower to previous position (1.6836V). Fine adjustments to pitch and yaw did not improve the amplitude of the signal.
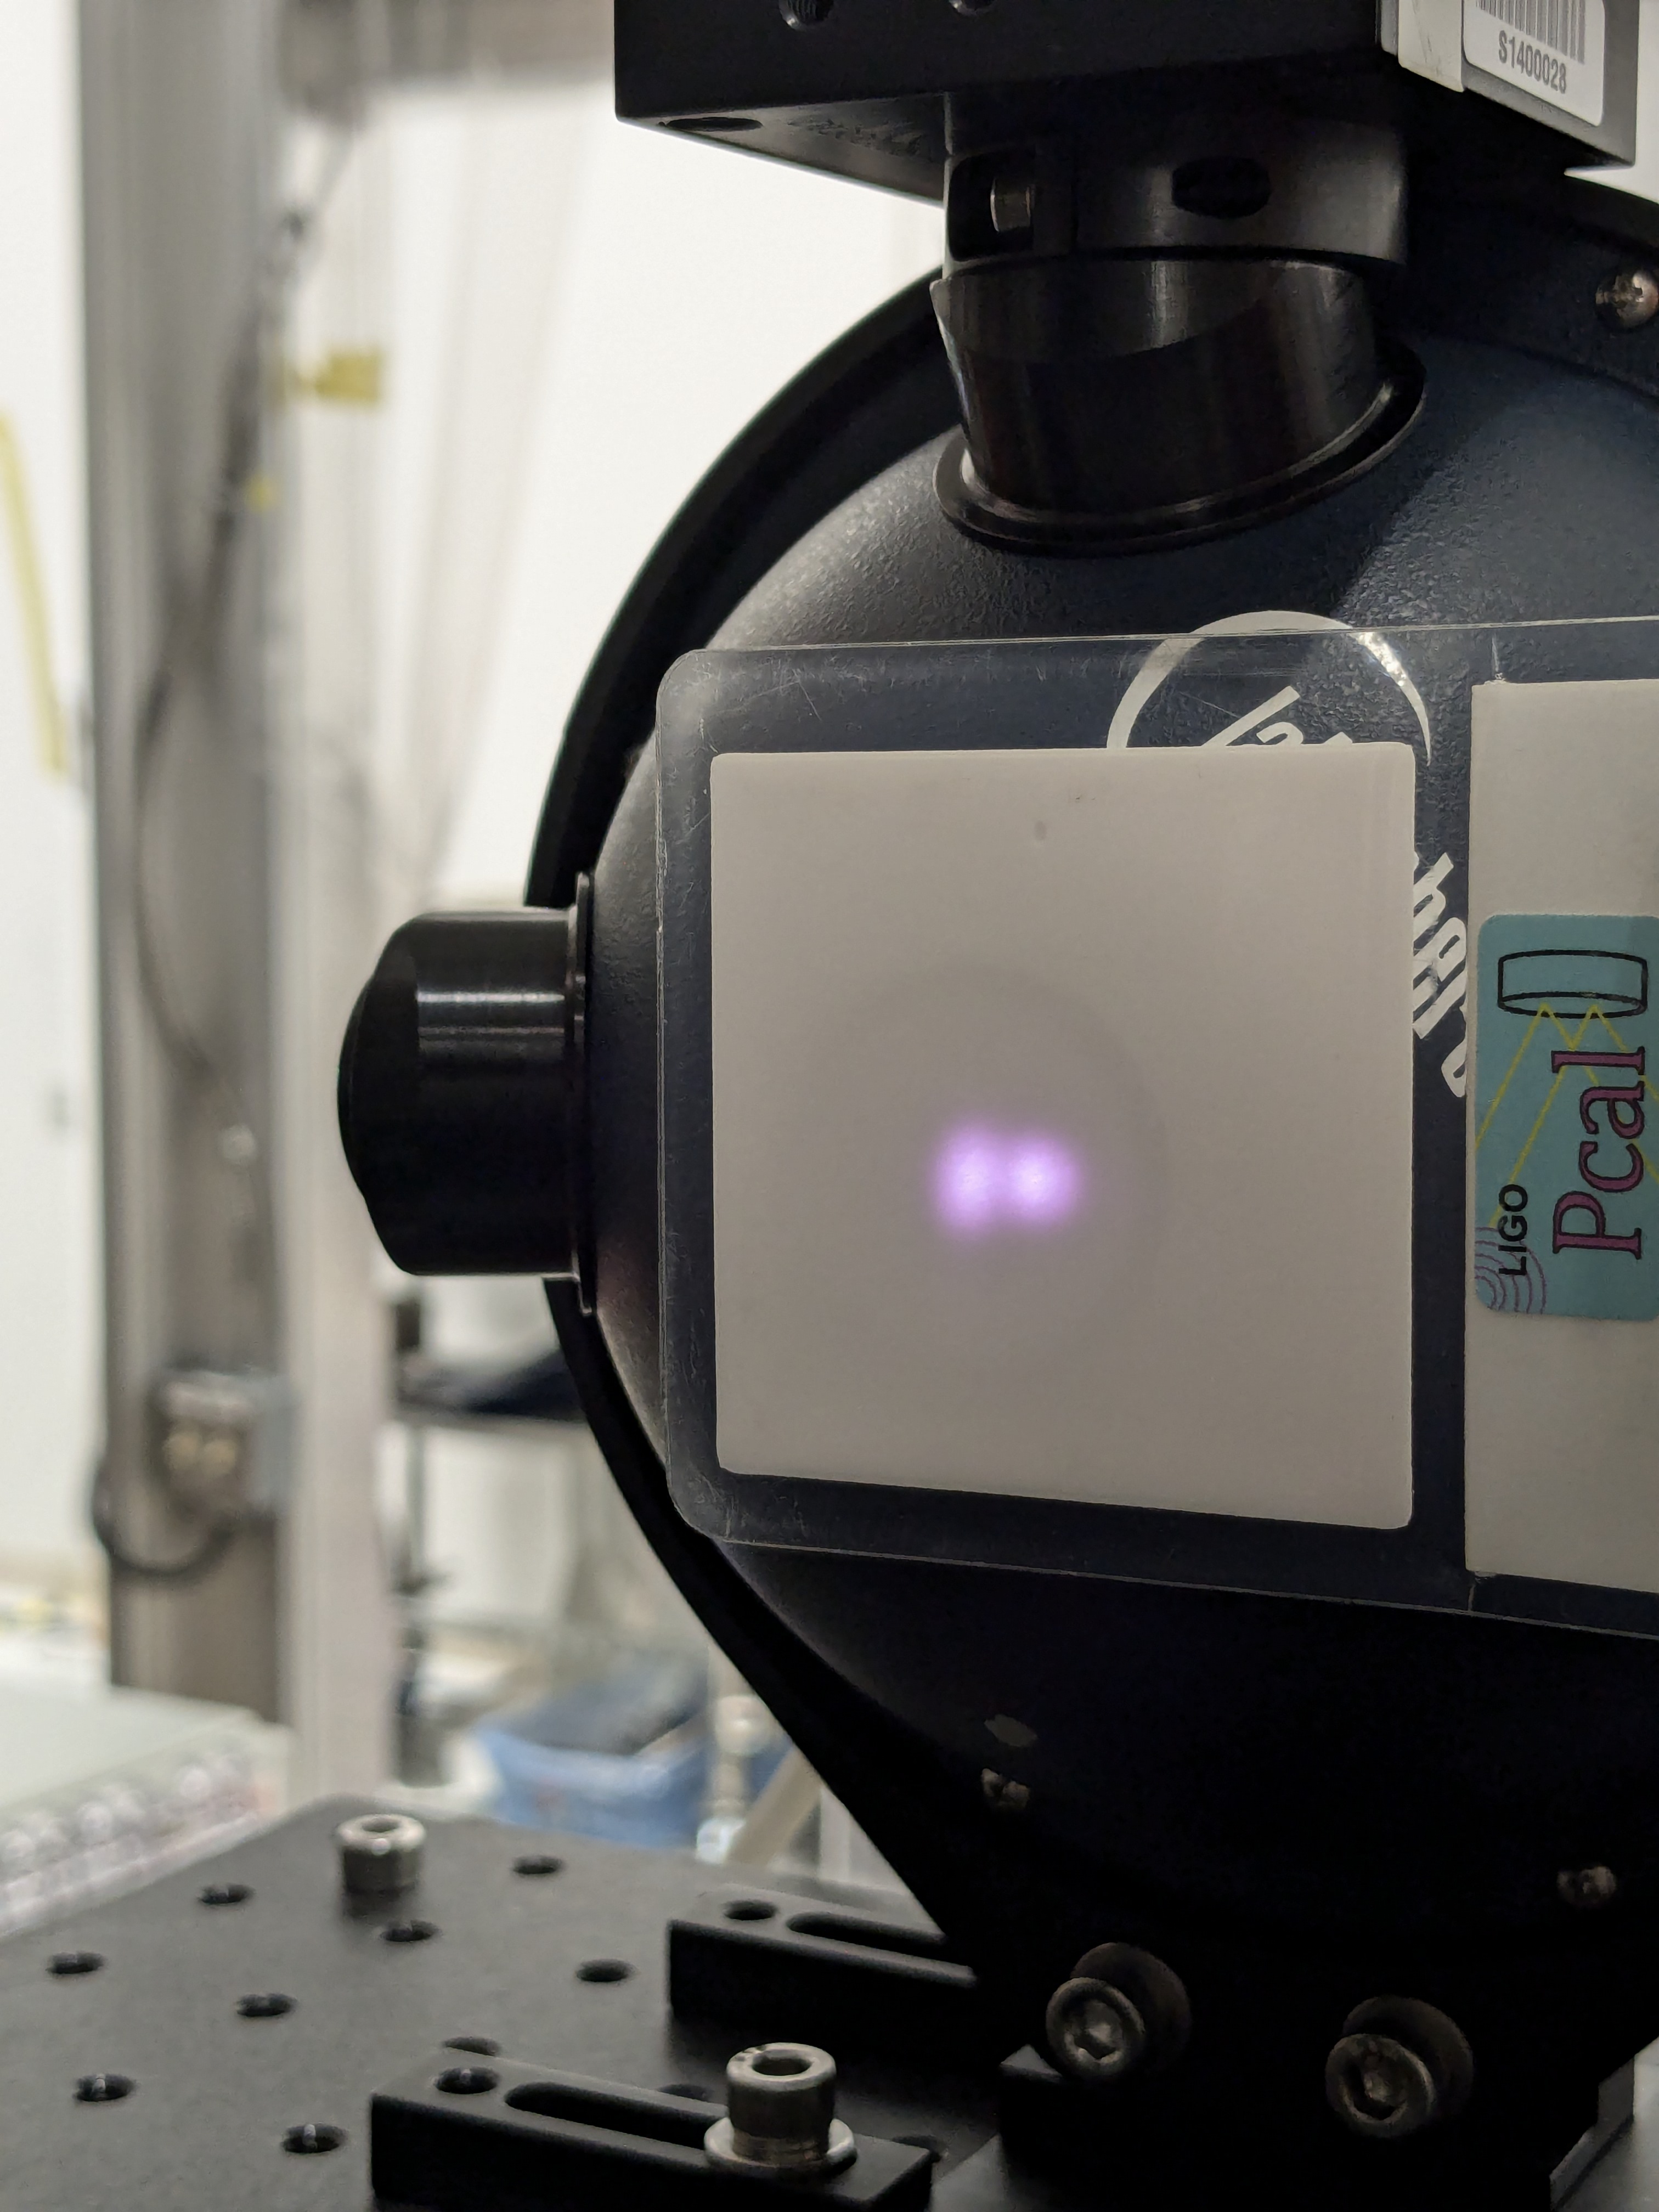
- (Both beams) The measurement was recorded after removing beam block on outer beam and removing the target. See BothBeamsAfter.jpg for the final state of the pcal beams incident on the input port of the Rx sensor. The measurement of 3.3832V is lower by 4 HOPs from the initial measurement (3.3847V).
The KVM was calibrated using a Martel voltage/current calibrator (Martel) after the procedure. The KVM was configured to a range of 10V and a resolution of 6.5 "FAST digits ("FAST" is referred to the time it takes for the ADC on the KVM to integrate; a 6.5 FAST resolution corresponds to an integration time of 16s) . The following table lists the voltages provided by the Martel and the corresponding readings displayed on KVM 1424277.
| Martel [V] | KVM [V] |
|---|---|
| 0.000 | 00.00012 |
| 3.000 | 03.00018 |
| 3.383 | 03.38328 |
| 4.000 | 04.00027 |
In summary, (1) using a KVM increased the resolution of our measurements for the beam movement procedure. (2) The 'Initial' measurement changed by 8 HOPs from the last voltage measurement from the previous movement (3.382V), done on July 02 (LHO:78810). (3) The initial and final voltage measurement during today procedure changed by 4 HOPs.