Ibrahim, Rahul
BOSEM counts have been visibly drifting over the last few days since I centered them last week. Attached are two screenshots:
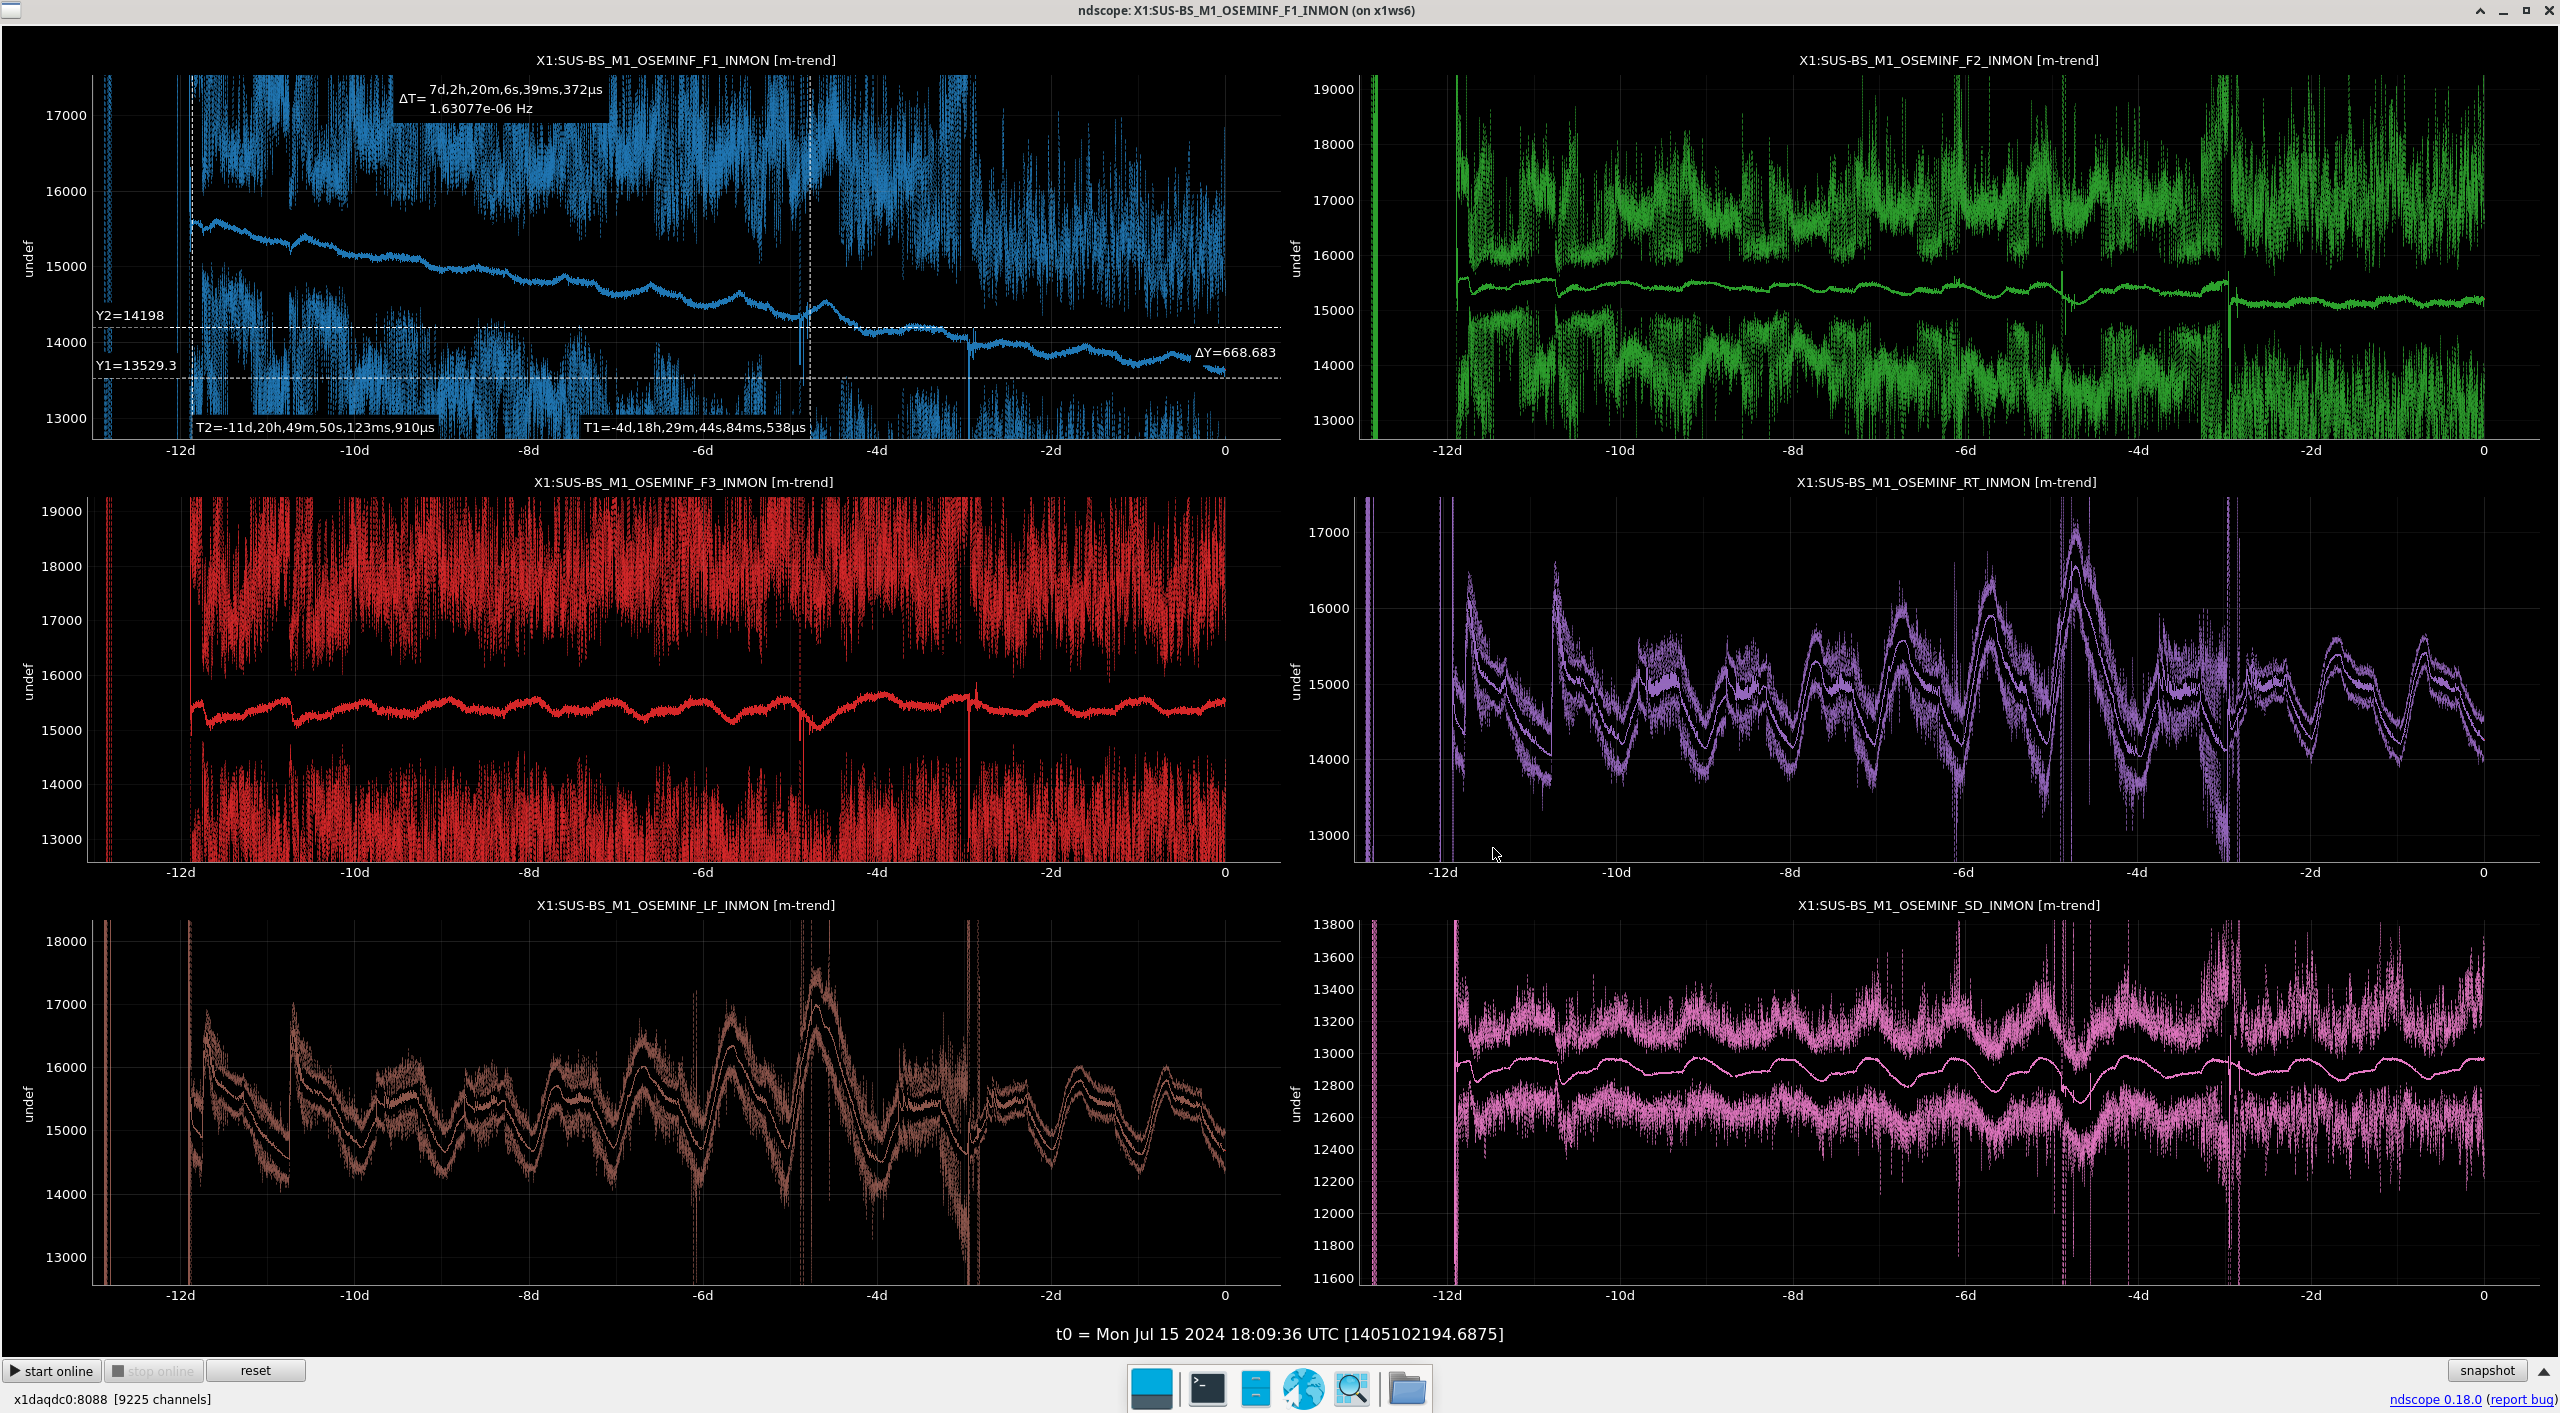
- Screenshot 1 shows the 48hr shift of the BOSEM counts as the temperature is varying
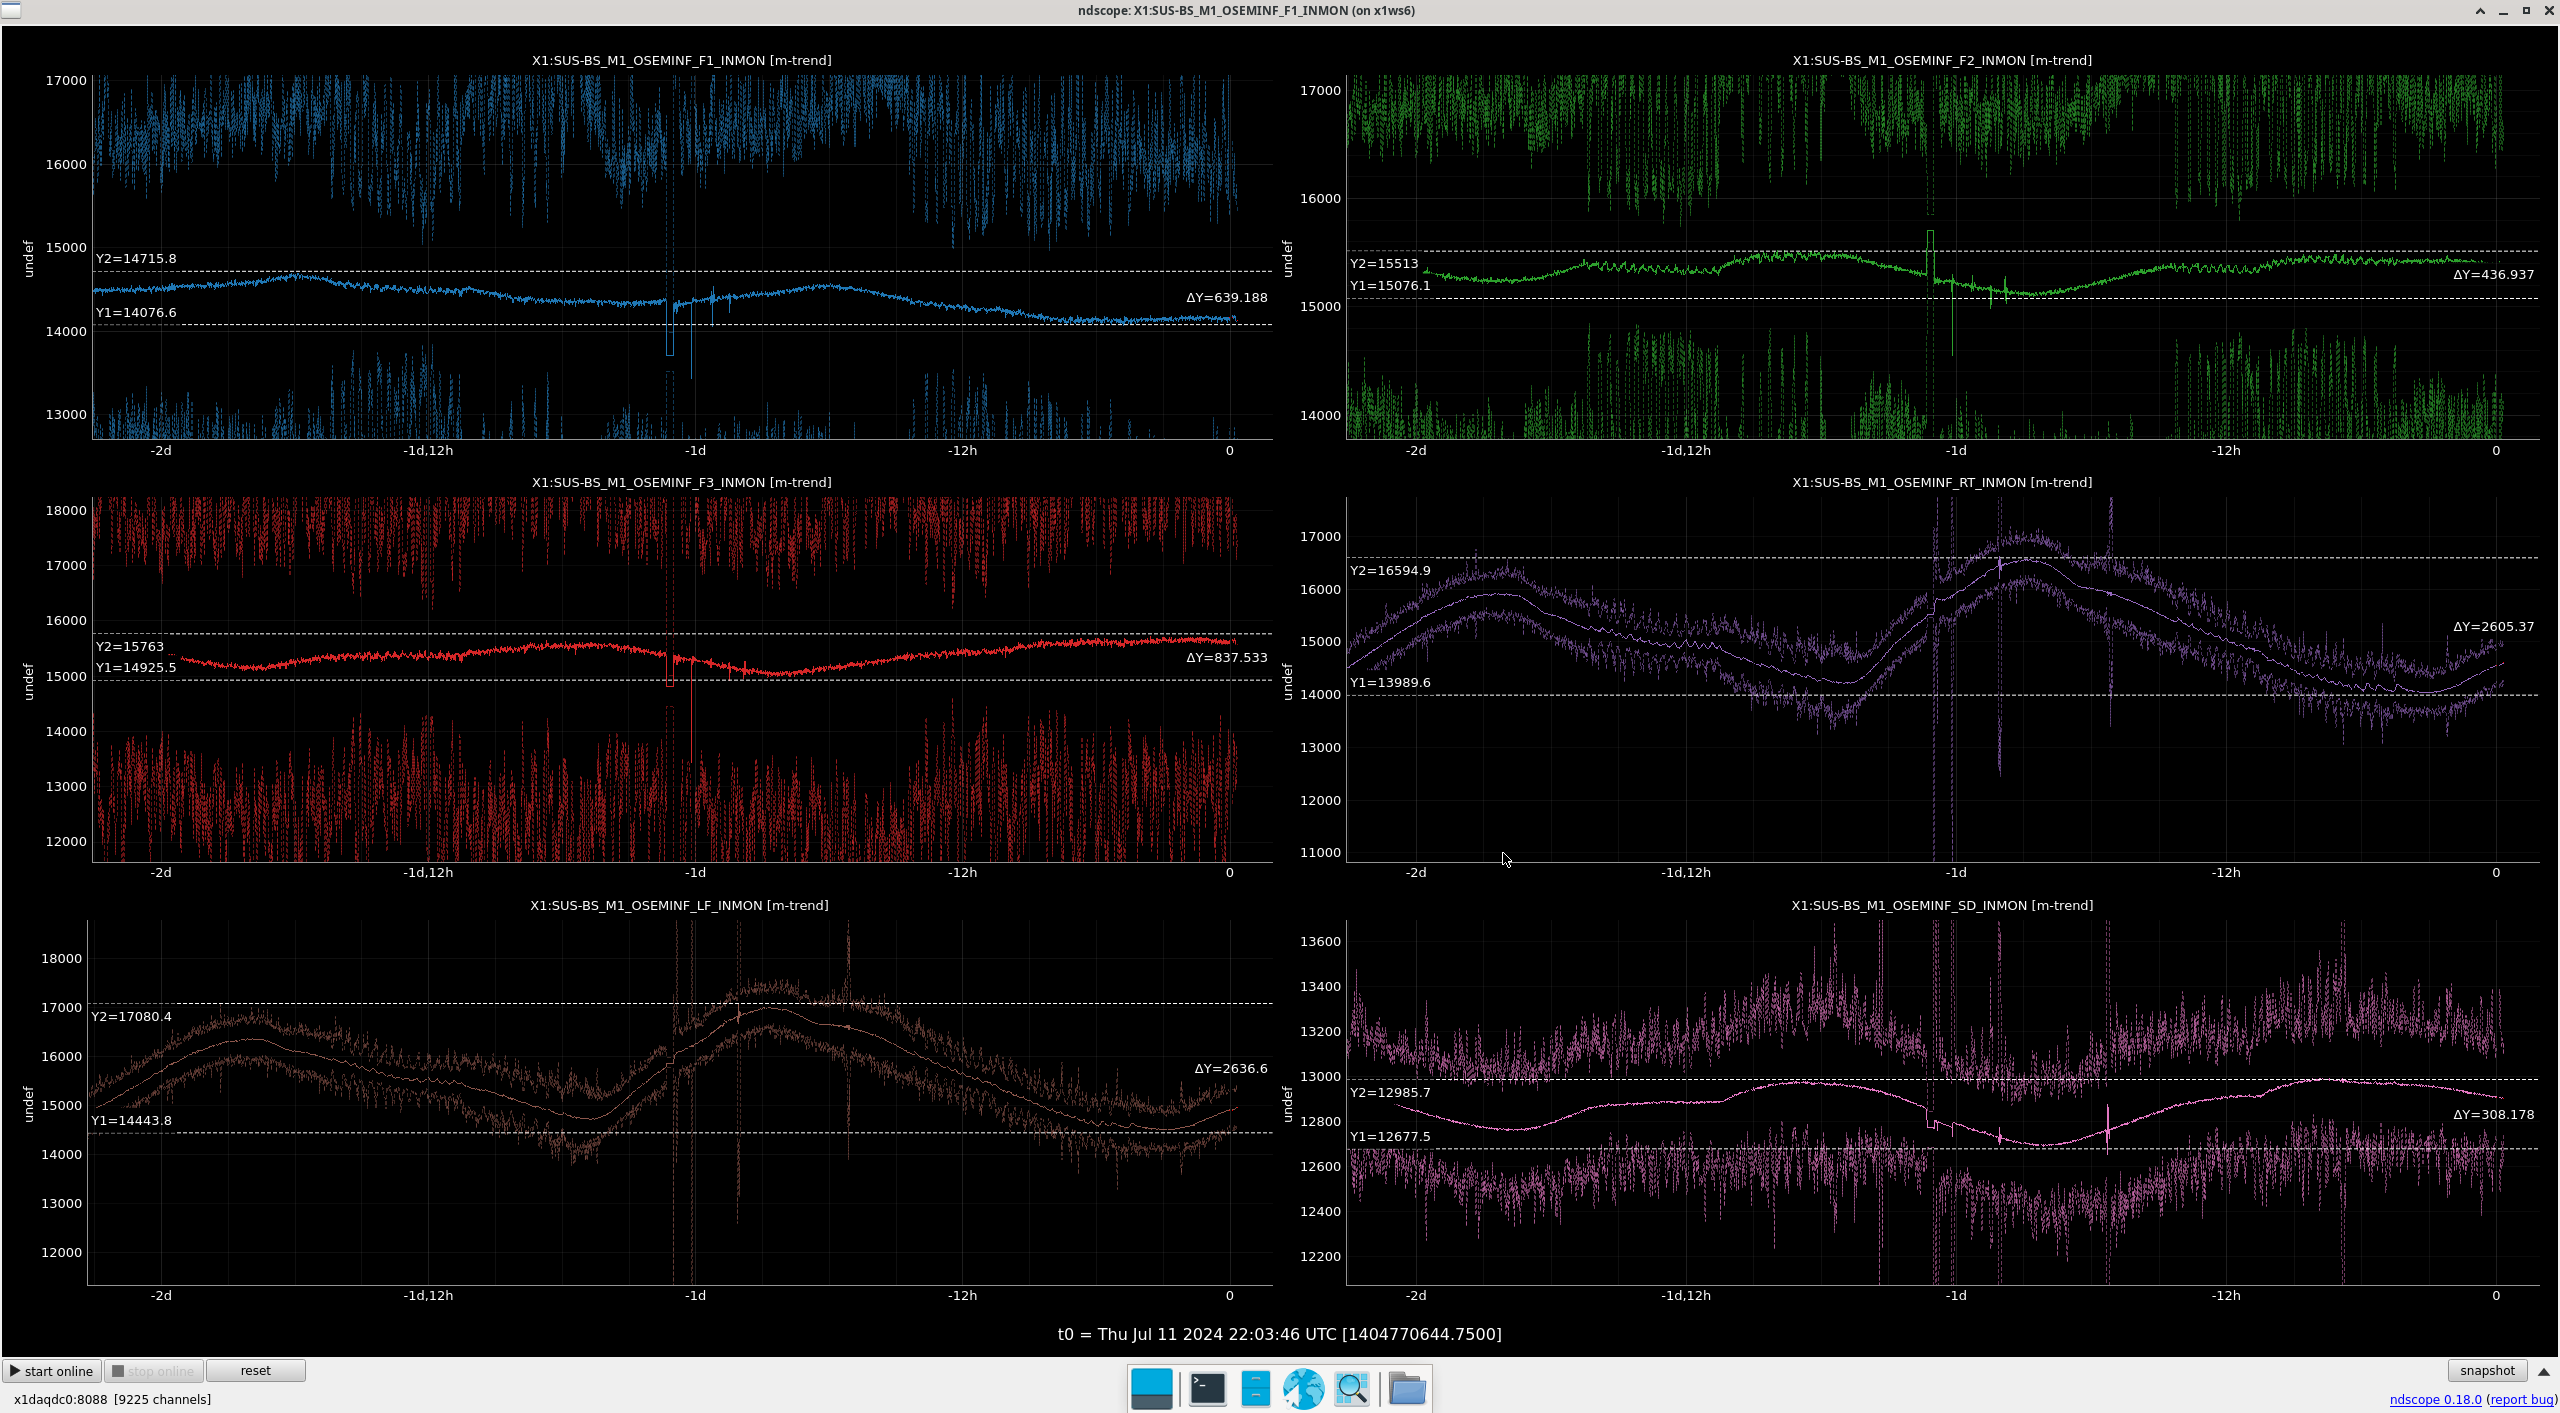
- Screenshot 2 shows the full 8 day drift since I centered the OSEMs.
I think this can easily be explained by Temperature Driven Suspension Sag (TDSS - new acronym?) due to the blades. (Initially, Rahul suggested maybe the P-adjuster was loose and moving but I think the cyclic nature of the 8-day trend disproves this)
I tried to find a way to get the temp in the staging building but Richard said there's no active data being taken so I'll take one of the thermometer/temp sensors available and place it in the cleanroom when I'm in there next, just to have the available data.
On average, the OSEM counts for RT and LF, the vertical facing OSEMs have sagged by about 25 microns. F1, which is above the center of mass, is also seeing a long-term drift. Why?
- Is this because there's an ever-so-slight P instability, so the sag "reveals" it?
- Is it because the blades are differentially sagging
- Is it because (assuming temp. driven DC sag offset), the flag is slowly moving up or down and allowing less light in?
More importantly, how does this validate/invalidate our OSEM results given that some were taken hours after others and that they were centered days before the TFs were taken?
Ibrahim
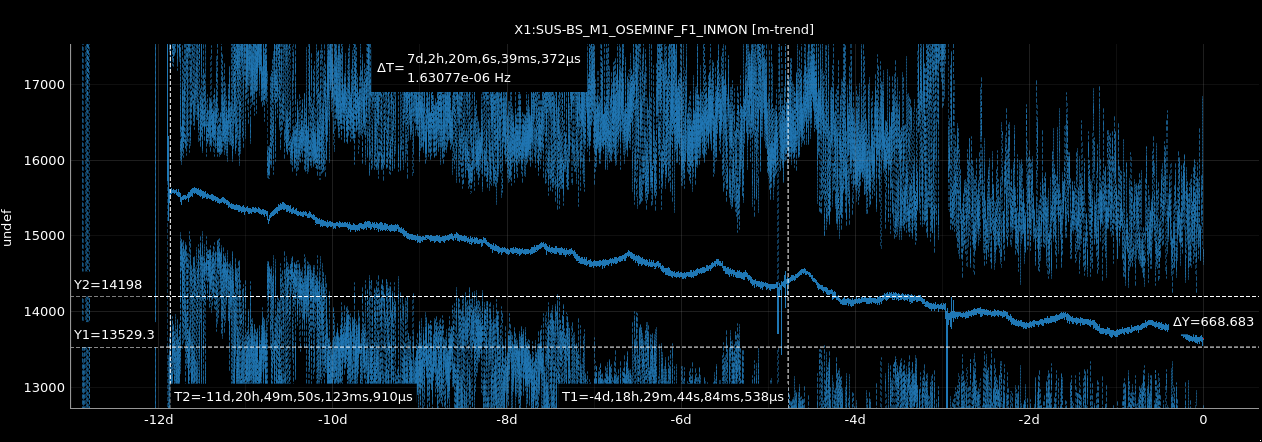
Taking new trends today shows that while the suspension sag "breathes" and comes back and forth as the temperature fluctuates on a daily basis, the F1 OSEM counts are continuing to trend downwards despite temperature not changing peak to peak over the last few days.
This F1 OSEM has gone down an additional 670 cts in the last 4 days (screenshot 1). Screenshot 2 shows the OSEM counts over the last 11 days. What does this tell us?
What I don't think it is:
- It somewhat disproves the idea that the F1 OSEM drift was just due to the temperatures going up, since they have not leveled out as the temperatures have - unless for some reason something is heating up more than usual
- A suggestion was that the local cleanroom temperature closer to the walls was hotter but this would have an effect on all OSEMs on this face (F2 and F3), but those OSEMs are not trending downwards in counts.
- It is likely not an issue with the OSEM itself since the diagnostic pictures (alog 79079) do show a percieveable shift when there wasn't one during centering, meaning the pitch has definitiely changed, which would show up on the F1 OSEM necessarily.
What it still might be:
- The temperature causes the Top Stage and Top Mass blades to sag. These blades are located in front of one another and while the blades are matched, they are not identical. An unlucky matching could mean that either the back top stage blade or two of the back top mass blades could be sagging net more than the other two, causing a pitch instability. Worth check
- It is not temperature related at all, but that the sagging is revealing that we still have our hysteresis issue that we thought we fixed 2 weeks ago. This OSEM has been drifting in counts ever since it was centered, but the temperature has also been drastically in that time (50F difference between highs and lows last week).
Next Steps:
- I'm going to go set up temperature probes in the cleanroom in order to see if there is indeed some weird differential temperature effect specifically in the cleanroom. Tyler and Eric have confirmed that the Staging Building temperature only really fluctuates between 70 and 72 so I'll attempt to reproduce this. This should give more details about the effect of temperature on the OSEM drift.
- See using the individual OSEM counts and their basis DOF matrix transformation values if there's a way to determine that some blades are sagging more than others via seeing if other OSEMs are spotting it.
- Ultimately, we could re-do the blade position tests to difinitively measure the blade height changes at different temperatures. I will look into the feasibility of this.